
 ?Mathematical formulae have been encoded as MathML and are displayed in this HTML version using MathJax in order to improve their display. Uncheck the box to turn MathJax off. This feature requires Javascript. Click on a formula to zoom.
ABSTRACT
Changes in glaciers in response to climate change in the eastern Nyainqêntanglha Range were studied using Landsat TM/ETM+/OLI. The entire mountain range contained approximately 6,426 glaciers, covering an area of 6508.03 ± 252.02 km2 in 1999. The glaciers shrank from 1999 to 2015 and the total ice cover was reduced by 1285.99 ± 6.01 km2, accounting for 19.76 ± 3.78% of the glacierized area in 1999. The mean loss of glacier area was 1.24%•a−1 during 1999–2015. The analysis of meteorological data showed a remarkable pattern in mean annual air temperature (especially after 1998), whereas the annual precipitation displayed a stable pattern from 1989 to 2011. The glacier shrinkage in the region can probably be attributed to the increase in air temperature. The largest glaciers in the area show a maximum elevation of about 5,200–5,400 m a.s.l. in 1990, 2013, and 2015. The altitude of glaciers varied from 4,000 m a.s.l. to 6,000 m a.s.l. and the majority of the glaciers were distributed between 4,800 m and 5,800 m. All glaciers, regardless of their orientation, have shrunk, but glaciers mainly south-facing retreated faster than those facing others directions.
Introduction
Glaciers located around the Asian highlands play an important role in the local water cycle (Fujita, Ohta, and Ageta Citation2007). They collect solid precipitation in winter and release it with a seasonal delay as meltwater in the summer (Hagg et al. Citation2007). Thus, they provide an important and reliable water supply for downstream populations and natural systems during drought years when other water sources are depleted (Meier et al. Citation2007; Immerzeel, van Beeke, and Bierkens Citation2010; Narama et al. Citation2010; Jacob et al. Citation2012). However, they can also cause natural hazards, which represent a continuous threat to human lives and infrastructure in many places, such as glacial lake outburst floods (GLOFs) and landslides (Kääb, Reynolds, and Haeberli Citation2005). So it is very important to accurately evaluate glacier area changes for water management and supply (Wang et al. Citation2013, Citation2014). Because of their high sensitivity to changes in the climatic environment (Haq, Jain, and Menon Citation2012), glaciers are regarded as a key indicator for early detection of global climate change (e.g., Dyurgerov and Meier Citation2000; Kääb et al. Citation2012; Masiokas et al. Citation2008; Oerlemans Citation2005; Yao et al. Citation2012). Based on remote sensing data, several studies have shown glacier recession on the Tibetan Plateau throughout the past fifty years (Bolch et al. Citation2010a; Ding et al. Citation2006; Duan et al. Citation2009), and this recession has accelerated in the past decade (Tian, Yang, and Liu Citation2014; Wang et al. Citation2013). Therefore, changes in glacier coverage must be closely monitored as climate change continues. Although glacier changes have been observed since an early comprehensive field survey of glaciers in 1958 (Ren Citation1988), long-term observations of glacier changes, as well as of the relationship between these variations and climate change at high altitudes, have been limited in highly rugged terrains and under harsh weather conditions. Multi-temporal remote-sensing and multi-spectral image data is ideal to obtain and study glacier changes at higher elevations simultaneously providing detailed information regarding the present state of glaciation (Paul Citation2000; Bolch et al. Citation2010a).
Few studies have reported glacier area changes, glacier distribution characteristics, and the relationship between glacier variations and climate change for the entire region of the eastern Nyainqêntanglha Range. Only parts of the region or the mass balance of glaciers near the eastern Nyainqêntanglha Range are addressed by previous studies (Gardelle et al. Citation2013; Ji, Yang, and Li Citation2014; Loibl, Lehmkuhl, and Grießinger Citation2014; Loibl and Lehmkuhl Citation2015; Yang et al. Citation2010, Citation2011, Citation2013). In this study, we analyzed glacier area changes and glacier characteristics throughout the period 1999–2015 using Landsat TM, ETM+, and OLI data and the Advanced Thermal Emission and Reflection Radiometer (ASTER) Global Digital Elevation Model (GDEM). The aims of this study are to (1) extract the glacier extents of 1999, 2013, and 2015 for the eastern Nyainqêntanglha Range using Landsat scenes; (2) identify glacier spatial distribution characteristics and present a detailed analysis of glacier changes; and (3) attempt to explain the possible climatic drivers for detected glacier variations.
Study area
The eastern Nyainqêntanglha Range is located at the southeastern margin of the Tibetan Plateau, and covers an area of approximately 80,000 km2 (Loibl, Lehmkuhl, and Grießinger Citation2014). It divides the watershed of the Nujiang and Yarlung Tsangpo (). This eastern Nyainqêntanglha Range consists of high mountains with numerous summits higher than 6,000 m a.s.l. Average ridge altitudes increase from approximately 4,500 m a.s.l. to 5,700 m a.s.l. in the main range of the eastern Nyainqêntanglha Range (Loibl and Lehmkuhl Citation2015). The glaciers are classed as a monsoonal temperate type in the eastern Nyainqêntanglha Range, with high monsoon precipitation features, characterized simultaneously by both ablation and accumulation during the summer months (Fujita and Ageta Citation2000; Li et al. Citation2010).
Figure 1. Location map of study region in Tibet (A) and overview of the study area in southeastern Tibet (B)
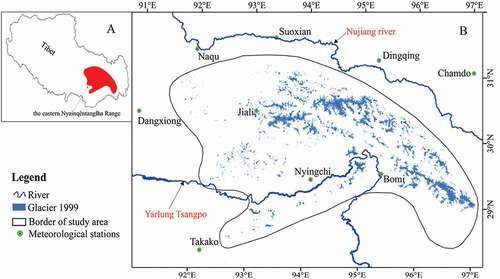
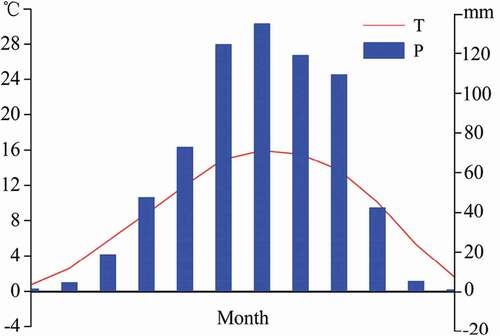
This region marks a transition zone between warm-wet subtropical and cold-dry plateau conditions (Leber, Holawe, and Häusler Citation1995), and is influenced by the intrusion of the Indian summer monsoon via the Brahmaputra Valley in summer and the prevailing westerly winds in winter. In summer, warm, wet monsoonal air masses that cross the area predominantly from the south through the Yarlung Tsangpo valley transport abundant precipitation, with cumulative precipitation of 1,000–3,000 mm, the highest average precipitation rate of the entire Tibetan Plateau (Yang et al. Citation2008). The mean air temperature in the summer is approximately 1–5°C at the equilibrium-line altitude (Shi and Liu Citation2000). At the Nyingchi meteorological station in the central part of the eastern Nyainqêntanglha Range (29°40′N, 94°20′E, 2,991 m a.s.l.; ), more than 70 percent of the annual precipitation occurs from June to September. However, winter circulation patterns are dominated by the westerlies, which convey cold, dry air masses from the Tibetan Plateau (Loibl and Lehmkuhl Citation2015).
Figure 2. Monthly mean temperature and total precipitation in Nyingchi meteorological station during 1970–2011
Data and methods
Satellite data and digital elevation model
To obtain detailed information on glacier extents in the eastern Nyainqêntanglha Range, Landsat TM, ETM+, and OLI scenes () from the U.S. Geological Survey (USGS; http://glovis.usgs.gov/) were used to obtain glacier outlines for three periods, around 1999, 2013, and 2015. We selected images captured during the melting season and additional scenes in similar time periods, because alternatives were used to ensure that the glacier outlines could be delineated properly (). For example, if part of an image was influenced by snow and clouds, we used different images, in which snow and clouds were not distributed at the same location. We also used Landsat 8 scenes to delineate glacier outlines for 2013 and 2015. Landsat 8, launched on February 11, 2013, carried two instruments: the OLI sensor and the Thermal Infrared Sensor (TIRS). It also provided improved signal-to-noise (STN) radiometric performance quantized across a 12-bit dynamic range compared with the 8 bits used by Landsat ETM+. The greater 12-bit quantization permits improved measurement of subtle variability in surface conditions, the performance of which enables better characterization of land-cover states and conditions (Roy et al. Citation2014). In this study, we found that Landsat 8 is a valuable data source to identify glacier margins with up-to-date data that are consistent and comparable with those from earlier Landsat series. Information about glacier distribution characteristics (aspect and elevation data) was obtained with the aid of a medium-resolution digital elevation model, which was derived from the Advanced Thermal Emission and Reflection Radiometer (ASTER) Global Digital Elevation Model (GDEM), with 30 m resolution (http://www.gscloud.cn/).
Table 1. Utilized Landsat scenes
Meteorological data
To analyze possible climatic drivers for glacier variations, we selected nine meteorological stations (Chamdo, Nyingchi, Bomi, Nagqu, Suoxian, Takako, Dingqing, Jiali, and Damxung) at high elevations around the eastern Nyainqêntanglha Range on the Tibetan Plateau with continuous climate-parameter observations from 1970 to 2011 ( and ); the data are available free of charge from the China Meteorological Data Sharing Service System (http://cdc.cma.gov.cn/).
Table 2. Utilized meteorological stations in this study
Method
Glacier identification
Earlier studies on the identification of glacier borderlines used supervised classification, unsupervised classification, the normalized-difference snow index (NDSI), and segmentation of ratio (Aniya et al. Citation1996; Gartton, Howarth, and Marceau Citation1990; Paul Citation2000; Tian, Yang, and Liu Citation2014). Supervised classification uses the maximum-likelihood classification with training samples, and unsupervised classification utilizes the ISODATA clustering. The NDSI is based on the high reflectance of snow in the visible region and its low reflectance in the SWIR region (Kulkarni et al. Citation2002; Paul et al. Citation2002). Compared with these glacier-mapping approaches, segmentation of ratio is considered to be a robust and convenient algorithm to extract glacier borderlines (Andreassen et al. Citation2008; Paul et al. Citation2002). The band ratio method is based on the fact that ice has a high reflection of visible radiation and a strong absorption of shortwave infrared (SWIR) spectrum. We used a semiautomated method to determine glacier outlines. The method involved the following four steps. (1) Calculation of the band ratio: for the Landsat TM and ETM+ imageries, TM3/TM5 was used to retrieve glacier outlines, whereas TM4/TM6 was used for the OLI scenes. (2) Determination of the threshold: a ratio greater than or equal to the threshold could be assigned 1 and identified as a glacier. The thresholds vary by regions. Pan et al. (Citation2012) used 2.3 as a threshold for the western Lenglongling of Qilian Mountain, northeastern Tibetan Plateau. Jiang, Yang, and Tian (Citation2012) selected a threshold of 1.8 to identify glacier from other surface types in the Malan Mountains of Kunlun Ranges, northwestern Tibetan Plateau. After repeated attempts, we adopted a threshold of 2 for the Landsat TM and ETM+ images, whereas a threshold of 1 was used to delineate glacier outlines in the OLI images; thus, glacier could be clearly distinguished from surrounding surface features. (3) Creation of the binary images and conversion of data: we used decision-tree classification to identify glaciers. Ratios greater than or equal to the threshold value could be assigned 1 and identified as a glacier, and ratios less than the threshold value could be assigned 0 to represent any feature other than glaciers. Then, we converted these grid data into vector data, which were assigned the value 1. (4) Visual interpretation: although segmentation of ratio is considered a robust and convenient algorithm to extract glacier extents, it should be verified with visual interpretation to eliminate misclassification (Paul et al. Citation2002). Data assessments conducted under the Global Land Ice Measurements from Space (GLIMS) framework confirmed that visual interpretation remains the best tool for extracting higher-level information from satellite images for glaciers worldwide, especially debris-covered glaciers (Paul, Huggel, and Kääb Citation2004; Raup et al. Citation2007). Finally, we used the method to identify the glacier outlines. For the Landsat TM/ETM+ imageries, we used bands 5, 4, and 3 as red, green, and blue false-color composites to delineate glacier outlines, and bands 6, 5, and 4 to make false-color composites for the Landsat 8 data. We also utilized Google Earth and the GDEM to indirectly identify the debris-covered parts. For example, supraglacial ponds and creeks beginning at the end of the terminus helped to determine the most likely position of those termini (Bolch et al. Citation2010a). Otherwise, we used an automated method to identify debris-covered parts based on the scenes and the GDEM (Song et al. Citation2007), and used Google Earth as a verification tool.
Ridgeline extraction
Ridgelines were extracted automatically using the stream delineation tools of ArcGIS on a hole-filled inverse GDEM, but most of the results were not correct. Therefore, we manually identified ridgelines using Google Earth and imported the data to ArcGIS 10.2. We then used the trace tool to delineate ridgelines in the eastern Nyainqêntanglha Range. Subsequently, the ice-cover shape files generated using segmentation of ratio were cut by ridgelines into individual glaciers.
Error estimation
Seasonal snow, clouds, and debris-covered ice are the major causes of misclassification of areas, and evaluating these errors is essential. There are several methods that can be used to assess misclassified areas: (1) field measurements, (2) multitemporal uncertainty measurements (Hall et al. Citation2003; Silverio and Jaquet Citation2005), and (3) buffer approach (Bolch et al. Citation2010b; Granshaw and Fountain Citation2006). In this article, we utilized the buffer method to estimate uncertainties. Visual interpretation of stable landforms, such as mountain peaks and lateral moraines, in the Landsat images led to a mean horizontal shift of approximately one pixel or less for the TM images (<30 m) and less than half a pixel for the ETM+ scenes (<15 m). The uncertainty of glacier mapping depends on the resolution of the utilized imagery and the conditions at the time of acquisition. Under optimal conditions, accuracy of less than half a pixel can be achieved (Bolch et al. Citation2010a). Finally, a buffer size of 10 m was chosen for each glacier. Our results showed that the uncertainty in mapping glacier area was approximately 3.87 percent in 1999, 4.56 percent in 2013, and 4.70 percent in 2015.
Calculation of glacier area change
To calculate of the change of glacier area in the eastern Nyainqêntanglha Range between 1999 and 2015, we used the annual percentage of area change (APAC) to represent the rate of glacial retreat. The area change can be calculated using the following formula (Tian, Yang, and Liu Citation2014; He et al. Citation2015a):
where i is the order number of studies, ΔSi is the variation of glacier area (km2), Si is the glacier area at the initial status (km2), and ΔTi is the time-span of period i.
Results
The features of regional climate change
Nine meteorological stations, as described earlier, were selected to analyze the trends of regional climate change during the past forty years. We mainly analyzed the mean annual air temperature (MAAT), annual precipitation, and the break point for temperature ( and ). For the temperature and precipitation data, running means of approximately eight years for temperature and precipitation were performed for 1970–2011 ().
Figure 3. (a) changes of annual average temperature, (b) annual mean precipitation in the nine meteorological stations from 1970 to 2011, (c) Mann-Kendall analysis of annual air temperature during 1960–2011
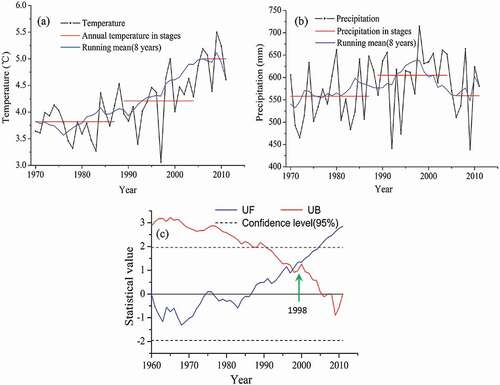
The Mann-Kendall test is a method to detect a time series’ trends and sudden changes (Hirsch, Slack, and Smith Citation1982). For any samples of n variables, χ1, χ2, . . . χn, pi is the accumulative total of samples that χi > χj (1 ≤ j ≤ i), the statistic parameter dk was calculated as follows:
According to the previous assumption, the statistical index (UF) is calculated as follows:
Similarly, the statistical variable (UB) for the reversed time series χ is also calculated by the previous method (Zhao et al. Citation2010). To analyze changes in MAAT based on records of the nine meteorological stations, we also used the Mann-Kendall test. The result revealed that the region experienced significant increase in MAAT during the period 1970–2011, which was particularly apparent after 1998 where the curves of UF and UB intersect. Therefore, the curve for UF showed a tendency of continuous increase (). The increasing trend of MAAT was approximately 0.32°C·(10yr)−1, and MAAT increased by approximately 1.3°C during the past forty years. The changes of temperature are more rapid at higher elevations than at lower elevations (Mountain Research Initiative EDW Working Group Citation2015; You et al. Citation2010). Yao et al. (Citation2012) analyzed the changes of temperature at various altitudes and found that the warming rate increased with the height of the stations, especially in winter. We also further divided the nine meteorological stations into two groups according to the altitude (low, 2,700–4,000 m a.s.l.; high, 4,001–4,510 m a.s.l.). The result showed that the rate of warming is more rapid at higher elevations (0.42°C·(10a) −1) than in lower elevations (0.27°C·(10a)−1) in the eastern Nyainqêntanglha Range, which indicated that the rate of warming was higher in the glaciated areas in our study area. During the past forty years, annual precipitation in the eastern Nyainqêntanglha Range has remained stable, with no evidence of changes. The mean annual precipitation at the nine meteorological stations was 577 mm ().
Characteristics of glacier distribution
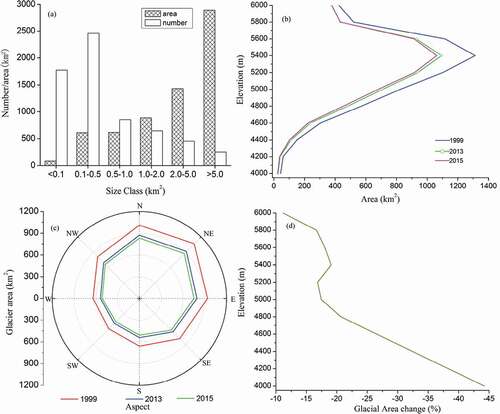
Previous studies indicated that very small glaciers also represented an important source of water in poorly glacierized alpine catchments, and were a key factor in local landscape evolution. An inventory of all ice bodies as small as 0.01 km2 in area, or even smaller, would be required to conduct evaluations with smaller errors (Bahr and Radić Citation2012; Colucci et al. Citation2015; Hughes Citation2008, Citation2010; Pfeffer et al. Citation2014; Serrano, Trueba, and Garcla Citation2011). We divided glaciers based on size: <0.1, 0.1–0.5, 0.5–1.0, 1.0–5.0, and >5.0 km2 (). shows the distribution of glacier coverage in the eastern Nyainqêntanglha Range. The largest number of glaciers fall within the size class 0.1–0.5 km2, and together cover an area of approximately 608.12 km2 (equivalent to 9.3 percent of the original area in 1999), whereas glaciers with areas greater than 5.0 km2 covered the largest total area, approximately 44.4 percent of the total glacier area in 1999. We also calculated the total glaciated area at different altitudes at every 200 m interval. The largest glaciers in the area show a maximum elevation of 5,200–5,400 m a.s.l. in 1990, 2013, and 2015, and the altitude of the glaciers varied from 4,000 m to 6,000 m (). The glaciers were mainly distributed at approximately 4,800–5,800 m with an area of approximately 5,445.04 km2 (84.7%), and the minimum glacier-area scatters were distributed at 4,000 m, covering an area of approximately 43.93 km2 (0.7%) in 1999. shows the distribution of glacier coverage in each aspect. In detail, the glaciers with north and northeast orientations comprised 32 percent of the total area in 1999, and relatively few glaciers faced south and southwest.
Table 3. The glacier area by glacier size classes in the eastern Nyainqêntanglha Range for 1999–2013
Figure 4. (a) The area and number of glaciers per size class in 1999. (b) Glacier area distribution at different elevations. (c) Glacier area coverage by aspect. (d) Glacier area change at different elevations for 1999–2015
Glacier change
The size of the glaciers reduced by 19.76 ± 3.78 percent in the eastern Nyainqêntanglha Range, at a rate of approximately 1.24 %·a−1 between 1999 and 2015, and at an accelerating rate in the second period (2013–2015) compared with the first period (1999–2013; ).
Table 4. The glacier area and change in the eastern Nyainqêntanglha Range
The shrinkage features differed among different size classes from 1999 to 2013 (). The maximum shrinkage occurred in the greater than 5.0 km2 size class, with an area loss of approximately 22.1 percent. The total number of glaciers increased significantly in sixteen years; there were 6,426 glaciers in 1999 and 7,469 glaciers in 2015. However, the number of glaciers belonging to the smallest size class (<0.1 km2) increased by 1,421 from 1999 to 2013, whereas the number of large glaciers decreased.
As shown in , the majority of the glaciers were distributed between 4,800 m and 5,800 m, accounting for 84.7 percent of the total area in 1999. The most prominent glacier shrinkage occurred at 4,000 m and 4,200 m, where decreases of 44.24 percent and 38.30 percent took place in 1999–2015, respectively. The minimum glacier decrease of 11.15 percent was observed at 6,000 m (). Glaciers facing south, southwest, and southeast shrank more rapidly than those facing other directions ().
The changes in absolute and relative area varied with glacier sizes (). The larger glaciers had a large absolute area change (), and the relative shrinkage was small (). This trend gradually became linear with increasing glacier size.
Figure 5. (a) Absolute change in glacier area for 1999–2013 versus initial glacier area. (b) Relative change in glacier area from 1999 to 2013
Discussion
The response of glaciers to climatic change
To evaluate the possible climatic drivers of the glacier variations observed in this study, a thorough analysis of glacier responses to climate change is crucial. There is a time lag in the response of glacier variation to climate change (Pan et al. Citation2012). The time lag primarily depends on glacier type, size, thickness, and so forth (Ma et al. Citation2010; Tian, Yang, and Liu Citation2014; Yao et al. Citation2004), and glacier response time is directly proportional to ice thickness (Jóhannesson, Raymond, and Waddington Citation1989). The empirical format about the relationship between the glacier area and thickness was H = −11.32 + 53.21 A0.3 (where H is mean glacier thickness [m] and A is glacier area [km2]; Kulkarni Citation2006), so thickness is directly proportional to its areal extent (Chaohai and Sharma Citation1988). The lag time is longer for larger glaciers. A previous study compared mountain glacier changes in different regions of the world based on statistical data and found that glacier response lagged behind climate change by approximately twelve to thirteen years (Wang and Zhang Citation1992). McClung and Armstrong (Citation1993) proposed that there was a time period of ten years between the temperate glacier terminus and its mass balance for Blue Glacier in Olympic National Park, Washington. A recent study suggested a probable time lag of approximately five to eight years for the western Lenglongling mountains in the northeastern part of the Tibetan Plateau, with individual areas of less than 1 km2 (Pan et al. Citation2012). Although the glaciers of the eastern Nyainqêntanglha Range are highly sensitive to climate change (Yang et al. Citation2010, Citation2013), most glaciers are relatively large, with individual areas of approximately 1.01 km2. The time lag, which we have assumed to be from eight to ten years in our study area, should be considered. To investigate the possible climatic drivers of glacier variation, we analyzed the mean annual air temperature and annual precipitation from 1989 to 2011, accounting for this time lag. Analyzing change in the mean annual air temperature (MAAT) and a running mean of approximately eight years revealed a remarkable pattern of increase (), especially after 1998, which we determined from nonparametric Mann-Kendall rank statistics (). The rate of temperature increase was 0.59°C (10a) −1 for the study area between 1989 and 2011, which is significantly higher than that for China as a whole (0.22°C (10a) −1; Liu et al. 2009a). Compared with the rising temperature trend, annual precipitation seemed to display a stable pattern during the past forty years. We also analyzed the running mean precipitation for a period of eight years, and the results showed that precipitation increased between 1989 and 1998 and decreased from 1999 to 2011 (). An increase in precipitation favors glacier accumulation, and will result in a decrease in glacier runoff throughout a year. During winter, precipitation falls as snow over the entire glacier surface, which leads to a high albedo in the following melting season. According to Fujita, Ohta, and Ageta (Citation2007), precipitation can effectively decrease glacier runoff in the early melting season (May–June) for the Da and Xiao Dongkemadi Glaciers of the Tibetan Plateau, because glacier runoff in those months is typically less than in the highest melting season (July–August). Thus, high-albedo snow cover can effectively prevent a glacier surface from melting under strong solar radiation (Fujita, Ohta, and Ageta Citation2007).
However, temperature increase results in an increased proportion of liquid precipitation and a decrease in albedo in the glacierized area for glaciers with accumulation, especially for summer-accumulation glaciers. This phenomenon leads to reduced accumulation and accelerated ablation, and results in significant glacier melt (Wang et al. Citation2014). Glaciers have retreated in the eastern Nyainqêntanglha Range between 1999 and 2015. Although precipitation tended to increase from 1989 to 1998, it could not compensate for the mass loss of glacier ice from the melting associated with increasing temperature. In summary, the glacier retreat in the eastern Nyainqêntanglha Range from 1999 to 2015 can be attributed to the considerable increase in air temperature. Liu et al. (Citation2009b) have confirmed that there was an increasing tendency in temperature for the entire Tibetan Plateau based on data from 116 weather stations, and that this warming was more prominent at the higher elevations than at lower elevations. Song, Pei, and Zhou (Citation2012) analyzed the characteristics of the surface air temperature change over the Tibetan Plateau for the past fifty years and found that the surface air temperature increased from a cold period (mid-1960s to early 1980s) to a warm period (mid-1980s to present) with abrupt changes in the 1980s. Zhou et al. (Citation2010) stated that Zhadang Glacier in the Nam Co Basin of Tibet is extremely sensitive to changes in air temperature. Previous studies focusing on the Tibetan Plateau have shown that increasing temperature is the main factor causing glaciers to shrink (Pan et al. Citation2012; Tang, Lv, and He Citation2013; Tian, Yang, and Liu Citation2014; Wang et al. Citation2014; He et al. Citation2015b). Relative to the mean annual air temperature (MAAT) from 1989 to 2005, the MAAT increased by 0.79°C during the period 2006–2011, whereas precipitation decreased by 46 mm, which indicates that the glaciers in this region are likely to continue retreating during the next few years. A previous study suggested that if the temperature change was less than or equal to 0.5°C, precipitation change would play an important role in glacier variations, and that if the temperature change was greater than 0.5°C, glacier variations would mainly depend on the temperature change (Gao, Tang, and Feng Citation2000). Our results revealed that the temperature increased by 0.79°C during the second period (2006–2011) relative to the first period (1989–2005) in the eastern Nyainqêntanglha Range, which indicates that the glaciers will rapidly shrink in the next few years, which is consistent with the results of our research.
Background and previous work
In the past decades, glacier changes have been widely observed on the Tibetan Plateau (Ye et al. Citation2006; Narama et al. Citation2010; Jiang, Yang, and Tian Citation2012; Gardelle et al. Citation2013; Tian, Yang, and Liu Citation2014; He et al. 2015a), and the results have suggested that glaciers have been retreating in recent years. For example, the Qilian Mountain in the northeastern Tibetan Plateau has shown 12 ± 4 percent shrinkage between 2000 and 2010 (Tian, Yang, and Liu Citation2014), Gongga Mountain in the eastern Tibetan Plateau has shown a 4.3 percent decrease from 2001 to 2010 (Li et al. Citation2013), and Yulong Snow Mountain in the southeastern Tibetan Plateau has shown 16.6 percent retreat between 2001 and 2009 (Du Citation2011). Our result showed that glaciers of the Nyainqêntanglha Range had lost 19.76 ± 3.78 percent of their area from 1999 to 2015, with an APAC of 1.24 %·a−1, which indicated a higher rate of shrinkage compared with other studies. Compared with the change of glacier area, the glacier mass balance is the most relevant variable to climate variability (Vincent Citation2002). A recent study estimated glacier mass changes on the Tibetan Plateau using ICESat GLAS data and the Shuttle Radar Topography Mission (SRTM), and the greatest mass loss was identified for the Qilian Mountains, eastern Kunlun Mountains, eastern Nyainqêntanglha Range, Henduan Mountains, and the central and eastern Himalayas; whereas a balanced mass or a slight mass gain was detected for the central Tibetan Plateau (Neckel, Kropáček, and Bolch Citation2014).
Conclusions
This study demonstrated that it is very meaningful to use multitemporal remote-sensing images to analyze glacier area changes for regions where observational data records are not sufficient. Our approach and the availability of Landsat scenes allow for the repeated monitoring of glacier variations without costs in our study. According to the area variations of about 6,426 glaciers in the eastern Nyainqêntanglha Range, it is revealed that the glacier area has been reduced by 19.76 ± 3.78 percent during the period 1999–2015 using different satellite data, with the annual percentage of area change (APAC) approximately 1.24 %·a−1 at an accelerating rate in 2013–2015. The glacier area shrinkage is related to climate change, the attributes of the glacier, and so on. However, the main cause of long-term glacier area variation in the eastern Nyainqêntanglha Range was likely the increase in air temperature, and the glaciers will continue to rapidly shrink in the next several years. With most mountain glaciers shrinking, the long-term observation of some typical glaciers is still necessary in future work.
Acknowledgments
We thank the U.S. Geological Survey (USGS) and the Geospatial Data Cloud for providing access to the orthorectified Landsat imagery and ASTER GDEM, and the China Meteorological Data Sharing Service System for providing the meteorological data.
Additional information
Funding
Related Research Data
References
- Andreassen, L. M., F. Paul, A. Kääb, and E. Hausberg. 2008. Landsat-derived glacier inventory for Jotunheimen, Norway, and deduced glacier changes since the 1930s. The Cryosphere 2 (2):1–12. doi:https://doi.org/10.5194/tc-2-131-2008.
- Aniya, M., H. Sato, R. Naruse, and L. Gino Casassa. 1996. The use of satellite and airborne imagery to inventory outlet glaciers of the Southern Patagonia icefield, South America. Photogramm. Photogrammetric Engineering & Remote Sensing 62 (12):1361–69.
- Bahr, D. B., and V. Radić. 2012. Significant contribution to total mass from very small glaciers. The Cryosphere 6 (4):763–70. doi:https://doi.org/10.5194/tc-6-763-2012.
- Bolch, T., B. Menounos, and R. D. Wheate. 2010b. Landsat-based inventory of glacier in western Canada, 1985–2005. Remote Sensing of Environment 114 (1):127–37. doi:https://doi.org/10.1016/j.rse.2009.08.015.
- Bolch, T., T. D. Yao, S. C. Kang, M. F. Buchroithner, D. Scherer, F. Maussion, E. Huintjes, and C. Schneider. 2010a. A glacier inventory for the western Nyainqêntanglha Range and Nam Co Basin, Tibet, and glacier changes 1976–2009. The Cryosphere 4 (2):419–33. doi:https://doi.org/10.5194/tc-4-419-2010.
- Chaohai, L., and C. K. Sharma. 1988. Report on first expedition to glaciers in the Pumqu (Arun) and Poiqu (BhoteSun Kosi) river basins. Xizang (Tibet), China: Science Press, Beijing China. [In Chinese.]
- Colucci, R. R., E. Forte, C. Boccali, M. Dossi, L. Lanza, M. Pipan, and M. Guglielmin. 2015. Evaluation of internal structure, volume and mass of glacial bodies by integrated LiDAR and ground penetrating radar surveys: The case study of Canin Eastern Glacieret (Julian Alps, Italy). Surveys in Geophysics 36 (2):231–52. doi:https://doi.org/10.1007/s10712-014-9311-1.
- Ding, Y. J., S. Y. Liu, J. Li, and D. H. Shagnguan. 2006. The retreat of glaciers in response to recent climate warming in western China. Annals of Glaciology 43 (1):97–105. doi:https://doi.org/10.3189/172756406781812005.
- Du, J. K. 2011. The research of glacier change in the Yulong Snow Mountain based on RS and observation data. MS thesis, Lanzhou University. [In Chinese.]
- Duan, J., L. Wang, R. Jia, and L. Li. 2009. Progress in glacier variations in China and its sensitivity to climatic change during the past century. Progress in Geography 28 (2):231–37. [In Chinese.]
- Dyurgerov, M. B., and M. F. Meier. 2000. Twentieth century climate change: Evidence from small glaciers. Proceedings of the National Academy of Sciences 97 (4):1406–11. doi:https://doi.org/10.1073/pnas.97.4.1406.
- Fujita, K., and Y. Ageta. 2000. Effect of summer accumulation on glacier mass balance on the Tibetan Plateau revealed by mass-balance model. Journal of Glaciology 46 (153): 244–52. doi: https://doi.org/10.3189/172756500781832945.
- Fujita, K., T. Ohta, and Y. Ageta. 2007. Characteristics and climatic sensitivities of runoff from a cold-type glacier on the Tibetan Plateau. Hydrological Processes 21 (21):2882–91. doi:https://doi.org/10.1002/hyp.6505.
- Gao, X. Q., M. C. Tang, and S. Feng. 2000. Discussion on the relationship between glacier fluctuation and climate change. Plateau Meteorology 19 (1):9–16. [In Chinese.]
- Gardelle, J., E. Berthier, Y. Arnaud, and A. Kääb. 2013. Region-wide glacier mass balance over the Pamir-Karakoram-Himalaya during 1999–2011. The Cryosphere 7 (4):1263–86. doi:https://doi.org/10.5194/tc-7-1263-2013.
- Gartton, D. J., P. J. Howarth, and D. J. Marceau. 1990. Combining DEM parameters with landsat MSS and TM imagery in a GIS for mountain glacier characterization. IEEE Transactions on Geoscience and Remote Sensing 28:766–69. doi:https://doi.org/10.1109/TGRS.1990.573023.
- Granshaw, F. D., and A. G. Fountain. 2006. Glacier change (1958–1998) in the North Cascades National Park Complex, Washington, USA. Journal of Glaciology 52 (177):251–56. doi:https://doi.org/10.3189/172756506781828782.
- Hagg, W., L. N. Braun, M. Kuhn, and T. I. Nesgaard. 2007. Modelling of hydrological response to climate change in glacierized Central Asian catchments. Journal of Hydrology 332 (1–2):40–53. doi:https://doi.org/10.1016/j.jhydrol.2006.06.021.
- Hall, D. K., K. J. Bayr, W. Schöner, R. A. Bindschadler, and J. Y. L. Chien. 2003. Consideration of the errors inherent in mapping historical glacier positions in Austria from the ground and space (1893–2001). Remote Sensing of Environment 86 (4):566–77. doi:https://doi.org/10.1016/S0034-4257(03)00134-2.
- Haq, M. A., K. Jain, and K. P. R. Menon. 2012. Change monitoring of Gangotri Glacier using remote sensing. International Journal of Soft Computing and Engineering 1 (6):259–61.
- He, Y., T. B. Yang, J. Chen, and Q. Ji. 2015a. Remote sensing detection of glacier changes in Dong Tianshan Bogda Region in 1972–2013. Scientia Geographica Sinica 35 (7):925–32. [In Chinese.]
- He, Y., T. B. Yang, Q. Ji, J. Chen, G. Zhao, and W. W. Shao. 2015b. Glacier variation in response to climate change in Chinese Tianshan Mountains from 1989 to 2012. Journal of Mountain Science 12 (5):1189–202. doi:https://doi.org/10.1007/s11629-015-3445-6.
- Hirsch, R. M., J. R. Slack, and R. A. Smith. 1982. Techniques of trend analysis for monthly water quality data. Water Resources Research 18 (1):107–21. doi:https://doi.org/10.1029/WR018i001p00107.
- Hughes, P. D. 2008. Response of a Montenegro glacier to extreme summer heatwaves in 2003 and 2007. Geografiska Annaler: Series A, Physical Geography 90 (4):259–57. doi:https://doi.org/10.1111/j.1468-0459.2008.00344.x.
- Hughes, P. D. 2010. Little ice age glaciers in the Balkans: Low altitude glaciation enabled by cooler temperatures and local topoclimatic controls. Earth Surface Processes and Landforms 35 (2):229–41. doi:https://doi.org/10.1002/esp.1916.
- Immerzeel, W. W., L. P. H. van Beeke, and M. F. P. Bierkens. 2010. Climate change will affect the Asian water towers. Science 328 (5984):1382–85.
- Jacob, T., J. Wahr, W. T. Pfeffer, and S. Swenson. 2012. Recent contributions of glaciers and ice caps to sea level rise. Nature 482 (7386):514–18. doi:https://doi.org/10.1126/science.1183188.
- Ji, Q., T. B. Yang, and X. Li. 2014. Relationship between glacier retreat and climate change in the Eastern Nyainqêntanglha in the past 40 years. Journal of Arid Land Resources and Environment 21 (2):306–10. [In Chinese.]
- Jiang, S., T. B. Yang, and H. Z. Tian. 2012. Glacier shrinkage and its dependence on climate in the Malan Mountain in past 40 years based on RS and GIS. Journal of Glaciology and Geocryology 34 (3):522–29. [In Chinese.]
- Jóhannesson, T., C. Raymond, and E. D. Waddington. 1989. Time-scale for adjustment of glaciers to changes in mass balance. Journal of Glaciology 35 (121):355–69.
- Kääb, A., E. Berthier, C. Nuth, J. Gradelle, and Y. Arnaud. 2012. Contrasting patterns of early twenty-first-century glacier mass change in the Himalayas. Nature 488 (7412):495–98. doi:https://doi.org/10.1038/nature11324.
- Kääb, A., J. M. Reynolds, and W. Haeberli. 2005. Glacier and permafrost hazards in high mountains. In Global change and mountain regions: An overview of current knowledge, ed. U. M. Huber, H. K. M. Bugmann, and M. A. Reasoner, 225–34. Advances in Global Change Research 23. Dordrecht: Kluwer Academic.
- Kulkarni, A. V. 2006. Glacial retreat in Himalaya using Indian remote sensing satellite data: Asia-Pacific remote sensing symposium. International Society for Optics and Photonics 6411:641117–26. doi:https://doi.org/10.1117/12.694004.
- Kulkarni, A. V., J. Srinivasulu, S. S. Manjul, and P. Mathur. 2002. Field based spectral reflectance studies to develop NDSI method for snow cover monitoring. Journal of the Indian Society of Remote Sensing 30 (1–2):73–80.
- Leber, D., F. Holawe, and H. Häusler. 1995. Climatic classification of the Tibet Autonomous Region using multivariate statistical methods. GeoJournal 37 (4):451–72. doi:https://doi.org/10.1007/BF00806934.
- Li, X., T. B. Yang, H. Z. Tian, and Q. Ji. 2013. Response of glacier in Gongga Mountain to climate change during the last 40 years. Research of Soil and Water Conservation 20 (6):125–29. [In Chinese.]
- Li, Z. X., Y. Q. He, T. Pu, W. X. Jia, X. Z. He, H. X. Pang, N. N. Zhang, Q. Liu, S. J. Wang, G. F. Zhu, et al. 2010. Changes of climate, glacier and runoff in China’ s monsoonal glacier region during the last several decades. Quaternary International 218 (1–2):13–28. doi:https://doi.org/10.1016/j.quaint.2009.05.010.
- Liu, B., J. M. Feng, Z. G. Ma, and R. Q. Wei. 2009a. Characteristics of climate changes in Xinjiang from 1960 to 2005. Climatic and Environmental Research 14 (4):414–26. [In Chinese.]
- Liu, X. D., Z. G. Cheng, L. B. Yan, and Z. Y. Yin. 2009b. Elevation dependency of recent and future minimum surface air temperature trends in the Tibetan Plateau and its surroundings. Global and Planetary Change 68 (3):164–74. doi:https://doi.org/10.1016/j.gloplacha.2009.03.017.
- Loibl, D., F. Lehmkuhl, and J. Grießinger. 2014. Reconstructing glacier retreat since the little ice age in SE Tibet by glacier mapping and equilibrium line altitude calculation. Geomorphology 214:22–39. doi:https://doi.org/10.1016/j.geomorph.2014.03.018.
- Loibl, D. M., and F. Lehmkuhl. 2015. Glaciers and equilibrium line altitudes of the eastern Nyainqêntanglha Range, SE Tibet. Journal of Maps 11 (4):575–88. doi:https://doi.org/10.1080/17445647.2014.933451.
- Ma, L. L., L. D. Tian, J. C. Pu, and P. L. Wang. 2010. Recent area and ice volume change of Kangwure Glacier in the middle of Himalaya. Chinese Science Bulletin 55 (18):1766–74. doi:https://doi.org/10.1007/s11434-010-3211-7.
- Masiokas, M. H., R. Villalba, B. H. Luckman, M. E. Lascano, S. Delgado, and P. Stepanek. 2008. 20th-century glacier recession and regional hydroclimatic changes in northwestern Patagonia. Global and Planetary Change 60 (1–2):85–100. doi:https://doi.org/10.1016/j.gloplacha.2006.07.03.
- McClung, D. M., and R. L. Armstrong. 1993. Temperate glacier time response from field data. Journal of Glaciology 39 (132):323–26. doi:https://doi.org/10.1017/S0022143000015987.
- Meier, M. F., M. B. Dyurgerov, U. K. Rick, S. O’Neel, W. Tad Pfeffer, R. S. Anderson, S. P. Anderson, and A. F. Glazovsky. 2007. Glaciers dominate eustatic sea-levels rise in the 21st century. Science 317 (5841):1064–67. doi:https://doi.org/10.1126/science.1143906.
- Mountain Research Initiative EDW Working Group. 2015. Elevation-dependent warming in mountain regions of the world. Nature Climate Change 5:424–30. doi:https://doi.org/10.1038/NCLIMATE2563.
- Narama, C., A. Kääb, M. Duishonakunov, and K. Abdrakhmatov. 2010. Spatial variability of recent glacier area changes in the Tien Shan Mountains, Central Asia, using Corona (~1970), Landsat (~2000), and ALOS (~2007) satellite data. Global and Planetary Change 71 (1–2):42–54. doi:https://doi.org/10.1016/j.gloplacha.2009.08.002.
- Neckel, N., J. Kropáček, and T. Bolch. 2014. Glacier mass changes on the Tibetan Plateau 2003–2009 derived from ICESat laser altimetry measurements. Environmental Research Letters 9 (1):014009. doi:https://doi.org/10.1088/1748-9326/9/1/014009.
- Oerlemans, J. 2005. Extracting a climate signal from 169 glacier records. Science 308 (5722):675–77. doi:https://doi.org/10.1126/science.1107046.
- Pan, B. T., B. Cao, J. Wang, G. L. Zhang, C. Zhang, Z. B. Hu, and B. Huang. 2012. Glacier variations in response to climate change from 1972 to 2007 in the western Lenglongling mountains, northeastern Tibetan Plateau. Journal of Glaciology 58 (211):879–88. doi:https://doi.org/10.3189/2012JoG12J032.
- Paul, F. 2000. Evaluation of different methods for glacier mapping using landsat TM. Proceedings, EARSeL-SIG Workshop 1 (1):239–45.
- Paul, F., C. Huggel, and A. Kääb. 2004. Combining satellite multispectral image data and a digital elevation model for mapping debris-covered glaciers. Remote Sensing of Environment 89 (4):510–18. doi:https://doi.org/10.1016/j.rse.2003.11.007.
- Paul, F., A. Kääb, M. Maisch, T. Kellenberger, and W. Haeberli. 2002. The new remote-sensing-derived Swiss glacier inventory: I. Methods. Annals of Glaciology 34 (1):355–61. doi:https://doi.org/10.3189/172756402781817941.
- Pfeffer, W. T., A. A. Arendt, A. Bliss, and T. Bolch. 2014. The Randolph Glacier Inventory: A globally complete inventory of glaciers. Journal of Glaciology 60 (221):537–52. doi:https://doi.org/10.3189/2014JoG13J176.
- Raup, B., A. Kääb, J. S. Kargel, M. P. Bishop, G. Hamilton, E. Lee, F. Rau, D. Soltesz, S. J. S. Khalsa, M. Beedle, et al. 2007. Remote sensing and GIS technology in the Global Land Ice Measurements from Space (GLIMS) Project. Computers & Geosciences 33 (1):104–25. doi:https://doi.org/10.1016/j.cageo.2006.05.015.
- Ren, B. H. 1988. Existing glacier fluctuation and its relation to the climatical changes in China. Journal of Glaciology and Geocryology 10 (3):244–49.
- Roy, D. P., M. A. Wulder, T. R. Loveland, C. E. Woodcock, R. G. Allen, M. C. Anderson, D. Helder, J. R. Irons, D. M. Johnson, R. Kennedy, et al. 2014. Landsat-8: Science and product vision for terrestrial global change research. Remote Sensing of Environment 145:154–72. doi:https://doi.org/10.1016/j.rse.2014.02.001.
- Serrano, E., J. J. G. Trueba, and M. G. Garcla. 2011. Ice patch origin, evolution and dynamics in a temperate high mountain environment: The Jou Negro, Picos de Europa (NW Spain). Geografiska Annaler: Series A, Physical Geography 93 (2):57–70. doi:https://doi.org/10.1111/j.1468-0459.2011.00006.x.
- Shi, Y. F., and S. Y. Liu. 2000. Estimation on the response of glaciers in China to the global warming in the 21st century. Chinese Science Bulletin 45 (7):668–72. doi:https://doi.org/10.1007/BF02886048.
- Silverio, W., and J. M. Jaquet. 2005. Glacial cover mapping (1987–1996) of the Cordillera Blanca (Peru) using satellite imagery. Remote Sensing of Environment 95 (3):342–50. doi:https://doi.org/10.1016/j.rse.2004.12.012.
- Song, B., Y. Q. He, H. X. Pang, A. G. Lu, J. D. Zhao, B. Y. Ning, L. L. Yuan, and Z. L. Zhang. 2007. Identifying automatically the Debris-covered glaciers in China’s monsoonal temperate-glacier regions based on remote sensing and GIS. Journal of Glaciology and Geocryology 29 (3):456–62. [In Chinese.]
- Song, C., T. Pei, and C. H. Zhou. 2012. Research progresses of surface temperature characteristic change over Tibetan Plateau since 1960. Progress in Geography 31 (11):1503–9. (in Chinese).
- Tang, X. L., X. Lv, and Y. He. 2013. Features of climate change and their effects on glacier snow melting in Xinjiang, China. Comptes Rendus Geoscience 345 (2):93–100. doi:https://doi.org/10.1016/j.crte.2013.01.005.
- Tian, H. Z., T. B. Yang, and Q. P. Liu. 2014. Climate change and glacier area shrinkage in the Qilian mountains, China, from 1956 to 2010. Annals of Glaciology 55 (66):187–97. doi:https://doi.org/10.3189/2014AoG66A045.
- Vincent, C. 2002. Influence of climate change over the 20th century on four French glacier mass balances. Journal of Geophysical Research: Atmospheres 107 (D19):1–12. doi:https://doi.org/10.1029/2001JD000832.
- Wang, L., Z. Q. Li, F. T. Wang, H. L. Li, and P. Y. Wang. 2014. Glacier changes from 1964 to 2004 in the Jinghe River basin, Tien Shan. Cold Regions Science and Technology 102:78–83. doi:https://doi.org/10.1016/j.coldregions.2014.02.006.
- Wang, N. L., and X. S. Zhang. 1992. Mountain glacier fluctuations and climatic change during the last 100 years. Journal of Glaciology and Geocryology 14 (3):242–50. [In Chinese.]
- Wang, X., F. Siegert, A. G. Zhou, and J. Franke. 2013. Glacier and glacial lake changes and their relationship in the context of climate change, Central Tibetan Plateau 1972–2010. Global and Planetary Change 111:246–57. doi:https://doi.org/10.1016/j.gloplacha.2013.09.011.
- Yang, B., A. Bräuning, Z. B. Dong, Z. Y. Zhang, and K. Q. Jiao. 2008. Late Holocene monsoonal temperate glacier fluctuations on the Tibetan Plateau. Global and Planetary Change 60 (1–2):126–40. doi:https://doi.org/10.1016/j.gloplacha.2006.07.035.
- Yang, W., X. F. Guo, T. D. Yao, and H. Zhou. 2011. Summertime surface energy budget and ablation modeling in the ablation zone of a maritime Tibetan glacier. Journal of Geophysical Research: Atmospheres 116:D14116. doi:https://doi.org/10.1029/2010JD015183.
- Yang, W., T. D. Yao, X. F. Guo, and M. Zhu. 2013. Mass balance of a maritime glacier on the southeast Tibetan Plateau and its climatic sensitivity. Journal of Geophysical Research: Atmospheres 118 (17):9579–94. doi:https://doi.org/10.1002/jgrd.50760.
- Yang, W., T. D. Yao, B. Q. Xu, and Z. Hang. 2010. Influence of supraglacial debris on summer ablation and mass balance in the 24K Glacier, southeast Tibetan Plateau. Geografiska Annaler: Series A, Physical Geography 92 (3):353–60. doi:https://doi.org/10.2307/40931000.
- Yao, T. D., L. Thompson, W. Yang, W. S. Yu, Y. Gao, X. J. Guo, X. X. Yang, K. Q. Duan, H. B. Zhao, B. Q. Xu, et al. 2012. Different glacier status with atmospheric circulations in Tibetan Plateau and surrounding. Nature Climate Change 2 (9):663–67. doi:https://doi.org/10.1038/NCLIMATE1580.
- Yao, T. D., Y. Q. Wang, S. Y. Liu, J. C. Pu, Y. P. Shen, and A. X. Lu. 2004. Recent glacial retreat in high Asia in China and its impact on water resource in Northwest China. Science in China Series D: Earth Sciences 47 (12):1065–75. doi:https://doi.org/10.1360/03yd0256.
- Ye, Q. H., S. C. Kang, F. Chen, and J. H. Wang. 2006. Monitoring glacier variations on Geladandong mountan, central Tibetan Plateau, from 1969 to 2002 using remote-sensing and GIS technologies. Journal of Glaciology 52 (179):537–45. doi:https://doi.org/10.3189/172756506781828359.
- You, Q. L., S. C. Kang, N. Pepin, W. A. Flügel, Y. P. Yan, H. Behrawan, and J. Huang. 2010. Relationship between temperature trend magnitude, elevation and mean temperature in Tibetan Plateau from homogenized surface stations and reanalysis data. Global and Planetary Change 71 (1–2):124–33. doi:https://doi.org/10.1016/j.gloplacha.2010.01.020.
- Zhao, G., G. Hörmann, N. Fohrer, Z. Zhang, and J. Zhai. 2010. Streamflow trends and climate variability impacts in Poyang Lake Basin, China. Water Resources Management 24 (4):689–706. doi:https://doi.org/10.1007/s11269-009-9465-7.
- Zhou, S. Q., S. C. Kang, T. G. Gao, and G. S. Zhang. 2010. Response of Zhadang Glacier runoff in Nam Co Basin, Tibet, to changes in air temperature and precipitation form. Chinese Science Bulletin 55 (20):2103–10. doi:https://doi.org/10.1007/s11434-010-3290-5.