
 ?Mathematical formulae have been encoded as MathML and are displayed in this HTML version using MathJax in order to improve their display. Uncheck the box to turn MathJax off. This feature requires Javascript. Click on a formula to zoom.
ABSTRACT
To advance understanding of the distribution, climatic relationships, and status of American pikas (Ochotona princeps) in the Great Basin, United States, we compiled 2,387 records of extant pika sites surveyed since 2005, 89 records of documented extirpated sites (resurvey of historic sites), and 774 records of sites with old sign only. Extant sites extended across five degrees latitude and ten degrees longitude, encompassed six subregions, traversed forty mountain ranges, spanned 2,378 m in elevation (1,631–4,009 m), and comprised three of five currently described pika subspecies. A climate envelope for extant sites using the PRISM climate model expands the range of temperature and precipitation values that have been previously described. Extirpated and old-sign sites were mostly found within the geographic and climatic space of extant sites, but often in warmer and drier portions. Considerable overlap of extirpated, old, and extant groups within the same climate space suggests that nonclimatic factors have also contributed to population losses. The broad distribution and enlarged climate envelope of extant pika sites indicate that despite some localized extirpations, pika populations are persisting across Great Basin mountains, and appear to be able to tolerate a broader set of habitat conditions than previously understood.
Introduction
American pikas (Ochotona princeps) have been widely reported as vulnerable to contemporary climate change (Appendix 1). These small lagomorphs, distributed across montane regions of western North America, thermoregulate poorly, have high resting and low lethal body temperatures, do not hibernate, and show minimal physiological resilience to temperature extremes and chronic stress (Smith and Weston Citation1990). Pikas are behaviorally solitary and patchily distributed in disjunct talus fields, which under even the best of conditions support low population numbers. Dependence on talus patches, coupled with the potential for local metapopulation dynamics (Smith and Gilpin Citation1997; Smith and Nagy Citation2015), have been considered additional risk factors for pikas under accelerating climate change.
Trends of extirpation during prehistoric times provide temporal context for modern population vulnerabilities. Prehistoric records of pikas in the Great Basin (GB) portion of the range document millennial scale population losses correlated with Late Pleistocene and Holocene warming (Grayson Citation2005). Rising modern temperatures prompt a similar concern for climatic impacts, with an expectation that pika populations will retreat to higher elevations for suitable habitat, eventually running out of space.
Scientific evidence in support of this scenario, however, is inconsistent. In the GB, resurveys of historic sites document a steep extirpation curve in recent decades at low elevations and other marginal sites where temperature is typically warmest (Beever et al. Citation2011, Citation2016; Stewart et al. Citation2015). In addition, extirpation at some northwestern GB sites has been assumed when only old sign was found during single-visit surveys (Jeffress, Van Gunst, and Millar Citation2017). In other time-series studies of this region, however, population status does not correlate consistently with temperature or elevation (Millar et al. Citation2014a; Smith and Nagy Citation2015; Stewart and Wright Citation2012). Surveys in parts of the western GB (Massing Citation2012; Millar and Westfall Citation2010; Millar, Westfall, and Delany Citation2013; Stewart et al. Citation2015) documented the locally widespread presence of pikas, including sites at low and climatically marginal GB sites, which suggest thermal tolerance (Beever et al. Citation2008; Collins and Bauman Citation2012; Jeffress, Van Gunst, and Millar Citation2017; Millar, Westfall, and Delany Citation2013; Smith, Nagy, and Millar Citation2016).
Differing methods used for data collection and analyses may contribute to the inconsistency of the earlier findings. Because the primary objective of many pika studies in the GB was to resurvey twentieth-century historic sites, study locations were limited by their availability and distribution, and documented historic sites do not necessarily represent the range of occupied sites. In addition, studies based on surveys of modern (nonhistoric) sites have focused on limited portions of the GB pika range. Finally, some monitoring efforts used rapid-assessment surveys, which have an increased likelihood for introducing error in population status compared with traditional methods that are more time consuming (Smith, Nagy, and Millar Citation2016). Taken together, a widely held assumption in scientific and public understanding is that pikas have become rare (especially in the GB), pikas are limited to a few high and cool elevations, a significant portion of GB pika sites have become extirpated, and that the species is at risk of extinction. In many ways, the American pika has become an icon of climate-change vulnerability (see Appendix 1).
Because these perceptions of American pika vulnerability are based on a small number of sites and in limited portions of the GB, we sought to systematically document the range of known pika occurrence locations across the GB. To provide temporal, geographic, and climatic context for evaluating the conditions and potential vulnerability of GB pikas, we compiled known published and unpublished surveys of modern occupied sites, documented extirpated sites, and old-sign-only sites across the hydrographic GB. We interrogated the resulting databases to answer the following questions and to provide a more comprehensive understanding of the status of pikas in the GB:
What is the geographic distribution of extant pika populations in the GB?
What are the prevailing climatic conditions at extant and relict pika locations?
Do the geographic and climatic values for the extant sites differ from those of twentieth- and twenty-first-century extirpation sites and sites with only old sign?
How do the new data on the geographic and climatic limits of extant pika populations across the GB affect and/or change our understanding of the status and vulnerability of pikas in the GB relative to climate?
Methods
The study covered the hydrographic Great Basin, United States, where all surface waters drain to interior basins. We derived the perimeter and interior watershed boundaries from the National Hydrography Dataset (Levels 2, 3, and 4 HUC; USGS, The National Map, accessed March 11, 2016). This range includes parts of California, Oregon, Nevada, and Utah ().
Figure 1. The hydrographic Great Basin. (A) Great Basin perimeter and subwatershed boundaries with six subregions (bold lines) used to assess extant American pika sites (black dots). More than one observation record is included in most dots at this scale. (B) Mountain ranges mentioned in the text where extant pika sites occur (not all ranges are shown). Codes for mountain ranges: Northwest subregion: GL, Glass Mountains; HM, Hart Mountains; HC, Hayes Canyon Range; HR, High Rock; MU, Madeline Uplands; MM, Mosquito Mountains; PP, Painted Point Range; SP, Sheldon Plateau; SM, Steens Mountains; WM, Warner Mountains. Southwest subregion: BM, Bodie Mountains; CR, Carson Range; GM, Glass Mountains; IC, Inyo Craters; MC, Mono Craters; NR, New Range; PN, Pine Nut Mountains; SN, Sierra Nevada; SW, Sweetwater Mountains; WA, Wassuk Mountains; WH, White Mountains; ZM, Zunnamed Mountains. North Central subregion: EH, East Humboldt Range; RM, Ruby Mountains. South Central subregion: DR, Desatoya Range; MR, Monitor Range; SM, Shoshone Mountains; TR, Toiyabe Range; TQ, Toquima Range. Northeast subregion: BR, Bear River Mountains; UM, Uinta Mountains; WR, Wasatch Range. Southeast subregion: FL, Fish Lake Plateau; MP, Markagunt Plateau; SP, Sevier Plateau; TM, Tushar Mountains; WP, Wasatch Plateau
Extant pika sites
From published literature and unpublished inventories, we compiled records of extant (i.e., occupied) locations for American pika populations within the GB. We included a few records that were outside the hydrographic GB but less than 5 km from the boundary; these were in areas where the GB boundary was topographically indistinct and records were otherwise sparse or absent. These records represent a mix of survey methods based on the source of the data (see Appendix 2 for protocols). For previously unpublished records, we only included those where expert surveyors had conducted the surveys. Given recently reported population declines, we accepted only sites that were documented as extant in 2005 or later (most recent, spring 2017). We felt that this threshold was necessary to accept a record as current. While recognizing that this was a qualitative decision, we based it on published records (Beever et al. Citation2011), wherein repeat observations showed losses during time periods greater than about a decade. Our choice of 2005 was further based on published analyses (Stewart et al. Citation2015) that considered records older than 2000 (approximately fifteen years prior to analysis) as “historic.” We defined a talus as “extant” when one or more of several commonly used criteria for the presence of pikas was noted: sightings, vocalizations, fresh pellets (in combination with other signs), and current-year haypiles (winter caches of vegetation). Unpublished inventories included records of sites observed by one of the authors or provided by state Natural Heritage or wildlife offices. We did not include records from a paper published late in our manuscript revision period (Stewart, Wright, and Heckman Citation2017). Extant locations reported in that paper are, however, already represented by records in our database. Given the methods of observation, and recognizing the population ecology and behavior of the species (Smith and Nagy Citation2015), we assume that most if not all of the extant sites we compiled to represent self-sustaining local populations.
Definitions of individual sites varied among the studies, and included detections a few meters apart (e.g., Nevada Department of Wildlife), occurrence sites ≥50 m apart (e.g., Millar and Westfall Citation2010), and areas within a 1–3 km radius (e.g., Beever et al. Citation2016). We screened for redundancy and removed duplicate records. Remaining records were compiled into a single database with associated geographic information (mountain range, location, latitude, longitude, elevation, aspect). In a few cases, coordinates listed in original publications were in error by a degree or more; these we corrected and noted in Appendices 3–5. Aspects for extant records, if not documented in the original database, were estimated by intersecting locations with 30 m tiles in geographic information systems (GIS; ESRI Citation2015). Two methods for quantifying aspect were used: aspect degrees transformed to cosine, and aspect degrees binned into one of eight 45° ordinal categories (N, NE, E, SE, etc.). When elevation data were not given in published or unpublished records, they were estimated from 30 m digital elevation models (DEM) in GIS. We included elevation and aspect because these have been used as proxies for climate in other pika studies. Other environmental factors—such as geomorphic setting; talus substrate, size, and connectivity; or vegetation characteristics—while relevant, could not be included because of heterogeneity of methods used in previous studies and, thus, our inability to quantify these variables.
To avoid overrepresentation from closely adjacent observations, we established in GIS a 50 m buffer around the location of each record. This distance was used as a conservative haypile nearest-neighbor distance, representing an individual animal territory (Smith and Weston Citation1990). Records that overlapped 50 m buffers were combined into “50 m buffer clusters,” which in some cases resulted in larger polygons (as in Jeffress, Van Gunst, and Millar Citation2017).
Extirpated and old pika sites
We also compiled records of sites that were documented as extirpated or contained only old sign. For this we used published literature and unpublished inventories where observations or publications dated from 2005 or later. For the extirpated dataset we included only records for which a resurvey had been conducted, the repeat surveys were conducted at five or more years apart, and both the most recent and the penultimate surveys indicated no sign of pika occurrence.
We compiled a third dataset from published and unpublished sources dated from 2005 or later. This included records in which surveyors reported only old pika sign at a site, based either on single-visit surveys or on resurveys that did not meet the previous criteria. “Old” pika sign (i.e., older than the current year) was characterized by small, decomposing pellets, decomposing haypiles, and/or old urine stains, coupled with no observation of live animals. We treated redundancies, calculated 50 m buffer clusters, and estimated elevation and aspect for extirpated sites and old pika sites in the same way as for sites in the extant group. We refer to extirpated and old sites collectively as “relict sites.”
Geographic and climatic data analysis
To better understand the role of geography and climate in pika occurrence across the GB, we compared these variables for extant and relict pika sites. Analyses were nested by geographic scale. The broadest level was the hydrographic GB. Based on GB geography and bioclimatic zonation, we partitioned pika sites into six subregions within the GB (). These are described as: (1) Southwest (SW) = Sierra Nevada, White Mountains, and adjacent minor ranges; (2) Northwest (NW) = northeast California, northwest Nevada, and south-central Oregon; (3) North Central (NC) = northeast Nevada; (4) South Central (SC) = central Nevada; (5) Northeast (NE) = northern Utah (Uinta Mountains, Wasatch Range, Bear River Mountains); and (6) Southeast (SE) = southern Utah. For analyses within subregions, we assessed differences in pika populations among mountain ranges. Elevation spans within ranges are reported as indicators of habitat breadth used locally by pikas.
To assess differences among slope aspects within and between the three groups (extant, extirpated, and old), we applied a nominal logistic two-level hierarchical analysis of variance (ANOVA), assessing differences among subregions and among mountain ranges within subregions (JMP 12.2; SAS Institute Citation2015). The units of analysis for elevation and aspect were the 30 m DEM tiles. Differences in elevation among subregions and mountain ranges were tested in a two-level nested ANOVA, with ranges in subregions as a random effect. We evaluated climate relationships for the three datasets using the 800 m (30 arc-sec) PRISM climate model (Daly, Neilson, and Phillips Citation1994). Units of analyses for climate were the 800 m PRISM tiles. Although surface-air temperatures, as modeled by PRISM, do not represent microclimatic conditions encountered among habitat components of American pikas, some of which appear decoupled from surface air (Millar, Westfall, and Delany Citation2016), talus surface temperatures do correlate with surface-air temperatures as measured by PRISM. We used PRISM values to characterize the overall environmental contexts of pika sites at local to subregional to GB scales, and to compare with the local climatic conditions described in other pika studies, without intending to imply that these represent the specific conditions encountered by pikas. We selected climate variables that others have used (Beever et al. Citation2010, Citation2011; Millar and Westfall Citation2010; Wilkening et al. Citation2011) to discriminate between extant and extirpated pika sites, and from those determined variables that best predicted pika population status in our datasets (see the list of variables in ). We excluded winter precipitation as a variable, because in the GB it is highly correlated with annual precipitation.
Table 1. Distribution of American pika sites in the hydrographic Great Basin
Table 2. Mountain ranges within Great Basin subregions that contain extant pika sites
Table 3. Percent occurrence of slope aspects of pika sites by subregion
Table 4. Correlations among climate variables and vectors (CV 1–3) from discriminant analyses. Correlations overall (across subregions) and for individual subregions (among ranges within subregions), with percent of total variation explained by the canonical vectors and overall canonical correlations. CV3 values are not shown for the SC and SE subregions because their contributions were minor
Summary statistics were compiled for the GB and for each subregion. We assessed correlations between elevation and climate by computing elevation means for digital elevation model tiles, then computed climate and elevation means for PRISM tiles. Climate differences in extant locations among subregions and ranges in individual subregions were assessed by discriminant (canonical) analysis. Differences in climate between extant and relict locations and among subregions were tested with a two-factor multivariate analysis of variance (MANOVA), including two-way interactions. Correlations, discriminant analysis, nested ANOVA and MANOVA, and tests of significance (F statistics, t tests) were performed in JMP (JMP 12.2; SAS Institute Citation2015). Distributions for the ANOVA and MANOVA analyses showed values close to normality; for the discriminant analysis, after excluding a few (~6) outliers, residuals for the first canonical vector were not significantly different from normality.
Results
Distribution and climate relationships of extant sites
We compiled 2,387 individual pika records from published and unpublished sources ( and ; Appendix 3). Combining closely adjacent records yielded 1,320 50 m buffer clusters. Pika records were distributed across forty mountain ranges, including the large Sheldon Plateau, Nevada, which contains many poorly distinguished mountain groups (). All six subregions were represented, with the smallest number of records in the SE (63) and the largest in the NW (958). Elevations of extant sites across the entire GB ranged from 1,631 m to 4,009 m (a span of 2,378 m; = 2,569 m). Mean elevation in the NW subregion (2,039 m) was significantly lower (p < 0.001) than in the remaining five subregions (
= 2,990 m), which did not differ significantly from one another. Elevation spans were greatest in the SW subregion and least in the SC. The subset of extant records that derived from published historic resurveys had a mean elevation of 2,584 m and range of 1,872–3,368 m ().
Although extant pika sites were found on all aspects, there was a slight excess of northerly aspects (). The ANOVA yielded significant (p < 0.0001) differences in aspect among subregions and among ranges within subregions; differences among subregions and ranges in subregions were significant (p > 0.001), although the chi-square for ranges was much larger than that for subregions. North aspects had the largest percentage of extant sites, particularly in the central subregions, followed by northeast and northwest aspects. Southerly and eastward aspects had the lowest representation. These patterns were relatively consistent across subregions, with exceptions for the southwesterly aspects, where the NE and SE subregions had more than twice the percentage of extant sites than other subregions.
Extant pika sites intersected with 782 PRISM climate tiles. Discriminant analysis of the extant sites identified the six subregions as distinct groups (). The first three canonical vectors described 93 percent of the variation (v1, 66%; v2, 19%; v3, 8%), with canonical correlations (goodness of fit) of 0.99, 0.97, and 0.92 for v1, v2, and v3, respectively (). Canonical scores of vector 1 were highly correlated with summer precipitation (sum of July, August, and September values) and winter maximum temperature (Tmax; sum of December, January, and February values) among subregions, and moderately to weakly correlated with winter and summer minimum temperature (Tmin). Vector 2 was highly correlated with summer Tmax and annual and September Tmin among subregions, and moderately correlated with annual Tmax and winter and summer Tmin. Vector 3 was moderately correlated with July dewpoint temperature, a measure of humidity, among subregions. Ranges in subregions had considerable heterogeneity in the strengths of correlations, especially in the importance of summer precipitation, and in winter and summer Tmax.
Figure 2. Discriminant analysis of American pika locations in the hydrographic Great Basin. Dots are PRISM tiles containing pika sites; overlapping sites are contained in many of the single dots. Extant sites are shown by subregion and in color: Northeast = green; Southeast = pink; North Central = blue; South Central = brown; Northwest = red; Southwest = purple. Larger ellipsoids indicate 50 percent concentration of the subregional points; smaller (inner) ellipsoids indicate 95 percent confidence intervals of the subregional means. Extirpated sites are shown as crosses; old sites are shown as black dots. For extirpated sites, all those that lie within the area of ellipsoids derive from that subregion; for sites that lie outside the ellipsoid, the color of the crosses indicates the subregion to which they belong
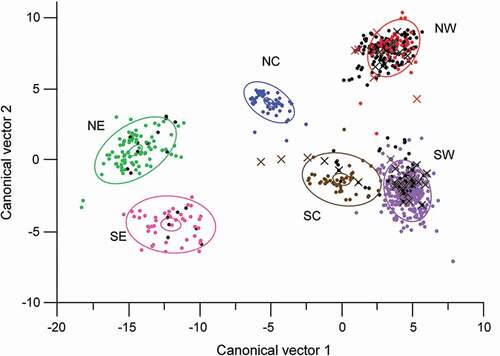
Scatter plots of PRISM tile values from records across the entire GB provide estimates of the outer limits of climate values for locations where pika sites occurred, as well as the distribution of values within the climate envelope (, ). As canonical vector correlations with climate (, ) indicate, the NW and SW subregions had the warmest winters and the lowest summer precipitation, while the NE and SE subregions had the coolest winters, highest summer Tmin, and the highest summer precipitation. Most of the high summer precipitation sites (extant and old) in derive from the eastern subregions, and these high values distinguish Utah sites from the rest of the GB. The SC subregion was most related to the SW subregion in climate, differentiated by the SC subregion having cooler winters, warmer summers, and greater summer precipitation. The NC subregion was intermediate among the subregions in many climate variables. Northern subregions tended to have warmer summer Tmax and warmer annual, winter, and summer Tmins (compare and CV2 in ). These patterns were reflected in the subregional mean values for the PRISM climate data (), which also underscored the range of July humidities (dewpoint temperature), which were lowest in the central subregions (NC, SC) and highest in the northern subregions (NE, NW).
Table 5. Summary of subregional mean climatic data from PRISM climate model (1981–2010 normals, Daly, Neilson, and Phillips Citation1994). For overall means and range of values, boldface is annual, light shading is summer, and dark shading is winter
Figure 3. Scatter plots showing range of mean climate values for extant (grey dots), extirpated (black crosses), and old (black dots) Great Basin sites, as represented by PRISM tiles that include the sites. (A) Annual precipitation versus summer precipitation. (B) Summer minimum temperature versus summer maximum temperature. (C) Winter minimum temperature versus winter maximum temperature
Elevation and climate variables at extant sites were predictably correlated; that is, precipitation variables were positively correlated with elevation, and temperature variables were negatively correlated with elevation (). Correlations were mostly high and relatively similar across subregions. Sites in the SC region had more high correlations (r > 0.90) than other subregions, notably in annual, winter, and summer Tmin. The few low correlations in absolute value were annual precipitation and September precipitation in the SW, NC, and NE subregions; winter and September Tmin in the NW subregion; July precipitation in the SE subregion; and July dewpoint temperature in the NC subregion.
Table 6. Correlations of elevation with climate variables in Great Basin subregions. Climate values derive from the PRISM climate model (1981–2010 normals; Daly, Neilson, and Phillips Citation1994)
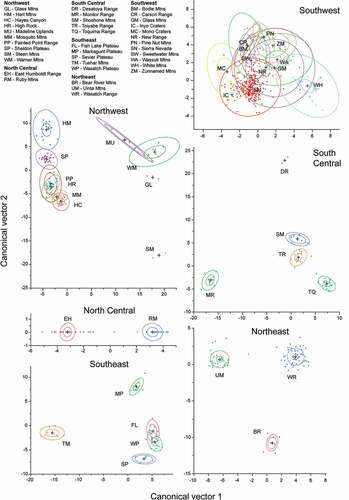
Discriminant analysis within the six subregions revealed strong climate differentiation among mountain ranges in all but the SW subregion, where there was considerable overlap among ranges (). Canonical correlations were high for the first two vectors in all subregions and the first two vectors accounted for 68–100 percent of the variation (). Summer precipitation was highly differentiated among ranges in subregions except the NC. Summer Tmax was most highly correlated in the NC, SC, NE, and SE, but not in the SW or NW; summer Tmin was most highly correlated in the SW, NE, SC, and SE subregions, but not in the NW or NC. July dewpoint temperature added relatively high discrimination among ranges for all subregions except for the SW and NC.
Figure 4. Discriminant analysis of extant American pika locations by mountain ranges within six subregions of the hydrographic Great Basin. Dots are pika sites as represented by PRISM tiles; many tiles overlap. Larger ellipsoids indicate 50 percent concentration of the points; smaller (inner) ellipsoids indicate 95 percent confidence intervals of the means; plus symbols indicate the center of concentrations
Distribution and climate relationships of extirpated and old sites
To compare conditions of extant sites with relict locations, we compiled 89 individual pika records within the GB that were documented via resurveys of historic sites (based on the previous criteria) as extirpated and 774 records of old-sign-only sites (). These classes created 232 unique 50 m buffer clusters (i.e., that did not contain extant records). The remaining seventy buffer clusters contained extant records and records from one or both of the relict classes. Extirpated sites were distributed across eighteen mountain ranges in three subregions (; Appendix 4). The smallest number of records was in the SC (6) and the largest was in the SW (57), with the NW intermediate (26). Elevations of extirpated sites ranged from 1,615 m to 3,106 m (a span of 1,491 m; = 2,420 m). Mean elevation in the NW subregion (1,929 m) was lower than in the remaining two subregions (
= 2,635 m), which were statistically nonsignificant differences (p > 0.5). The subset of extirpated records from published historic resurveys had a mean elevation of 2,196 m and range of 1,615–2,753 m. Aspects of extirpated pika sites were more northerly than extant sites ().
Table 7. Mountain ranges within Great Basin subregions that contain extirpated pika sites
Old sites were distributed across thirty-one mountain ranges in five subregions (; Appendix 5). Most records were in the NW subregion (661), far fewer were in the SW (76), and only small numbers were located in the SC, NE, and SE subregions (16, 11, and 10, respectively). Elevations for the old records ranged from 1,628 to 3,435 m (a span of 1,807 m; = 2,054 m). Mean elevation in the NW subregion (1,966 m) was lower than in the remaining four subregions. Of those, mean elevations in the SW, SC, and NE subregions did not differ significantly; mean elevation in the SE subregion (
= 3,099 m) was significantly higher than the other five (p < 0.001). Aspects of old pika sites were distributed in all octants with slight excess in the north, whereas south- and westward aspects were least represented (). Subregions showed significant heterogeneity (p < 0.001) in aspect. All octants were well represented in the NW and SW subregions, while the south and west octants were either lacking or of minor importance in the other three subregions.
Table 8. Mountain ranges within Great Basin subregions that contain old pika sites
By appending PRISM-derived climate data for relict sites to the extant-site dataset, we computed canonical scores for locations of the extirpated and old-sign sets and used discriminant analysis to compare these scores to the climate space for extant sites. The resulting analysis showed that the relict sites and extant sites lie largely within the same climate space, with some exceptions (, ). In the MANOVA, the order of differences was subregions (p < 0.001) > mountain range > pika status (extant, extirpated, old). Mean values for the extirpated and old-sign sites compared to the extant sites highlight the differences between these groups (). Overall, mean annual precipitation for the relict sites was lower than for the extant set. Comparing by subregions, however, the NW subregion had higher mean annual precipitation in the extirpated than in the extant sites, while old-sign site means were similar to those of extant sites. Considering summer precipitation, the extirpated and old sites had lower values than extant sites in the SW, SC, and SE subregions, but not in the NW and NE subregions, despite those two subregions being the driest and wettest of the six subregions.
Patterns of climate differences between relict and extant sites were complex, varied by subregion, and could not distinguish among the categories of occurrence. Annual temperature, Tmin and Tmax, and summer Tmax were higher for relict sites compared with extant sites in the SW and SC subregions, but not in the NW, NE, or SE subregions. Winter Tmins and Tmaxs were comparable between extirpated, old, and extant sites. In the SC and NE subregions, higher summer Tmins occurred at extirpated or old sites compared to extant sites, while in the NW and SW subregions, extant sites were warmer than either extirpated or old-sign sites (but never both), and there were no differences for the SE subregion among the three datasets.
Correlations between elevation and climate variables at relict sites in the NW and SW subregions were generally lower and had fewer significant values (r < |0.6|) than at extant sites, although they followed similar patterns to the extant group (). There were also differences in correlations between the sets of extirpated versus old-sign sites, especially in summer and winter Tmin: for the extirpated group, correlations were low and nonsignificant, and some were even positive, suggesting that Tmin may increase with elevation; for example, as a result of cold-air drainage effects. Annual, summer, and winter Tmin correlations with elevation, by contrast, for the old sites in the SC, NE, and SE subregions were all negative, and most were high and significant (p < 0.05). In summary, no obvious pattern emerged to distinguish extirpated and old-sign sites from extant sites; if anything, the low correlations between climate variables and elevation suggest great landscape complexity associated with these categories of occurrence.
Mountain ranges with no pika evidence
The island-like geography of mountain ranges in the GB, coupled with the large number of ranges, present biogeographic challenges for species dispersal (Brown Citation1971), resulting in both deterministic (climate, distance, source populations) and stochastically derived distributions for many GB mammal species. We compiled a list of mountain ranges that appear to have characteristic pika habitat and suitable bioclimatic zones, but where experienced surveyors have found no evidence of pika habitation, current or historic (). The list of 45 mountain ranges includes only areas where pikas have never been found in any part of the range. Surveys have not been comprehensive, however, and we encourage continued exploration of these and other mountain ranges with features capable of supporting pikas.
Table 9. Great Basin mountain ranges where evidence for pika presence has not been detected during twentieth- and twenty-first-century surveys. High point elevations from D.A. Charlet (unpublished, Atlas of Nevada Mountains)
Discussion
Extant pika populations in the Great Basin and comparison with relict locations
The primary focus of our study was to clarify the current distribution of extant pika populations in the hydrographic GB and to describe climatic conditions for this distribution of locations. Additionally, we compared conditions found at extant pika sites with those at relict sites to improve our understanding of environmental factors that may have been responsible for population declines. To the extent that our sites represent still-extant populations, we found that pikas are far more widely distributed across the GB than previously reported or assumed, and confirm prior observations (e.g., Jeffress et al. Citation2013; Ray, Beever, and Rodhouse Citation2016; Stewart and Wright Citation2012) that climate may represent only one of many factors influencing their current and recent distribution.
The broad GB distribution of extant pika populations extends across five degrees of latitude and ten degrees of longitude, represents three ecosystem provinces (Bailey Citation1980), encompasses six subregions of the GB, traverses forty mountain ranges, spans 2,378 m elevation, and comprises three of the five currently described subspecies (O. p. princeps, O. p. schisticeps, and O. p. uinta; Hafner and Smith Citation2010). The minimum elevation of extant populations (1,631 m) is approximately 900 m below the low range given for the southern portion of the species’ distribution (Smith and Weston Citation1990); approximately 200 m lower than the minimum elevations from prior distribution studies of extant central and western GB sites (Millar and Westfall Citation2010; Millar, Westfall, and Delany Citation2013); and slightly below the minimum elevation of extant sites in a study of pikas of the northern GB (1,648 m; Collins and Bauman Citation2012). Our samples also extend the reported maximum elevation of extant GB sites by 122 m, from 3,887 m (Millar and Westfall Citation2010) to 4,009 m.
Extant sites are distributed across all aspects, with a slight excess of north-facing slopes. This broad representation was surprising. Given the thermal sensitivity of pikas, we expected cooler, north-facing aspects to be more strongly represented, especially in relatively warm environments. Apparently adequate physical environments exist across the GB on many aspects and with sufficient local microclimatic conditions to support pika populations. Perhaps equally unexpected is the large proportion of relict sites that occurred on cool, northern aspects.
How does the distribution of previously published historic resurvey sites (e.g., Beever, Brussard, and Berger Citation2003; Beever et al. Citation2011, Citation2016; Stewart et al. Citation2015; Wilkening et al. Citation2011) compare to our newly compiled set? Resurvey sites were neither chosen nor intended to represent the distribution of pikas in the GB, and the set of historic sites is slightly biased toward lower elevations and a narrower distribution of sites than in our study. Our data include fifteen more mountain ranges than are included in the historic resurveys, and significantly extend the elevational range of occupied pika sites to 1.5 times greater than historic resurvey sites (including extensions into higher montane elevations). Overall, the mean elevation of the resurvey sites was 119 m lower than the mean for our compiled extant set. Historic resurvey sites might represent lower elevations as a result of limited access during historic periods, when travel into high and remote mountain areas was more restricted than at present. Whatever the reason, interpretations from resurvey studies are best understood in the context of their relative environments, which do not necessarily represent those of pikas across the GB.
The broad geographic distribution of pika sites across the GB also demonstrates a larger range of climate values for locations of extant pika sites than previously reported. Our basin-wide perspective highlights wide subregional climate differences among pika locations. Differences in mean annual precipitation among subregions, for instance, were greater than 760 mm, from a low in the NW subregion to a high in the NE subregion. Mean summer precipitation varied greatly across the GB. Pika sites in the NW and SW subregions have arid summers (~7% of annual precipitation), while sites in the NE and SE subregions experience proportionately more precipitation in summer (~20% of annual). Temperature ranges also exhibited strong variation among subregions, with more than 6°C difference in mean maximum summer temperature among the extremes (NW and SW subregions). These ranges of values underscore the breadth of climatic environments that extant pika sites represent in the GB.
Multivariate climate analyses within subregions further revealed that extant pika site locations are climatically more heterogeneous than previously thought. Climatic distinctions among mountain ranges were large, even among adjacent ranges, within all subregions except the SW. The complex climatic overlap of mountain ranges in that subregion was unexpected, given the rain-shadow effect of the Sierra Nevada and cumulative effects eastward that would be assumed to accentuate differentiation. Low sample numbers in some ranges, however, likely lowered our ability to accurately discriminate distinctions.
A climate envelope for extant GB pika sites, if such can be considered from the range of average and extreme values of extant sites derived from PRISM (, ), could be described as follows: annual precipitation, 259–1,787 mm; summer precipitation, 7–83 mm; annual Tmin, −9.1–1.1°C; summer Tmin, −0.1–10.5°C; winter Tmin, −17.1–4.9°C; annual Tmax, 2.7–16.6°C; summer Tmax, 11.4–29.9°C; winter Tmax, −5.2–6.7°C; and July dewpoint temperatures, −6.3–4.2°C. These values generally conform with estimates from other studies that used PRISM or similar climate models, with notable exceptions. Annual precipitation in the GB fell mostly within the species-wide requirement of more than 300 mm (Hafner Citation1994). Several sites, however, had less precipitation, as was also found in the wide-ranging study of Jeffress et al. (Citation2013; low range = 231 mm, Craters of the Moon National Monument, ID). The GB sites had slightly higher maximum values of annual precipitation than previously reported—for example, 1,407 mm in the southern Rocky Mountains (Erb, Ray, and Guralnick Citation2011)—but considerably less than the 3,084 mm estimated in the survey by Jeffress et al. (Citation2013). This result is unsurprising given the semiaridity of the GB region relative to other pika environments of the West.
Temperatures for extant GB sites were mostly within the range of, or warmer than, temperatures reported for pika sites outside the GB. Our July maximum temperatures (13.3–30.6°C) closely match those of Jeffress et al. (Citation2013; 13.5–29.8°C), while our December minimum temperatures (−16.8°C to −4.8°C) were warmer (−19.3°C to –4.1°C). Summer mean temperatures in the GB were similar to the means and ranges of Jeffress et al. (Citation2013). They had wider ranges and thus lower mean values than low-elevation, high-latitude sites in British Columbia (Henry, Henry, and Russello Citation2012), and much lower temperatures and wider ranges of temperature (but with similar warm extremes), as reported at the well-studied, low-elevation Bodie site in California (Smith and Nagy Citation2015). Notably, summer maximum temperatures in the GB were warmer than reported elsewhere, with an upper mean value of 28.2°C; 5–6°C warmer than those reported by Smith and Nagy (Citation2015) for the Bodie site. Compared to mean annual temperatures for a subset of pika sites in the western GB (1.5–6.9°C; Millar and Westfall Citation2010), the current basin-wide set had a broader range of values (−2.4–8.5°C).
The newly compiled list of relict sites reveals a large number of extirpated and putatively extirpated (old) sites. Several caveats need to be mentioned: first is the unverified status of many of the records scored by surveyors as old. Often these sites were intermingled with and within the dispersal distance of extant sites; potentially some of these sites are transiently vacant patches that might be recolonized. In other situations, rapid surveys might have missed signs of occurrence (i.e., false absence), as has been noted before (Jeffress, Van Gunst, and Millar Citation2017; Millar, Westfall, and Delany Citation2013; Smith, Nagy, and Millar Citation2016). Further, we have found that detection was consistently much lower at lower elevation and/or marginal habitat, even where pikas were present and abundant, making the rapid-survey issue even more problematic (Smith, Nagy, and Millar Citation2016). Finally, old sign has only recently been recorded as a survey variable, and there were differences in survey effort by subregions. Those factors likely contribute to variability in the numbers of sites reported as old and bias our summary analyses.
Importantly, most of the old-site records are the result of single-survey visits without repeat surveys, such as have been conducted by Beever and colleagues (Citation2011, Citation2016) and Stewart and colleagues (Stewart et al. Citation2015; Stewart and Wright Citation2012); thus, extirpation cannot be accurately documented. For instance, on repeat visits to several putatively extirpated sites in the western GB, we have documented subsequent occurrence (Millar, Westfall, and Delany Citation2013). We urge more widespread use of repeat surveys and long-term monitoring for old sites as well as extant sites in the future, as well as studies to assess site-specific survival and reproduction. Additionally, radiocarbon dating methods can be used to clarify the age of old sites (e.g., Millar et al. Citation2014a; Stewart, Wright, and Heckman Citation2017).
Our findings suggest that although local climate appears to have a role in defining extirpated locations, it does not adequately explain the current state. Relict sites tend to be in lower, warmer, and drier parts of the climate envelope of extant GB pika location, as prior studies have shown (Beever, Brussard, and Berger Citation2003; Beever et al. Citation2010; Stewart et al. Citation2015; Wilkening et al. Citation2011). Our climate profiles for relict sites were mostly within the envelope of the extant sites, and although there are sets of climate variables that distinguish them, there is considerable overlap between the extant and relict climate spaces. Similar results have been found in northwest Nevada (Jeffress, Van Gunst, and Millar Citation2017). Further, in some cases extant sites were warmer, drier, or occurred at lower elevations than extirpated sites, even in the same subregion or mountain range. Local differences among microsites; microclimatic processes; quality of forage; size, quality and connectivity of taluses; and dispersal, among other factors, may emerge as important predictive factors as well (Castillo et al. Citation2016; Stewart and Wright Citation2012). Untangling these influences from regional climatic constraints is a key area for future research.
Climate analyses in the current study relied on PRISM data, which are modeled as standard surface-air temperature (1.5 m above ground surface; Daly, Neilson, and Phillips Citation1994). Millar, Westfall, and Delany (Citation2014b, Citation2016) documented that although surface-air temperatures correlate with talus surface temperatures, they correlate poorly with the thermal conditions within talus and should not be used to represent the conditions that pikas routinely encounter within talus. With our climate analyses and discussion, we do not mean to imply that these values are those encountered by pikas in all habitat components. Rather, our analyses of surface-air temperatures allow comparison with prior studies that used similar modeled climate values, and afford clarification of the range of local-to-regional temperatures and environments associated with pika locations. Where extreme high values would seem to be unfavorable given the thermal physiology of pikas (as in sites with warm summers or cold, dry winters), we suspect that thermal conditions are mitigated by microclimates associated with talus landforms. Rocky landforms have thermal regimes shown to be decoupled from surface air, which results in cooler temperatures with low variance during warm summer days and warmer temperatures under snow in cold winters (Hall et al. Citation2016; Millar, Westfall, and Delany Citation2014b, Citation2016; Otto, Wilson, and Beever Citation2015; Rodhouse, Hovland, and Jeffress Citation2017; Smith, Nagy, and Millar Citation2016; Wilkening, Ray, and Varner Citation2015). These landforms also support vegetation in their forefields on which pikas depend for summer forage and winter caching (Millar et al. Citation2015). In this way, talus environments can provide refuge from unfavorable daily and seasonal weather (Rodhouse, Hovland, and Jeffress Citation2017), and, over longer times, internal temperatures lag changes in free air (Gentili et al. Citation2015; Millar, Westfall, and Delany Citation2014b), providing potential climate refugia into the future (Morelli et al. Citation2016).
Implications for the status of pikas in the Great Basin
The addition of a large number of extant pika sites, spanning the northern three-quarters of the GB, changes our understanding both of the current status of pikas and their susceptibility to risk from a changing climate. Prior efforts to assess the vulnerability of pikas to climate have relied on projections from models (e.g., Calkins et al. Citation2012; Galbreath, Hafner, and Zamudio Citation2009; Stewart et al. Citation2015), statistical analyses of extirpated versus extant conditions, or assessments of populations along bioclimatic gradients (e.g., Beever et al. Citation2010, Citation2011; Erb, Ray, and Guralnick Citation2011; Jeffress et al. Citation2013). Models suffer compound uncertainties (Stephenson, Millar, and Cole Citation2010) that are especially significant for a small mammal such as the pika. These include general uncertainties, as in estimating future greenhouse gas emissions, regional downscaling processes, and ecological interactions, as well as difficulties in scaling because of the highly restricted and decoupled habitat components used by pikas (Millar, Westfall, and Delany Citation2016). In some studies, only a small number of sites was available from which broad implications were projected. Combined, these can create cumulative errors with misleading end results. For instance, MaxEnt models that attempted to map current distributions of pikas generated distributions far from where pikas have been known to exist (e.g., Calkins et al. Citation2012). Statistical models increasingly include factors that pertain to specific ecological requirements of pikas, although much remains unknown, such as the conditions and constraints of the dispersal environment, the importance of talus area and quality, and inter-talus isolation distance. Conclusions from such studies, including those we make here, increasingly highlight the role of dependence on context, as has been described previously for pikas (Jeffress et al. Citation2013; Jeffress, Van Gunst, and Millar Citation2017).
Our description of a wide geographic distribution, encompassing a broad climate envelope within and across subregions, adds new dimensions to understanding the tolerances of pikas in the ecoregion. The results underscore that pikas are not rare in the GB, and, given the geographic breadth of locations, are likely better able to tolerate climate variability than previously understood. In addition, the diversity of environments suggests lower exposure to the impacts of climate change than previously reported. Although pikas are commonly described as an alpine (the zone above tree line) species, we now understand that this characterization is incomplete. Prior studies of low-elevation and marginal pika sites, as well as our current survey, demonstrate that pikas are found in the GB in environments not described as alpine (Beever et al. Citation2008; Jeffress, Van Gunst, and Millar Citation2017; Millar and Westfall Citation2010; Millar, Westfall, and Delany Citation2013; Smith Citation1974; Smith, Nagy, and Millar Citation2016). Nonalpine sites outside the region also have been documented (e.g., Henry, Henry, and Russello Citation2012; Jeffress et al. Citation2013; Manning and Hagar Citation2011; Ray, Beever, and Rodhouse Citation2016; Shinderman Citation2015; Simpson Citation2009). Pikas in the GB are better described as wide-ranging across montane zones, albeit highly dependent on specific landforms that lie within the species’ climate envelope. Occupied sites extend from sage-steppe shrublands and woodland communities, through montane forests, wet and dry montane meadows and shrublands, and subalpine forest zones, to diverse alpine communities.
Recognizing the wide range of pikas in the GB neither denies extirpation rates that have been documented nor ignores the possibility of continuing declines. In fact, our analyses document a large number and widespread occurrences of apparently recent population extirpations across the GB, which anticipate further changes in the range of environments supportive of American pikas. There is a need for further exploration at intensive scales in many portions of currently little surveyed parts of the GB to provide more consistent assessment of the regional distribution of the species. Even with the current levels of survey, however, the broad range of pikas, and the capacity of the species to persist across diverse bioclimatic environments and through significant Holocene climate variations (Hafner Citation1993; Hafner and Sullivan Citation1995), suggest that a core of stable populations exists across the GB. At the margins of these core areas, on interior as well as exterior edges (Ray, Beever, and Rodhouse Citation2016; Stewart, Wright, and Heckman Citation2017), population fluxes have occurred in the past, are occurring at present, and are expected to occur in the future. While these fluctuations may not portend bioregional extirpation of the species or losses of populations from subregions or major mountain ranges, they do point to the need for greater exploration of nonclimate factors, as well as continuing research on the relationship of climate to pika persistence. Finally, it must be stressed that the Great Basin composes only a small portion of the species-wide distribution of pikas, is a region where pikas are least represented, and is where the species has faced prehistoric climate challenges (Grayson Citation2005). Our findings of the wide distribution and persistence of pikas even in this marginal ecoregion suggest that at the species level, pikas may have greater resilience to environmental change than has been assumed.
Supplementary Materials
Download Zip (249.3 KB)Acknowledgments
We thank Don Grayson (University of Washington) and Chrissy Howell (U.S. Forest Service) for critical reviews of the draft manuscript, Harriet Smith for editorial review, and Rob Klinger (USGS) and one anonymous reviewer for constructive comments on the submitted manuscript. We thank Jessica Castillo Vardaro (Princeton University) for sharing details on her pika records, and all surveyors and agencies who contributed pika observations to our databases, particularly Brad Bauman, Mark Enders, Christy Klinger, and Rory Lamp (all NDOW); Brian Maxfield, Anthony Wright, Keith Day, Adam Brewerton, and Theresa Pope (all UDWR); and Eric Rickart (Natural History Museum of Utah).
Supplemental data
Supplemental data for this article can be accessed here.
References
- Bailey, R. G. 1980. Ecoregions of the United States. Miscellaneous Publication No. 1391. Washington, DC: USDA Forest Service.
- Beever, E. A., P. F. Brussard, and J. Berger. 2003. Patterns of apparent extirpation among isolated populations of pikas (Ochotona princeps) in the Great Basin. Journal of Mammalogy 84:1–19.
- Beever, E. A., J. D. Perrine, T. Rickman, M. Flores, J. P. Clark, C. Waters, S. S. Weber, B. Yardley, D. Thoma, T. Chesley-Preston, et al. 2016. Pika (Ochotona princeps) losses from two isolated regions reflect temperature and water balance, but reflect habitat area in a mainland region. Journal of Mammalogy 97:1495–511.
- Beever, E. A., C. Ray, P. W. Mote, and J. L. Wilkening. 2010. Testing alternative models of climate-mediated extirpations. Ecological Applications 20:164–78.
- Beever, E. A., C. Ray, J. L. Wilkening, P. F. Brussard, and P. W. Mote. 2011. Contemporary climate change alters the pace and drivers of extinction. Global Change Biology 17:2054–70.
- Beever, E. A., J. L. Wilkening, D. E. McIvor, S. S. Weber, and P. F. Brussard. 2008. American pikas (Ochotona princeps) in northwestern Nevada: A newly discovered population at a low-elevation site. Western North American Naturalist 68:8–14.
- Brown, J. H. 1971. Mammals on mountaintops: Nonequilibrium insular biogeography. The American Naturalist 105:467–78.
- Calkins, M. T., E. A. Beever, K. G. Boykin, J. K. Frey, and M. C. Anderson. 2012. Not-so-splendid isolation: Modeling climate-mediated range collapse of a montane mammal Ochotona princeps across numerous ecoregions. Ecography 35:780–91.
- Castillo, J. A., C. W. Clinton, M. R. Jeffress, C. Ray, T. J. Rodhouse, and D. Schwalm. 2016. Replicated landscape genetic and network analyses reveal wide variation in functional connectivity for American pikas. Ecological Applications 26:1660–76.
- Collins, G. H., and B. T. Bauman. 2012. Distribution of low-elevation American pika populations in the northern Great Basin. Journal of Fish and Wildlife Management 3:311–18.
- Daly, C. R., R. P. Neilson, and D. L. Phillips. 1994. A statistical-topographic model for mapping climatological precipitation over mountainous terrain. Journal of Applied Meteorology 33:140–58.
- Erb, L. P., C. Ray, and R. Guralnick. 2011. On the generality of a climate-mediated shift in the distribution of the American pika (Ochotona princeps). Ecology 92:1730–35.
- ESRI. 2015. ArcGIS 10.3.1 for Desktop. Redlands, CA: Environmental Systems Research Institute.
- Galbreath, K. E., D. J. Hafner, and K. R. Zamudio. 2009. When cold is better: Climate-driven elevation shifts yield complex patterns of diversification and demography in an alpine specialist (American pika, Ochotona princeps). Evolution 63:2848–63.
- Gentili, R., C. Baroni, M. Caccianiga, S. Srmiraglio, A. Ghiani, and S. Citerios. 2015. Potential warm-stage microrefugia for alpine plants: Feedback between geomorphological and biological processes. Ecological Complexity 21:87–99.
- Grayson, D. 2005. A brief history of Great Basin pikas. Journal of Biogeography 32:2103–11.
- Hafner, D. J. 1993. North American pika (Ochotona princeps) as a late Quaternary biogeographic indicator species. Quaternary Research 39:373–80.
- Hafner, D. J. 1994. Pikas and permafrost: Post-Wisconsin historical zoogeography of Ochotona in the southern Rocky Mountains, USA. Arctic and Alpine Research 26:375–82.
- Hafner, D. J., and A. T. Smith. 2010. Revision of the subspecies of American pika, Ochotona princeps (Lagomorpha: Ochotonidae). Journal of Mammalogy 91:401–17.
- Hafner, D. J., and R. M. Sullivan. 1995. Historical and ecological biogeography of Nearctic pikas (Lagomorpha: Ochotonidae). Journal of Mammalogy 76:302–21.
- Hall, L. E., A. D. Chalfoun, E. A. Beever, and A. E. Loosen. 2016. Microrefuges and the occurrence of thermal specialists: Implications for wildlife persistence amidst changing temperatures. Climate Change Responses 3:8.
- Henry, P., A. Henry, and M. A. Russello. 2012. Variation in habitat characteristics of American pikas along an elevation gradient at their northern margin. Northwest Science 86:346–50.
- Jeffress, M. R., T. J. Rodhouse, C. Ray, S. Wolff, and C. W. Epps. 2013. The idiosyncrasies of place: Geographic variation in the climate-distribution relationships of the American pika. Ecological Applications 23:864–78.
- Jeffress, M. R., K. J. Van Gunst, and C. I. Millar. 2017. A surprising discovery of American pika sites in the northwest Great Basin. Western North American Naturalist 77:252–68.
- Manning, T., and J. C. Hagar. 2011. Use of nonalpine anthropogenic habitats by American pikas (Ochotona princeps) in western Oregon. Western North American Naturalist 71:106–12.
- Massing, C. P., 2012: American pika (Ochotona princeps): Persistence and activity patterns in a changing climate. M.S. thesis, Department of Biological Sciences, California Polytechnic University, San Luis Obispo, California.
- Millar, C. I., K. Heckman, C. Swanston, K. Schmidt, R. D. Westfall, and D. L. Delany. 2014a. Radiocarbon dating of American pika fecal pellets provides insights into population extirpations and climate refugia. Ecological Applications 24:1748–68.
- Millar, C. I., and R. D. Westfall. 2010. Distribution and climatic relationships of the American pika (Ochotona princeps) in the Sierra Nevada and western Great Basin, U.S.A.: Periglacial landforms as refugia in warming climates. Arctic, Antarctic, and Alpine Research 42:76–88.
- Millar, C. I., R. D. Westfall, and D. L. Delany. 2013. New records of marginal locations for American pika (Ochotona princeps) in the western Great Basin. Western North American Naturalist 73:457–76.
- Millar, C. I., R. D. Westfall, and D. L. Delany. 2014b. Thermal regimes and snowpack relations of periglacial talus slopes, Sierra Nevada, California, USA. Arctic, Antarctic, and Alpine Research 46:191–212.
- Millar, C. I., R. D. Westfall, and D. L. Delany. 2016. Thermal components of American pika habitat: How does a small lagomorph encounter climate? Arctic, Antarctic, and Alpine Research 48:327–43.
- Millar, C. I., R. D. Westfall, A. Evenden, J. G. Holmquist, J. Schmidt-Gengenbach, R. S. Franklin, J. Nachlinger, and D. L. Delany. 2015. Potential climatic refugia in semi-arid, temperate mountains: Plant and arthropod assemblages associated with rock glaciers, talus slopes, and their forefield wetlands, Sierra Nevada, California, USA. Quaternary International 387:106–21.
- Morelli, T. L., C. Daly, S. A. Dobrowski, D. M. Dulen, J. L. Ebersole, S. T. Jackson, J. D. Lundquist, C. I. Millar, S. P. Maher, W. B. Monahan, et al. 2016. Managing climate change refugia for climate adaptation. PLoS One 8:e0159909.
- Otto, H. W., J. A. Wilson, and E. A. Beever. 2015. Facing a changing world: Thermal physiology of American pikas (Ochotona princeps). Western North American Naturalist 75:429–45.
- Ray, C., E. A. Beever, and T. J. Rodhouse. 2016. Distribution of a climate-sensitive species at an interior range margin. Ecosphere 7:e01379.
- Rodhouse, T. J., M. Hovland, and M. R. Jeffress. 2017. Variation in subsurface thermal characteristics of microrefuges used by range core and peripheral populations of the American pika (Ochotona princeps). Ecology and Evolution 7:1514–26.
- SAS Institute. 2015. JMP® 12.2. Cary, NC: SAS Institute Inc.
- Shinderman, M. 2015. American pika in a low-elevation lava landscape: Expanding the known distribution of a temperature-sensitive species. Ecology and Evolution 5:3666–76.
- Simpson, W. G. 2009. American pikas inhabit low-elevation sites outside the species’ previously described bioclimatic envelope. Western North American Naturalist 69:243–50.
- Smith, A. T. 1974. The distribution and dispersal of pikas: Influences of behavior and climate. Ecology 55:1368–76.
- Smith, A. T., and M. E. Gilpin. 1997. Spatially correlated dynamics in a pika metapopulation. In Metapopulation dynamics: Ecology, genetics and evolution, ed. I. A. Hanski and M. E. Gilpin, 407–28. San Diego, CA: Academic Press.
- Smith, A. T., and J. D. Nagy. 2015. Population resilience in an American pika (Ochotona princeps) metapopulation. Journal of Mammalogy 96:394–404.
- Smith, A. T., J. D. Nagy, and C. I. Millar. 2016. Behavioral ecology of American pikas (Ochotona princeps) at Mono Craters, California: Living on the edge. Western North American Naturalist 76:459–84.
- Smith, A. T., and M. L. Weston. 1990. Ochotona princeps. Mammalian Species 352:1–8.
- Stephenson, N. L., C. I. Millar, and D. N. Cole. 2010. Shifting environmental foundations: The unprecedented and unpredictable future. In Beyond naturalness: Rethinking park and wilderness stewardship in an era of rapid change, ed. D. N. Cole and L. Yung, 50–66. Washington, DC: Island Press.
- Stewart, J. A. E., J. D. Perrine, L. B. Nichols, J. H. Thorne, C. I. Millar, K. E. Goehring, C. P. Massing, D. H. Wright, and B. Riddle. 2015. Revisiting the past to foretell the future: Summer temperature and habitat area predict pika extirpations in California. Journal of Biogeography 42:880–90.
- Stewart, J. A. E., and D. H. Wright. 2012. Assessing persistence of the American pika at historic localities in California’s northern Sierra Nevada. Wildlife Society Bulletin 36:759–64.
- Stewart, J. A. E., D. H. Wright, and K. A. Heckman. 2017. Apparent climate-mediated loss and fragmentation of core habitat of the American pika in the Northern Sierra Nevada, California, USA. PLoS ONE 12:e0181834.
- Wilkening, J. L., C. Ray, E. A. Beever, and P. F. Brussard. 2011. Modeling contemporary range retraction in Great Basin pikas (Ochotona princeps) using data on microclimate and microhabitat. Quaternary International 235:77–88.
- Wilkening, J. L., C. Ray, and J. Varner. 2015. Relating sub-surface ice features to physiological stress in a climate sensitive mammal, the American pika (Ochotona princeps). PloS ONE 10:e0119327.