
 ?Mathematical formulae have been encoded as MathML and are displayed in this HTML version using MathJax in order to improve their display. Uncheck the box to turn MathJax off. This feature requires Javascript. Click on a formula to zoom.
ABSTRACT
Since 2003, concentrations of dissolved organic carbon (DOC) in lakes in the Kangerlussuaq region declined by 14–55 percent, with these decreasing DOC concentrations potentially altering lake ecology and reflecting changes in regional carbon (C) cycling. To evaluate possible mechanisms responsible for this shift, we performed experiments to test the effects of dust addition, bacterial activity, or photodegradation on DOC concentration and two DOC quality metrics: the specific ultraviolet absorbance (SUVA254) and the chromophoric DOC spectral slope coefficient (S275–295). Lake-water DOC concentrations did not decline in any treatments, but there were changes in DOC quality. Dust addition increased SUVA254 and decreased the magnitude of S275–295 in one lake, the impacts of bacterial activity were variable, and sunlight exposure elicited a decline in SUVA254 and an increase in the magnitude of S275–295 in all lakes. These results suggest that DOC pools in the study lakes are photoreactive, even though the lakes are characterized by long residence times, but that declining DOC concentration did not result from this mechanism. While the tested mechanisms did not explain the decline in DOC concentration observed in recent years, they did yield new information about how dust, bacterial activity, or light can influence DOC quality in the lakes of the Kangerlussuaq region.
Introduction
Shifting trends in lake-water dissolved organic carbon (DOC) may signal broader climate-mediated biogeochemical changes within lake catchments (Williamson et al. Citation2009). Because DOC in surface water originates from both terrestrial and aquatic sources, it can reflect changes in within-lake processes as well as broader environmental and atmospheric conditions. With climate warming and accelerated permafrost thaw, DOC has been predicted to either increase (Frey and Smith Citation2005) or decrease (Striegl et al. Citation2005) in aquatic surface waters of the Arctic. Because DOC is a primary regulator of lake ecosystem function (Williamson et al. Citation1999), it is important to identify the drivers behind substantial changes in lake-water DOC concentration and quality.
In freshwater lakes of the Kangerlussuaq area, Anderson and Stedmon (Citation2007) collected DOC concentration data from 2001 to 2003, and Saros et al. (Citation2015) compared these earlier results to DOC data from twelve of the same lakes from 2011 to 2014. In this period of about a decade, DOC concentration substantially declined by 14–55 percent (1–24 mg C L−1) in eleven of the lakes. The mechanism(s) leading to this decline in DOC, however, remains unclear. Possible mechanisms leading to DOC decline may include flocculation with iron (Fe) in dust and subsequent precipitation from surface waters (Maloney et al. Citation2005), bacterial degradation (Guillemette and Del Giorgio Citation2011), or photodegradation from light exposure (Cory et al. Citation2014). The lack of understanding about the drivers of the downward DOC trend must be resolved to better quantify the role of lakes in Arctic terrestrial carbon (C) budgets as climate warming progresses in this region.
Autochthonous and allochthonous sources contribute to the DOC pool of lakes. Phytoplankton and macrophytes generate DOC during growth and senescence, and terrestrial DOC produced in the catchment can be transported across the landscape and into lake basins. In this study, we used controlled experiments to better understand the mechanisms responsible for losses of DOC in lakes.
One possible mechanism behind declining lake-water DOC concentrations is the climate-driven change in dust production that may be occurring in Kangerlussuaq, as in other parts of the world. Between the periods of 1979–2000 and 2007–2012, surface-air temperatures in Greenland increased by almost 3°C (Mayewski et al. Citation2014). This rapid surge in temperature is responsible for increased melting of the Greenland Ice Sheet (Khan et al. Citation2015) and elevated flows of glacial meltwater (van As et al. Citation2014). The Russell Glacier, flowing west from the Greenland Ice Sheet, feeds into the Watson River that runs through the town of Kangerlussuaq and meets the head of the fjord Kangerlussuaq. Rising temperatures cause meltwater to accumulate beneath the glacier until enough pressure has developed for growing subglacial lakes to explode into a glacial outburst flood, or jökulhlaup (Mernild et al. Citation2008). During jökulhlaups and other seasonal flooding events, the flood waters surge over the glacial outwash plain, carrying high concentrations of glacial flour across the landscape. These dust deposits can easily be picked up by wind and transported to other features across the landscape (; Bullard Citation2013). Because of the rapid increases in Arctic temperatures, Prospero, Bullard, and Hodgkins (Citation2012) predict that proglacial dust activity will intensify and become geographically more extensive. Interestingly, the timing of the return of jökulhlaups to Kangerlussuaq (from 2007 to present) is synchronous with the decline in regional lakewater DOC observed between 2003 and 2011 sampling campaigns. Aeolian-driven dust inputs can be rich in iron (Jickells et al. Citation2005; Mahowald et al. Citation2005), and humic-Fe associations are well documented (Dillon and Molot Citation1997; Francko and Heath Citation1982; Jones, Shaw, and De Haan Citation1993; Maloney et al. Citation2005; Shapiro Citation1966). Some fractions of humic DOC are known to adsorb to Fe oxides, resulting in flocculation of this humic DOC (Fox and Wofsy Citation1983; Tipping Citation1981), and hence, a decline in lake-water DOC concentration (). It should be noted, however, that dust can also contain organic carbon, and thus be a source of DOC to lakes as well (Mladenov et al. 2012). Furthermore, phosphorus (P) can stimulate bacterial growth in lakes (Carlsson and Caron Citation2001), so the P content of the dust could influence bacterial contributions to the DOC pool.
Figure 1. Floodplain dust entrained by wind, Kangerlussuaq. Photo credit: Rachel Fowler
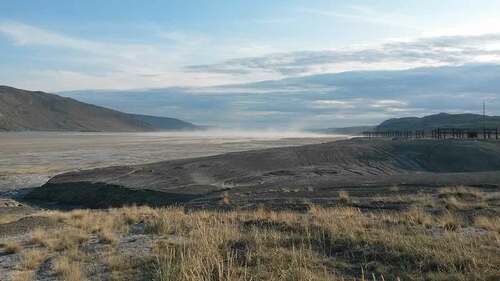
Figure 2. Conceptual diagram illustrating potential chemical (photodegradation), biological (bacterial consumption), and physical (flocculation and precipitation) pathways for DOC loss in surface waters. Interactions between dust and solar radiation may lead to DOC loss via photoflocculation, and interactions between solar radiation and bacterial activity could have variable effects. Note that pathways are not exclusive of each other (i.e., DOC loss could occur via multiple pathways)
Additionally, exposure to sunlight may influence both DOC quantity and composition in lakes. Osburn, Morris et al. (Citation2001) and Spencer et al. (Citation2009) demonstrated that natural sunlight causes photodegradation of DOC, resulting in decreases in DOC concentration and of SUVA254, and Lapierre and Del Giorgio (Citation2014) showed high rates of DOC loss caused by photodegradation in irradiation experiments. Photochemical degradation breaks down DOC into dissolved inorganic carbon (DIC) and carbon monoxide (CO), and promotes photobleaching, or loss of DOC color (; Moran, Wade, and Zepp Citation2000; Morris and Hargreaves Citation1997). Cory et al. (Citation2014) found that photooxidation of DOC by sunlight accounted for 70–95 percent of all water-column C processing in lakes and streams in and near the Kuparuk River Basin in Alaska. In other studies, loss of DOC with light exposure has been significant, as well (i.e., 31% of initial concentration; Moran, Wade, and Zepp Citation2000). In addition, sunlight may interact with increased Fe from dust inputs, with photoflocculation effectively reducing the amount of humic DOC in lake water (Helms et al. Citation2013; ). However, cloud cover has increased in the Arctic (Eastman and Warren Citation2013), and there has been no apparent change in the timing of ice-out in the Kangerlussuaq region between 2003 and 2011 (Saros et al. Citation2015), indicating that exposure to solar radiation has not likely increased in this area. One pathway by which photodegradation may become a more important mechanism is via amplified permafrost thaw that loads proportionally more photochemically labile fractions into the DOC pool.
Interactions between photochemical degradation and biological processing have also been demonstrated, in which bacteria readily assimilate labile, low molecular weight (LMW) dissolved organic matter (DOM) photoproducts. As a result, exposure to sunlight can increase DOM processing through chemical and biological pathways, and can also boost bacterial production and respiration (Guillemette and Del Giorgio Citation2012; Miller and Moran Citation1997). Ultraviolet light can also inhibit bacterial activity, and could have varying effects on the bacterial processing rates of DOC (Granéli, Lindell, and Tranvik Citation1996). While bacterial activity in natural waters is typically thought to degrade DOC (Lu et al. Citation2013), variables such as temperature, initial DOC composition, nutrients, and light exposure can influence the bioavailability of DOC and the simultaneous production and consumption of DOM by bacteria in aquatic systems (Guillemette and Del Giorgio Citation2012).
There are multiple potential drivers of declining DOC in west Greenland lakes, with the physical, chemical, and biological effects of sunlight, dust, and bacterial transformation possibly contributing to this loss to varying degrees. To investigate possible mechanisms behind these recent changes, we experimentally tested the effects of dust inputs, light, or bacterial activity on DOC concentration and quality (SUVA254 and S275–295) in lake surface water. We performed two experiments, both factorial in design, based on the mechanisms described previously and the possible interactions (dust addition × photodegradation and photodegradation × bacterial activity) depicted in . We hypothesized that all three pathways (dust addition, sunlight exposure, or bacterial processing) would each lead to reductions in DOC concentration, with potential interactions between light exposure with dust addition or bacterial activity. SUVA254 is an index of the source and composition of DOC, with higher values corresponding to higher aromaticity (Weishaar et al. Citation2003; Williams et al. Citation2010). We predicted that light would decrease SUVA254, bacterial activity would increase SUVA254, and that dust would have little effect. The magnitude of S275–295 increases (becomes more negative) with photobleaching extent and is inversely proportional to the molecular weight (MW) of DOM (Fichot and Benner Citation2012; Helms et al. Citation2008), and so we predicted that sunlight exposure would increase the magnitude of S275–295, bacterial activity would decrease the magnitude of S275–295, and that dust inputs would cause no change.
Methods
Study site
The Kangerlussuaq region of west Greenland, situated just north of the Arctic Circle between 66–68°N and 50–53°W, makes up part of a 150-km ice-free margin between the coast and the Greenland Ice Sheet, which is drained by a large fjord. The region contains approximately 20,000 lakes that cover approximately 14 percent of the dry tundra landscape (Anderson, D’andrea, and Fritz Citation2009). Most of these lakes are oligotrophic and chemically dilute (Anderson et al. Citation2001). Betula and Salix woody shrubs are the dominant vegetation, and the continuous permafrost soil active layer ranges from 20 cm to 90 cm (Johansson et al. Citation2015). The mean summer temperature and annual precipitation are 10.2°C and 173 mm yr−1, respectively, with most of the precipitation occurring as rain between May and September. Annual evapotranspiration is 200–300 mm yr−1, mostly occurring in the summer (Bosson et al. Citation2013). The wind regime is dominated by strong easterly katabatic winds that are driven by the Greenland Ice Sheet, as well as smaller-scale westerly winds resulting from Atlantic storms (Bullard and Austin Citation2011). The lakes in this region are characterized as having long residence times (Anderson and Stedmon Citation2007; Leng and Anderson Citation2003), with runoff from the active layer (Leng and Anderson Citation2003) and precipitation as the primary water inputs, with minimal surface inflow or outflow (Bosson et al. Citation2013).
The average summer 2015 DOC concentration across lakes in this region was 15 mg L−1, while the average SUVA254 and S275–295 were 1.5 L mg C−1 m−1 and −0.03 nm−1, respectively (J. E. Saros, 2015, unpublished data). depicts the lakes selected as experimental subjects for this study on the Kangerlussuaq landscape—two are high-DOC lakes with differing DOC quality and one is a low-DOC lake. Lakes with different initial DOC properties were selected to provide insight about how these properties may alter the response to experimental drivers. Lake SS2 and Lake SS1381 are high-DOC (22–27 mg L−1) lakes in the Kellyville region downwind of the proglacial floodplain. In contrast, DOC concentrations in the surface waters of Lake SS901, located near the Greenland Ice Sheet, are 7–9 mg L−1. Lake SS901 has the highest SUVA254 (1.76 L mg C−1 m−1) and lowest-magnitude S275–295 (−0.024 nm−1), while Lake SS1381 has the lowest SUVA254 (1.03 L mg C−1 m−1) and highest-magnitude S275–295 (−0.034 nm−1; ). Because water in the study lakes has already been exposed to some quantity of aeolian-transported dust, we also conducted an experiment with soil-water extracts near Lake SS2 to determine how dust addition affects DOC in water with minimal prior exposure to dust. The initial DOC concentration of the soil-water extracts was 68 mg L−1, while the initial SUVA254 was 8.5 L mg C−1 m−1, and the initial S275–295 was −0.013 nm−1.
Table 1. Characteristics of the three study lakes. DOC, pH, and temperature measurements were taken from lake epilimnia in June 2015. Nutrient data are from June–July 2013. a.s.l. = above sea level
Figure 3. Study area. SS2, SS1381, and SS901 denote the locations of experimental lakes
Experimental design
We used factorial designs in two experiments with water from each experimental lake. We tested dust (none or added) × light (light or dark) in the first experiment, and bacterial activity (filtered or inoculated) × light (light or dark) in the second experiment. “Light” includes wavelengths for both UV and photosynthetically active radiation (PAR). The dust + light experiment was conducted in July 2015 and the bacterial activity + light experiment in July 2016. Three replicates of each treatment for each lake were created.
For both experiments, two liters of water were collected from each lake at 2–3 m depth and filtered through 100 µm Nitex mesh to remove large zooplankton. A vacuum pump was used to gently pull the water through 0.7 µm GF/F filters, and this filtered water was used for experiments. For the dust + light experiment, fine-grained dust was collected from the floodplain and added at a proportion of 2.5 mg dust to 250 ml lake water (comparable to summer dust deposition measured by Engels Citation2003). Lake water for the bacteria + light experiment was filtered through Nucleopore 0.2 µm track-edged membranes to remove bacteria. The 0.2 µm-filtered water served as the filtered treatment, while samples for the bacterial inoculation treatment were inoculated with 3 ml of the 0.7 µm-filtered lake water. Treatments (250-ml volume) were incubated in dark and light conditions for seven days. The dust + light experiment was carried out in 2015, and the bacteria + light experiment in 2016. “Dark” samples in the dust + light experiment were incubated in acid-washed 250-ml HDPE bottles in a dark laboratory cupboard at 22°C. “Light” samples were incubated outside in pre-leached and dried 500-ml liquid-tight bags (Bitran S Series) to allow for unobstructed penetration of light into the water at 17°C average temperature. Light samples were randomly placed in sunlight-exposed clear plastic bins containing 3 cm water for temperature buffering, and HOBO loggers inside the bins recorded daily temperature and light intensity fluctuations. For the bacteria + light experiment, incubation conditions were modified so that both light and dark treatments were incubated in the same location and at the same temperature. Both dark and light samples were incubated in Bitran bags, and the dark samples were wrapped in aluminum foil to block light. As in the dust + light experiment, the samples were then randomly placed in water-filled clear plastic bins for the duration of the experiment.Water for DOC analysis was sampled at the onset of each experiment and again on day 7, then filtered through 0.7 µm GF/F filters, and immediately frozen at −20°C. It has been noted that freezing water samples may reduce DOC concentration (Fellman, D’Amore, and Hood Citation2008) or aromaticity (Fellman, D’Amore, and Hood Citation2008; Peacock et al. Citation2015) in surface-water samples via flocculation. However, we were most interested in DOC comparisons among treatments, which were all preserved with the same method. We assumed that treatment type would not affect DOC response to freezing, and chose freezing as a preservation method for the samples in this study.
To ensure that the Bitran bags were not leaching compounds that could influence DOC concentration and quality, we developed a Bitran bag versus quartz flask comparison with the bacteria + light experiment. For the light treatment, filtered and inoculated replicates were incubated in quartz flasks along with the replicates in the Bitran bags, and their DOC concentration and quality metrics were compared. SUVA254 declined an average of 11.2 percent in the quartz flasks and 12 percent in the Bitran bags. The magnitude of S275–295 increased 12.9 percent and 14 percent, respectively, in the flasks and bags, and DOC concentration increased 0.2 percent and 0.06 percent in the flasks and bags, respectively. This test suggested that the Bitran bags were not leaching chromophoric compounds that affected the outcome of the light experiments.
For the soil experiment, soil samples were collected from below 2–3 cm depth near Lake SS2 and were sealed field-moist in Whirl-Pak bags. Deionized (DI) water was added to the soil in an approximately 1:7 soil-to-water ratio to extract DOM in the soil (Jones and Willett Citation2006). The solution was mixed to break up clumps of soil, and was stored in the dark at 22°C for seven days. After this time, the soil-water solution was filtered through 0.7 µm GF/F filters, the filtrate was added to 250-ml HDPE bottles, and the pH of the filtrate was measured with a Hydrolab® DataSonde 5a (OTT Hydromet, Loveland, CO). For the dust-addition treatments, 2.5 mg dust was added to 250 ml of the soil-water solution. Triplicate dust and no-dust treatments were incubated in the dark for seven days at 22°C. Water was collected for DOC analysis as described earlier.
Dust collection
We also determined the elemental composition and flux of dust to two of the study lakes. To collect aeolian-transported dust for elemental analysis, we set up Big Spring Number Eight (BSNE) dust samplers during the summer of 2015 at high elevation points alongside Lake SS2 and Lake SS901. The BSNE samplers can trap up to 95 percent of airborne dust, regardless of wind velocity or direction. Sampling containers were mounted at heights of 40 cm, 65 cm, and 90 cm, and the samplers rotated so as to face into the wind for maximum dust collection. The BSNE dust samplers were left to collect dust for seven days. We also used a fine-bristled brush to collect dust directly from the outwash floodplain. To determine Fe and P content that could be leached into the lakes during a one-month period from this dust, the dust samples were soaked in DI water (pH 5.6) for one month, and filtered through 0.7 µm GF/F filters to remove residual sediment. A subset of floodplain dust samples was also acidified with 0.02 N nitric acid to pH 3 for estimation of total elemental composition. Elemental analysis of the filtrates was conducted with an ICP/MS. In July 2016, we set up marble dust collectors, simple traps that collect dust in the vertical dimension, to allow us to make estimates of how much dust enters the lakes per unit area over time. The traps were set up for fourteen days on the shores of Lake SS2 and Lake SS901. At the end of the fourteen days, the Lake SS901 collector was found dismantled, presumably by wildlife, and so estimates of dust input were only calculated for Lake SS2. To measure the amount of dust collected in the marble trap, the marbles were rinsed with DI water, which was then filtered through preweighed 0.7 µm GF/F filters. The filters were dried and reweighed, and the total dust mass was divided by the area of the dust sampler and exposure time to calculate dust flux.
DOC analysis
On return to the University of Maine, after being frozen for approximately eight weeks, the experimental water samples were analyzed for DOC concentration ([DOC], in mg L−1) using a Shimadzu TOC-5000 total organic carbon (TOC) analyzer by high-temperature catalytic oxidation. Spectral absorbance of each sample was measured on a Varian Cary 300UV spectrophotometer in 1 cm quartz cells. Absorption coefficients from 220 nm to 700 nm were calculated using the equation:
In this equation, a represents the Napierian absorption coefficient (m−1) at wavelength λ, A is absorbance value at wavelength λ, and L is the cuvette path length, 0.01 m. SUVA254 was calculated following the methods of Helms et al. (Citation2008). Soil-water filtrate samples were diluted 1:10 for absorbance measurements.
Data analysis
Two-way ANOVA was used to examine the effects of dust input and light exposure or bacterial activity and light exposure on [DOC], SUVA254, and S275–295 for lake-water samples. One-way ANOVA was used to analyze the impact of dust addition on soil-water samples incubated in the dark. The significance level chosen was p < 0.05. Data were square root or log transformed when necessary to better meet assumptions of equal variance and normality. The spectral slope coefficient S (a measure of the decline in absorption with wavelength), was plotted against a*375, the absorbance at 375 nm normalized to [DOC] (a qualitative measure of DOM color), as in Anderson and Stedmon (Citation2007), for interpretation of experimental DOC degradation. Analyses were performed in R 3.3.1(R Development Core Team Citation2016).
Results
The results showed that dust addition, bacterial activity, or natural sunlight did not cause losses in [DOC] in any of the experiments. The DOC quality metrics SUVA254, S275–295, a*375, and S were also relatively unaffected by dust addition (with the exception of SS2) and bacterial activity, but experienced unexpectedly large effects from exposure to natural sunlight. These outcomes will be described further on by summarizing the effects of the treatment (dust or bacterial activity), light exposure, and the interaction of the treatment and light exposure on [DOC], SUVA254, and S275–295 for each experiment. Percent changes and p values for treatments are given in and , respectively, and – illustrate these results graphically. Finally, we describe shifts in S versus a*375 to aid interpretation of DOC degradation in both the dust + light and bacterial activity + light experiments, illustrated in .
Table 2. Mean percent change in DOC concentration and quality metrics for dust addition + light and bacterial activity + light experiments. The dust addition experiment for soil water was incubated in dark conditions only
Table 3. The p values for dust addition + light exposure and bacterial activity + light exposure experiments. Bold values represent a significance level less than 0.05. Nonsignificant (p ≥ 0.10) interaction terms were removed from statistical models. The dust-addition experiment for soil water was incubated in dark conditions only
Figure 4. Results of Lake SS2 soil-water exposure to dust addition on SUVA254, S275–295, and [DOC], represented by percent change (n = 3)
![Figure 4. Results of Lake SS2 soil-water exposure to dust addition on SUVA254, S275–295, and [DOC], represented by percent change (n = 3)](/cms/asset/dd905106-024c-46cb-8013-f23574029d93/uaar_a_1436815_f0004_b.gif)
Figure 5. Results of SS2, SS1381, and SS901 lake-water exposure to dust addition and light on SUVA254, S275–295, and [DOC], represented by percent change (n = 3)
![Figure 5. Results of SS2, SS1381, and SS901 lake-water exposure to dust addition and light on SUVA254, S275–295, and [DOC], represented by percent change (n = 3)](/cms/asset/1d37d663-6a3c-457d-bcc8-c1dcf79e1f25/uaar_a_1436815_f0005_b.gif)
Figure 6. Results of SS2, SS1381, and SS901 lake-water exposure to bacterial activity and light on SUVA254, S275–295, and [DOC], represented by percent change (n = 3). F = filtered treatments, I = inoculated treatments
![Figure 6. Results of SS2, SS1381, and SS901 lake-water exposure to bacterial activity and light on SUVA254, S275–295, and [DOC], represented by percent change (n = 3). F = filtered treatments, I = inoculated treatments](/cms/asset/41c52e2c-4492-4de8-949d-01acdc4529cd/uaar_a_1436815_f0006_b.gif)
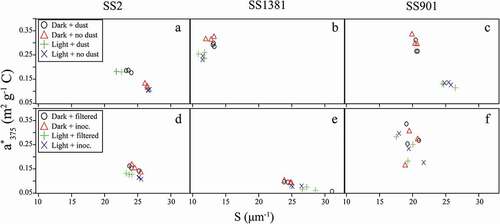
Figure 7. S versus a*375 for dust + light (A–C) and bacteria + light (D–F) experiments (n = 3)
Soil-water experiment
The pH of the soil-water filtrate was 6.38. Dust had no effect on any of the response metrics in the soil-water experiment. [DOC] declined 26 percent in the no-dust treatment and 22 percent in the dust treatment, a difference that was not significant (p = 0.230; , and ). SUVA254 increased 36 percent in the no-dust treatment and 30 percent in the dust treatment (p = 0.237 dust–no-dust treatment difference). The magnitude of S275–295 increased 4 percent in no-dust treatments and 2 percent in dust treatments (p = 0.146).
Dust addition + light exposure experiment
During the course of the dust + light experiment, [DOC] increased in light treatments for all lakes relative to initial [DOC] (6–38%, 1.1–3.8 mg L−1; p < 0.001), while dust addition had no effect on [DOC] for any of the lakes (p = 0.985 SS2; p = 0.313 SS1381; p = 0.110 SS901; , and ). There were no interaction effects between dust and light. The increases in [DOC] were all outside the quantification limit of the TOC analyzer (0.1 mg L−1).
SUVA254 decreased more in light treatments (−6% to −20%) than in dark treatments (−0.7% to −14%) for all three lakes (p < 0.001). The decline in SUVA254 was not different between dust and no-dust treatments, except for Lake SS2, in which SUVA254 declined more in the no-dust treatments than in the dust treatments, regardless of light (17% vs. 3%, respectively; p < 0.001). Interaction effects between dust and light exposure occurred in the Lake SS1381 treatments, in which SUVA254 declined more in light-exposed dust treatments than in dark + dust treatments (p = 0.017).
The magnitude of S275–295 changed little in dark treatments for Lake SS1381 and Lake SS901, and increased (7–28%, respectively) in light treatments for these lakes (p = 0.045 SS1381; p < 0.001 SS901). Light did not affect the magnitude of S275–295 response for Lake SS2, but dust addition did—the magnitude of S275–295 increased about 1 percent in the dust treatments, compared to a 20-percent increase in the no-dust treatments (p < 0.001). Dust addition had no effect on S275–295 for either Lake SS1381 or Lake SS901 (p = 0.878 SS1381; p = 0.111 SS901). Interactions between dust addition and light exposure had no effect on S275–295.
For Lake SS2, S values were higher and a*375 values were lower in no-dust treatments than in dust treatments, while light exposure had no effect (). Light treatments resulted in lower a*375 and S values for Lake SS1381, while dust had no effect (). Light treatments resulted in lower a*375 and higher S values for Lake SS901, while dust had no effect ().
Bacterial activity + light exposure experiment
The [DOC] response to light exposure was variable among the lakes. [DOC] increased more in dark compared to light treatments for Lake SS2 (0.6 mg L−1 vs. 0 mg L−1; p = 0.008), while it increased in light treatments relative to dark treatments for lake SS1381 (0.7 mg L−1 vs. 0.3 mg L−1; p = 0.026), and was not influenced by light for Lake SS901 (p = 0.401; , and ). There were no differences in [DOC] between filtered and inoculated treatments (p = 0.670 SS2; p = 0.177 SS1381; p = 0.887 SS901), and no interaction effects between bacterial activity and light exposure.
SUVA254 declined slightly or did not change in dark treatments for Lake SS2 and Lake SS1381, while it declined in light treatments (10–12%; p < 0.001 for both lakes) and was not affected by light for Lake SS901 (p = 0.254). The effects of bacterial activity were variable among the lakes. SUVA254 in inoculated treatments was lower than in filtered treatments for Lake SS2 (p = 0.026), higher for Lake SS1381 (p = 0.009), and experienced no change for Lake SS901 (p = 0.889). There were no interaction effects between bacterial activity and light exposure.
For all lakes, light exposure caused the magnitude of S275–295 to increase 10–20 percent compared to dark treatments, in which it increased slightly or did not change (p < 0.001 SS2 and SS1381, p = 0.005 SS901). Bacterial activity had no effect on S275–295 (p = 0.216 SS2; p = 0.080 SS1381; p = 0.122 SS901). There were no interaction effects between light and bacterial activity on S275–295.
For Lakes SS2 and SS1381, light treatments had lower a*375 values than dark treatments ( and ), while a*375 showed little difference between light and dark treatments for Lake SS901 (). S values were greater in light treatments than dark treatments for SS1381 (), while showing no difference for Lakes SS2 and SS901 ( and ). Differences between inoculated and filtered treatments were small, except for SS2, in which light + inoculated treatments had higher S values than light + filtered treatments ().
See Supplementary Table 1 for average [DOC], SUVA254, and S275–295 data for the dust + light and bacteria + light experiments.
Dust input rates and elemental analysis
The areal rate of dust deposition near Lake SS2 was 0.931 g m−2 d−1. The Fe content was 1.8 mg kg−1 from dust collected near Lake SS2 and 3.5 mg kg−1 from dust collected near Lake SS901. Dust collected from the glacial outwash floodplain and soaked in DI water had an Fe content of 3 mg kg−1, while the Fe content of dust soaked at pH 3 was 90 mg kg−1. The P content of dust collected near Lake SS2 was 3 mg kg−1 and 6 mg kg−1 for dust collected near Lake SS901, while the P content of floodplain dust soaked in DI water was 3 mg kg−1 and 80 mg kg−1 for floodplain dust soaked at pH 3.
Discussion
Overall, we found that none of the experimental mechanisms tested (dust addition, bacterial activity, or solar radiation) were responsible for declines in [DOC] in experimental lake water. However, exposure to sunlight caused large changes in DOC quality, including declines in SUVA254 and increases in the magnitude of the spectral slope, S275–295. These results indicate that exposure to natural sunlight caused photobleaching of DOC in lake water, reducing aromaticity and degrading high molecular weight (HMW) DOC into LMW DOC. Because the study lakes have limited hydrological connectivity and low chromophoric DOM (CDOM) compared to boreal systems, it might be expected that prior sunlight exposure would have reduced their susceptibility to photochemical transformation throughout the course of the experiment. However, the shifts in DOC quality during the experiment indicate that the DOC of the study lakes is highly photoreactive. We discuss the implications of this finding further on, along with interpretations of the effects of each of the experimental treatments on DOC quantity and quality metrics.
Dust
We predicted that dust addition would cause a decline in [DOC] in the three experimental lakes. We found that dust addition caused no difference in [DOC] and that photoflocculation did not occur. We expected Fe in the dust to bind to the humic portion of DOC in the water column, and then flocculate and precipitate out of the surface water, effectively reducing [DOC]. Fe-humic DOC bonds may be of less consequence than we predicted—the DOC in the lakes near Kangerlussuaq has low color, and may not have high humic content as a result of low precipitation levels and limited catchment inputs. Additionally, the dust addition may have added DOC, thereby offsetting any Fe-driven losses. Mladenov et al. (Citation2011) hypothesized that remote high-latitude alpine lakes within the Saharan dust belt received inputs of CDOM from atmospheric dust. In the same study, polar lakes at lower elevations and outside the dust source did not reflect changes in DOM. However, many Kangerlussuaq lakes are proximal to the dusty floodplain. Future analysis of the organic content of dust from this region could help clarify its potential for influencing lake-water DOC.
As expected, DOC composition did not change in response to dust inputs in water from Lakes SS1381 and SS901. However, in water from Lake SS2, SUVA254 was higher and the magnitude of S275–295 was smaller in dust treatments than in no-dust treatments. The magnitude of S275–295 is thought to be inversely proportional to molecular weight (Helms et al. Citation2008), and SUVA254 can be used as an indicator of aromaticity. Therefore, the dust additions may have contributed DOC with a more terrestrial signature (greater aromaticity and higher MW). The lower a*375 and higher S values for Lake SS2 dark treatments of this experiment () indicate that in 2015, the DOC in Lake SS2 was more processed and less fresh, with possibly greater autochthonous than allochthonous inputs than the DOC in Lakes SS1381 and SS901. For this reason, the dust inputs caused a greater response in DOC quality in Lake SS2 than in the other two lakes, which were more influenced by sunlight exposure.
These interpretations are supported by the results depicted in , which show that Lake SS2 dust treatments have higher a*375 and lower S values. Like SUVA254, larger a*375 values typically correspond to a greater humic content, because humic substances are enriched in aromatic C, whereas larger S values may represent the extent of photochemical degradation (Anderson and Stedmon Citation2007). DOC quality in the dust treatments was fresher and less degraded, with a more terrestrial signature, while DOC quality in the no-dust treatments appeared more processed and degraded. and illustrate the lack of dust effects on a*375 and S for Lake SS1381 and Lake SS901, which are instead affected by sunlight exposure.
In the soil-water experiment, no significant differences occurred between dust and no-dust treatments. However, in both treatments, SUVA254 increased while [DOC] declined, possibly indicating bacterial degradation—bacteria in the soil solution may have been preferentially consuming aromatic-poor DOC. Kalbitz et al. (Citation2003) found that higher-aromaticity DOM in marsh and forest soils in Germany was less readily degraded by bacteria than more labile DOM, although it should be noted that lability of terrigenous DOC in Alaskan rivers has been estimated to be relatively high (Holmes et al. Citation2008).
Bacterial activity
Contrary to our hypothesis, the bacteria + light treatment did not cause a decline in [DOC] in the experiment, however, the experimental design used here may have strongly limited the potential magnitude of the effects of bacteria on [DOC]. To remain consistent in the handling of both the filtered and inoculated treatments, we filtered lake water through a 0.2 µm filter to remove microbes, and then to these “inoculated” treatments we added 3 ml of 0.7 µm-filtered lake water to reintroduce bacteria, while leaving the “filtered” treatments un-inoculated. Thus, via dilution in the inoculated treatments, reduced bacterial biomass may have been unable to induce meaningful effects on [DOC] during the seven-day experiment.
Recognizing this limitation in our experimental design, we do note that other studies have also found a weaker effect of bacterial activity compared to photochemical degradation. Cory et al. (Citation2014) found that in Arctic inland surface waters, the effects of bacterial C processing are overshadowed by photochemical degradation, which could explain the lack of a decline in [DOC] in response to inoculation in our experiment. Obernosterer and Benner (Citation2004) also described competition between photochemical and bacterial degradation of DOC in a lake with a similar quantity of CDOM as the lakes in this study, in which a greater proportion of reactive DOC was susceptible to photodegradation rather than bacterial degradation. In a long-term study comprising hundreds of boreal lakes, wetlands, and rivers in Canada, Lapierre et al. (2013) showed that compared to photochemical degradation rates, bacterial degradation rates were too small to be meaningful. Photochemical degradation increased with terrestrial inputs of DOC, while rates of bacterial degradation remained constant. Osburn, Morris et al. (Citation2001) showed that wetland (bog) DOC had far greater photochemical susceptibility than adjacent lake-water DOC, implying the highly photoreactive nature of soil and wetland sources of DOM.
S275–295 was not affected in inoculated treatments in water from any of the lakes, contradicting our prediction that the magnitude of S275–295 values would decline as a result of bacterial degradation, as in Helms et al. (Citation2008). This lack of response could suggest that S275–295 is more impacted by sunlight than by bacterial processing in these experiments, but the bacterial dilution in the experimental design and resulting low bacterial biomass may have restricted our ability to infer the effects of bacterial degradation on DOC quality. We surmise that the dilution effect may also have inhibited any meaningful change to SUVA254 values.
Solar radiation
Of the three DOC removal pathways tested in this study, solar radiation caused the most notable responses in DOC concentration and quality. Sunlight exposure increased [DOC] in water from all three lakes in the dust + light experiment. In the bacteria + light experiment, [DOC] changes were small and variable among the lakes. We were surprised that these experiments did not result in loss of [DOC], as photooxidation of DOC into CO2 is widely accepted as a major driver of carbon processing in Arctic surface waters (Cory et al. Citation2014). One possible factor contributing to [DOC] increases in light treatments of the dust + light experiment may be primary production by the picophytoplankton that passed through the 0.7 µm GF/F filters. Chlorophytes and cyanobacteria are two important phytoplankton classes that contribute to picophytoplankton (Stockner and Antia Citation1986). While densities of cyanobacteria were low or nonexistent, chlorophytes were present in water samples collected in July 2013 from each of the three study lakes, at densities of 11 cells ml−1, 126 cells ml−1, and 98 cells ml−1 for Lakes SS2, SS1381, and SS901, respectively (J. E. Saros, 2013, unpublished data). It is interesting to note that the smallest experimental [DOC] increase (1.3 mg L−1) occurred in water from Lake SS2, which had the lowest density of chlorophytes in the July 2013 samples, while [DOC] increases were greater in water from Lakes SS1381 and SS901 (3.2 and 3.0 mg L−1, respectively), which had higher chlorophyte densities. However, without primary productivity measurements for picophytoplankton in the experimental water, we are unable to estimate the potential contribution of picophytoplankton to the observed [DOC] increase in the dust + light experiment. Even assuming high growth rates throughout the experiment, and a large proportion of primary production excreted as DOC, it is unlikely that primary production by chlorophytes could have solely been responsible for the magnitude of increase in [DOC] measured in these experiments. Measurements of picophytoplankton primary production could better elucidate the role of these small autotrophs in carbon cycling in Kangerlussuaq surface waters, but an understanding of the primary mechanism responsible for [DOC] increases in the light conditions of these experiments will require further research.
Sunlight exposure caused SUVA254 to decline and the magnitude of S275–295 to increase for lakes in both experiments, as expected (except Lake SS2 in the dust + light experiment and Lake SS901 in the bacteria + light experiment, which showed no change). It has been demonstrated that UV exposure breaks down HMW DOM and reduces aromaticity (Osburn, Morris et al. Citation2001), which is supported by these results, as well as the reductions in a*375 and increases in S values in light treatments. Our findings are consistent with values for these parameters reported in prior surveys of lakes across west Greenland, which include DOM quality metrics indicating high DOM susceptibility to photochemical transformation (Anderson and Stedmon Citation2007; Osburn et al. Citation2017). These results are especially of interest because they show that the DOC in these comparatively CDOM-poor lakes remains susceptible to photochemical changes in quality under constant sunlight exposure during the polar summer.
Hydrological connectivity is weak within the Kangerlussuaq landscape and precipitation is low. The presence of continuous permafrost also currently limits connectivity between soils and lakes (Anderson et al. Citation2017), so we might expect terrestrial DOC loading to these lakes to be minimal. In addition, the low SUVA254 values (<2.0 L mg C−1 m−1) of these lakes might suggest limited susceptibility to photochemical transformation. However, mean [DOC] in the Kangerlussuaq lakes is far greater than the global mean and rivals that of darkly colored boreal lakes (Sobek et al. Citation2007). The results of our short-term experiments, however, indicate that the quality of DOC in Kangerlussuaq lakes remains highly responsive to sunlight exposure. This key finding is relevant in the context of the rapid, nonlinear shift in climate presently occurring in the Arctic—if low-color DOC previously exposed to abundant sunlight remains responsive to photochemical transformation, then future changes in light availability, terrestrial-aquatic linkages, and temperature will likely elicit continued and substantial shifts in the DOC quality of these lakes. While cloud cover may be increasing in the Arctic (Eastman and Warren Citation2013), and there has been no clear trend in ice-off dates in the limited data sets for this region (Saros et al. Citation2015), ice-free duration is lengthening for many lakes in the Arctic in response to climate warming (Magnuson et al. 2000). If ice-free duration were to increase for Kangerlussuaq lakes, duration of sunlight exposure would also increase, and the seasonal pulse of meltwater inputs may shift temporally and in magnitude (Anderson et al. Citation2017). This shift could influence the composition of the DOC pool and its susceptibility to photochemical transformation. Furthermore, continued warming may enhance permafrost thaw, which could introduce fresher, more labile DOC to lake surface waters. The proportion of substrate available for bacterial activity may increase, while photodegradation and photobleaching of this soil-derived DOM could further stimulate bacterial processing.
Future work
While our experiments confirm the effects of sunlight exposure on lake-water DOC quality suggested by Anderson and Stedmon (Citation2007), they did not elucidate mechanisms responsible for the widespread and coherent decline in DOC concentration in the lakes of the Kangerlussuaq region. Future studies should explore external factors that may be responsible for this pattern. One such mechanism may be increased delivery of atmospheric sulfur to lakes, which is supported by increasing sulfate levels measured in the study lakes (Saros et al. Citation2015). In North America, declines in atmospheric sulfur deposition have been linked to increasing DOC concentrations in lakes (Strock et al. Citation2016). Perhaps increased marine primary production in the Arctic since 2003 has enhanced sulfate deposition to lakes via oxidation of dimethyl sulfide (DMS; Arrigo, van Dijken, and Pabi Citation2008). Additionally, more frequent volcanic eruptions, such as that of the Icelandic volcano Bárðarbunga that released massive clouds of sulfur dioxide in 2014, could be responsible for the delivery of sulfate to lakes in the Kangerlussuaq region (Gauthier et al. Citation2016). Shifts in terrestrial C inputs may also play a role in reduced DOC. With climate warming, herbivory pressure by large mammals is likely to change, with implications for plant community composition and terrestrial DOC pools (Anderson et al. Citation2017). While it is currently unclear whether hydrological linkages between terrestrial and aquatic systems will strengthen or weaken in the future, the DOC pools of lakes will undoubtedly respond to terrestrial processes, and further study is warranted.
Conclusions
The results described herein represent the complexities involved in deciphering drivers of changes in the DOC of west Greenland surface waters. This study demonstrates how several mechanisms can contribute to lake-water DOC composition, and that these mechanisms may work in opposite directions and at different magnitudes depending on lake properties and the initial characterization of DOC in the lakes. While our experimental examination of potential pathways of DOC changes did not illuminate the cause for the widespread DOC concentration decline observed in the lakes of the Kangerlussuaq area in recent years, we were able to advance our understanding of the characterization of DOC in this region and how it can fluctuate in response to sunlight exposure, dust inputs, or bacterial activity. The quality of DOC in the study lakes was most susceptible to photochemical transformation, despite the low amounts of CDOM and annual periods of continuous exposure to sunlight during the polar summer (Osburn, Retamal, and Vincent Citation2009). These results suggest the potential for continued shifts in DOC quality with rapid and nonlinear climate change in this region, as well as the need for further study of mechanisms external to lakes that may be responsible for widespread and coherent regional decline in DOC concentration.
Supplementary Materials
Download Zip (16.7 KB)Acknowledgments
We thank two reviewers for providing helpful comments that improved the quality of this manuscript. Mike Handley conducted dust elemental analysis, Jo Bullard gave advice on dust sampling, and Benjamin Burpee, Max Egener, Robert Northington, Andrea Nurse, Helen Schlimm, Kristin Strock, Carl Tugend, and Kate Warner provided valuable field assistance.
Supplemental materials
Supplemental data for this article can be access on the publisher’s website.
Additional information
Funding
References
- Anderson, N. J., W. D’andrea, and S. C. Fritz. 2009. Holocene carbon burial by lakes in SW Greenland. Global Change Biology 15 (11):1–16.
- Anderson, N. J., R. Harriman, D. B. Ryves, and S. T. Patrick. 2001. Dominant factors controlling variability in the ionic composition of west Greenland lakes. Arctic, Antarctic, and Alpine Research 33 (4):418–25.
- Anderson, N. J., J. E. Saros, J. E. Bullard, S. M. Cahoon, S. McGowan, E. A. Bagshaw, C. D. Barry, R. Bindler, B. T. Burpee, J. L. Carrivick, et al. 2017. The Arctic in the twenty-first century: Changing biogeochemical linkages across a paraglacial landscape of Greenland. BioScience 67 (2):118–33.
- Anderson, N. J., and C. A. Stedmon. 2007. The effect of evapoconcentration on dissolved organic carbon concentration and quality in lakes of SW Greenland. Freshwater Biology 52:280–89.
- Arrigo, K. R., G. van Dijken, and S. Pabi. 2008. Impact of a shrinking Arctic ice cover on marine primary production. Geophysical Research Letters 35 (19):L19603.
- Bosson, E., T. Lindborg, S. Berglund, L. G. Gustafsson, J. O. Selroos, H. Laudon, L. L. Claesson, and G. Destouni. 2013. Water balance and its intra-annual variability in a permafrost catchment: Hydrological interactions between catchment, lake and talik. Hydrology and Earth System Sciences Discussions 10:9271–308.
- Bullard, J. E. 2013. Contemporary glacigenic inputs to the dust cycle. Earth Surface Processes and Landforms 38 (1):71–89.
- Bullard, J. E., and M. J. Austin. 2011. Dust generation on a proglacial floodplain, West Greenland. Aeolian Research 3 (1):43–54.
- Carlsson, P., and D. A. Caron. 2001. Seasonal variation of phosphorus limitation of bacterial growth in a small lake. Limnology and Oceanography 46 (1):108–20.
- Cory, R. M., C. P. Ward, B. C. Crump, and G. W. Kling. 2014. Sunlight controls water column processing of carbon in arctic fresh waters. Science 345 (6199):925–28.
- Dillon, P. J., and L. A. Molot. 1997. Effect of landscape form on export of dissolved organic carbon, iron, and phosphorus from forested stream catchments. Water Resources Research 33 (11):2591–600.
- Eastman, R., and S. G. Warren. 2013. A 39-yr survey of cloud changes from land stations worldwide 1971–2009: Long-term trends, relation to aerosols, and expansion of the Tropical Belt. Journal of Climate 26:1286–303.
- Engels, S. 2003. Dust in the wind: Modern and historical aeolian deposition rates in an uphill lake catchment in the Kangerlussuaq region, West Greenland. Internal Report, Faculty of Geographical Sciences, Utrecht University.
- Fellman, J. B., D. V. D’Amore, and E. Hood. 2008. An evaluation of freezing as a preservation technique for analyzing dissolved organic C, N and P in surface water samples. Science of the Total Environment 392:305–12.
- Fichot, C. G., and R. Benner. 2012. The spectral slope coefficient of chromophoric dissolved organic matter (S275–295) as a tracer of terrigenous dissolved organic carbon in river-influenced ocean margins. Limnology and Oceanography 57 (5):1453–66.
- Fox, L. E., and S. C. Wofsy. 1983. Kinetics of removal of iron colloids from estuaries. Geochimica Et Cosmochimica Acta 47:211–16.
- Francko, D. A., and R. T. Heath. 1982. UV-sensitive complex phosphorus: Association with dissolved humic material and iron in a bog lake. Limnology and Oceanography 27:564–69.
- Frey, K. E., and L. C. Smith. 2005. Amplified carbon release from vast west Siberian peatlands by 2100. Geophysical Research Letters 32:L09401. doi:https://doi.org/10.1029/2004GL022025.
- Gauthier, P., O. Sigmarsson, M. Gouhier, B. Haddadi, and S. Moune. 2016. Elevated gas flux and trace metal degassing from the 2014–2015 fissure eruption at the Bárðarbunga volcanic system, Iceland. Journal of Geophysical Research: Solid Earth 121:1610–30.
- Granéli, W., M. Lindell, and L. Tranvik. 1996. Photo-oxidative production of dissolved inorganic carbon in lakes of different humic content. Limnology and Oceanography 41 (4):698–706.
- Guillemette, F., and P. A. Del Giorgio. 2011. Reconstructing the various facets of dissolved organic carbon bioavailability in freshwater ecosystems. Limnology and Oceanography 56 (2):734–48.
- Guillemette, F., and P. A. Del Giorgio. 2012. Simultaneous consumption and production of fluorescent dissolved organic matter by lake bacterioplankton. Environmental Microbiology 14 (6):1432–43.
- Helms, J. R., J. Mao, K. Schmidt-Rohr, H. Abdulla, and K. Mopper. 2013. Photochemical flocculation of terrestrial dissolved organic matter and iron. Geochimica Et Cosmochimica Acta 121:398–413.
- Helms, J. R., A. Stubbins, J. D. Ritchie, E. C. Minor, D. J. Kieber, and K. Mopper. 2008. Absorption spectral slopes and slope ratios as indicators of molecular weight, source, and photobleaching of chromophoric dissolved organic matter. Limnology and Oceanography 53 (3):955–69.
- Holmes, R. M., J. W. McClelland, P. A. Raymond, B. B. Frazer, B. J. Peterson, and M. Stieglitz. 2008. Lability of DOC transported by Alaskan rivers to the Arctic Ocean. Geophysical Research Letters 35:L03402. doi:https://doi.org/10.1029/2007GL032837.
- Jickells, T. D., Z. S. An, K. K. Andersen, A. R. Baker, G. Bergametti, N. Brooks, J. J. Cao, P. W. Boyd, R. A. Duce, K. A. Hunter, et al. 2005. Global iron connections between desert dust, ocean biogeochemistry, and climate. Science 308:67–71.
- Johansson, E., S. Berglund, T. Lindborg, J. Petrone, D. van As, L. G. Gustafsson, J. O. Näslund, and H. Laudon. 2015. Hydrological and meteorological investigations in a periglacial lake catchment near Kangerlussuaq, west Greenland: Presentation of a new multi-parameter data set. Earth System Science Data 7 (1):93–108.
- Jones, D. L., and V. B. Willett. 2006. Experimental evaluation of methods to quantify dissolved organic nitrogen (DON) and dissolved organic carbon (DOC) in soil. Soil Biology and Biochemistry 38:991–99.
- Jones, R. I., P. J. Shaw, and H. de Haan. 1993. Effects of dissolved humic substances on the speciation of iron and phosphate at different pH and ionic strength. Environmental Science and Technology 27 (6):1052–59.
- Kalbitz, K., J. Schmerwitz, D. Schwesig, and E. Matzner. 2003. Biodegradation of soil-derived dissolved organic matter as related to its properties. Geoderma 113:273–91.
- Khan, S. A., A. Aschwanden, A. A. Bjørk, J. Wahr, K. K. Kjeldsen, and K. H. Kjær. 2015. Greenland ice sheet mass balance: A review. Reports on Progress in Physics 78 (4):046801.
- Lapierre, J.-F., F. Guillemette, M. Berggren, and P. A. del Giorgio. 2013. Increases in terrestrially derived carbon stimulate organic carbon processing and CO2 emissions in boreal aquatic ecosystems. Nature Communications 4:2972. doi:https://doi.org/10.1038/ncomms3972.
- Lapierre, J.-F., and P. A. Del Giorgio. 2014. Partial coupling and differential regulation of biologically and photochemically labile dissolved organic carbon across boreal aquatic networks. Biogeosciences 11:5969–85.
- Leng, M. J., and N. J. Anderson. 2003. Isotopic variation in modern lake waters from western Greenland. The Holocene 13 (4):605–11.
- Lu, Y., J. E. Bauer, E. A. Canuel, Y. Yamashita, R. M. Chambers, and R. Jaffé. 2013. Photochemical and bacterial alteration of dissolved organic matter in temperate headwater streams associated with different land use. Journal of Geophysical Research: Biogeosciences 118:1–15.
- Magnuson, J. J., D. M. Robertson, B. J. Benson, R. H. Wynne, D. M. Livingstone, T. Arai, R. A. Assel, R. G. Barry, V. Card, E. Kuusisto, N. G. Granin, T. D. Prowse, K. M. Stewart, and V. S. Vuglinksi. 2000. Historical trends in lake and river ice cover in the northern hemisphere. Science 289:1743–46.
- Mahowald, N., A. Baker, G. Bergametti, N. Brooks, R. Duce, T. Jickells, N. Kubilay, J. Prospero, and I. Tegen. 2005. Atmospheric global dust cycle and iron inputs to the ocean. Global Biogeochemistry Cycles 19 (4):GB4025. doi:https://doi.org/10.1029/2004GB002402.
- Maloney, K. O., D. P. Morris, C. O. Moses, and C. L. Osburn. 2005. The role of iron and dissolved organic carbon in the absorption of ultraviolet radiation in humic lake water. Biogeochemistry 75:393–407.
- Mayewski, P. A., S. B. Sneed, S. D. Birkel, A. V. Kurbatov, and K. A. Maasch. 2014. Holocene warming marked by abrupt onset of longer summers and reduced storm frequency around Greenland. Journal of Quaternary Science 29 (1):99–104.
- Mernild, S. H., B. Hasholt, A. C. Tidwell, and D. L. Kane. 2008. Jökulhlaup observed at Greenland ice sheet. Eos 89 (165):161–72.
- Miller, W. L., and M. A. Moran. 1997. Interaction of photochemical and bacterial processes in the degradation of refractory dissolved organic matter from a coastal marine environment. Limnology and Oceanography 42 (6):1317–24.
- Mladenov, N., R. Sommaruga, R. Morales-Baquero, I. Laurion, L. Camarero, M. C. Diéguex, A. Camacho, A. Delgado, O. Torres, Z. Chen, et al. 2011. Dust inputs and bacteria influence dissolved organic matter in clear alpine lakes. Nature Communications 2:405. doi:https://doi.org/10.1038/ncomms1411.
- Mladenov, N., M. W. Williams, S. K. Schmidt and K. Cawley. 2012. Atmospheric deposition as a source of carbon and nutrients to an alpine catchment of the Colorado Rocky Mountains. Biogeosciences 9:3337–55.
- Moran, M. A., S. M. Wade, and R. G. Zepp. 2000. Carbon loss and optical property changes during long-term photochemical and biological degradation of estuarine dissolved organic matter. Limnology and Oceanography 45 (6):1254–64.
- Morris, D. P., and B. R. Hargreaves. 1997. The role of photochemical degradation of dissolved organic carbon in regulating the UV transparency of three lakes on the Pocono Plateau. Limnology and Oceanography 42 (2):239–49.
- Obernosterer, I., and R. Benner. 2004. Competition between biological and photochemical processes in the mineralization of dissolved organic carbon. Limnology and Oceanography 49 (1):117–24.
- Ogawa, H., Y. Amagai, I. Koike, K. Kaiser, and R. Benner. 2001. Production of refractory dissolved organic matter by bacteria. Science 292 (5518):917–20.
- Osburn, C. L., N. J. Anderson, C. A. Stedmon, M. E. Giles, E. J. Whiteford, T. J. McGenity, A. J. Dumbrell, and G. J. C. Underwood. 2017. Shifts in the source and composition of dissolved organic matter in southwest Greenland lakes along a regional hydro-climatic gradient. Journal of Geophysical Research: Biogeosciences 122. doi:https://doi.org/10.1002/2017JG003999.
- Osburn, C. L., D. P. Morris, K. A. Thorn, and R. E. Moeller. 2001. Chemical and optical changes in freshwater dissolved organic matter exposed to solar radiation. Biogeochemistry 54:251–78.
- Peacock, M., C. Freeman, V. Gauci, I. Lebron, and C. D. Evans. 2015. Investigations of freezing and cold storage for analysis of peatland dissolved organic carbon (DOC) and absorbance properties. Environmental Science: Processes and Impacts 17:1290–301.
- Prospero, J. M., J. E. Bullard, and R. Hodgkins. 2012. High-latitude dust over the North Atlantic: Inputs from Icelandic proglacial dust storms. Science 335 (6072):1078–82.
- R Development Core Team. 2016. R: A language and environment for statistical computing. Vienna, Austria: R Foundation for Statistical Computing. http://www.R-project.org.
- Saros, J. E., C. L. Osburn, R. M. Northington, S. D. Birkel, J. D. Auger, C. A. Stedmon, and N. J. Anderson. 2015. Recent decrease in DOC concentrations in Arctic lakes of southwest Greenland. Geophysical Research Letters 42 (16):6703–9.
- Shapiro, J. 1966. On the measurement of ferrous iron in natural waters. Limnology & Oceanography 11 (2):293–98.
- Sobek, S., L. J. Tranvik, Y. T. Prairie, P. Kortelainen, and J. J. Cole. 2007. Patterns and regulation of dissolved organic carbon: An analysis of 7,500 widely distributed lakes. Limnology and Oceanography 52 (3):1208–19.
- Spencer, R. G. M., G. R. Aiken, K. D. Butler, M. M. Dornblaser, R. G. Striegl, and P. J. Hernes. 2009. Utilizing chromophoric dissolved organic matter measurements to derive export and reactivity of dissolved organic carbon exported to the Arctic Ocean: A case study of the Yukon River, Alaska. Geophysical Research Letters 36:L06401. doi:https://doi.org/10.1029/2008GL036831.
- Stockner, J. G., and N. J. Antia. 1986. Algal picoplankton from marine and freshwater ecosystems: A multidisciplinary perspective. Canadian Journal of Fisheries and Aquatic Sciences 43 (12):2472–503.
- Striegl, R. G., G. R. Aiken, M. M. Dornblaser, P. A. Raymond, and K. P. Wickland. 2005. A decrease in discharge-normalized DOC export by the Yukon River during summer through autumn. Geophysical Research Letters 32:L21413. doi:https://doi.org/10.1029/2005GL024413.
- Strock, K. E., J. E. Saros, S. J. Nelson, S. D. Birkel, J. S. Kahl, and W. H. McDowell. 2016. Extreme weather years drive episodic changes in lake chemistry: Implications for recovery from sulfate deposition and long-term trends in dissolved organic carbon. Biogeochemistry 127 (2):353–65.
- Tipping, E. 1981. The adsorption of aquatic humic substances by iron oxides. Geochimica Et Cosmochimica Acta 45:191–99.
- van As, D., M. L. Andersen, D. Petersen, X. Fettweis, J. H. van Angelen, J. Lenaerts, M. R. van den Broeke, J. M. Lea, C. E. Bøggild, A. P. Ahlstrøm, et al. 2014. Increasing meltwater discharge from the Nuuk region of the Greenland ice sheet and implications for mass balance (1960–2012). Journal of Glaciology 60 (220):314–22.
- Weishaar, J. L., G. R. Aiken, B. A. Bergamaschi, M. S. Fram, R. Fujii, and K. Mopper. 2003. Evaluation of specific ultraviolet absorbance as an indicator of the chemical composition and reactivity of dissolved organic carbon. Environmental Science and Technology 37 (20):4702–8.
- Williams, C. J., Y. Yamashita, H. F. Wilson, R. Jaffé, and M. A. Xenopoulos. 2010. Unraveling the role of land use and bacterial activity in shaping dissolved organic matter characteristics in stream ecosystems. Limnology and Oceanography 55 (3):1159–71.
- Williamson, C. E., D. P. Morris, M. L. Pace, and O. G. Olson. 1999. Dissolved organic carbon and nutrients as regulators of lake ecosystems: Resurrection of a more integrated paradigm. Limnology and Oceanography 44 (3, Part 2):795–803.
- Williamson, C. E., J. E. Saros, W. F. Vincent, and J. P. Smol. 2009. Lakes and eservoirs as sentinels, integrators, and regulators of climate change. Limnology and Oceanography 54 (6, Part 2):2273–82.