
ABSTRACT
Climate warming has induced significant changes in permafrost and seasonally frozen ground (SFG) in the Tibetan Plateau, which have complex influences on local environments. A better understanding of the impacts of soil freeze/thaw (F/T) dynamics on soil water transfer and vegetation growth is important to explore related eco-hydrological influences. We investigated soil F/T dynamics and their impacts with in-situ and satellite-based observations. Our results showed the contrasting F/T dynamics between SFG and permafrost areas. In permafrost areas, soil froze downward from the ground surface and upward from the active layer bottom with a distinct freezing zero-curtain, and minimum soil moisture occurred in the intermediate layer, but the thawing process was unidirectional. However, the vertical F/T directions were contrary in SFG areas, where soil moisture generally increased with depth and the thawing zero-curtain was distinct. The spring onset showed a positive correlation with thaw onset in permafrost areas, but such a correlation was variable in SFG areas likely depending on soil-moisture level. Our results implied that the different soil-moisture patterns and the varying vegetation response might be related to the spatially contrasting F/T dynamics, which may have different impacts on soil water transfer, and further affect the zero-curtain and vegetation phenology.
Introduction
The Tibetan Plateau (TP) has the largest areas of permafrost and seasonally frozen ground (SFG) in the mid- and low-latitude regions of the world because of its high terrain (Zhao et al. Citation2010; Zou et al. Citation2017). The TP is the source of several major Asian rivers, where the permafrost and SFG exert an important role in water fluxes and flow paths, and have profound influences on hydrological processes and the regional water cycle. The TP has a much warmer climate than the Arctic, so the permafrost and SFG in the TP are more susceptible to current climate change (Guo, Wang, and Li Citation2012; Wu and Zhang Citation2008; Yang et al. Citation2010).
Climate warming has induced significant changes in both permafrost and SFG areas throughout most Arctic and Alpine regions (Jones et al. Citation2016; Schaefer et al. Citation2014; Xue et al. Citation2009; Yi et al. Citation2018, Citation2015), including increases in active layer thickness, decreases in maximum frozen depth, and permafrost degradation (Sazonova and Romanovsky Citation2003). In the TP, surface soil temperature in some permafrost areas has experienced an increase of 0.6°C per decade from 1980 to 2005 (Xue et al. Citation2009), and the lower altitudinal limit of permafrost has moved up, although the moving speed varies regionally (Cheng and Wu Citation2007). Furthermore, the active-layer thickness has become deeper in the TP, and it is projected to increase by 0.5–1.0 m in the next twenty years (Guo, Wang, and Li Citation2012; Pang et al. Citation2009). The seasonally frozen depth in SFG areas is also undergoing remarkable changes, and maximum frozen depth in the central TP decreased at a rate of 0.71 cm per year during the period of 1970–2000 (Zhao et al. Citation2004). These changes in permafrost and SFG have strong influences on local ecological and hydrological processes. Therefore, it is necessary to understand the soil freeze/thaw (F/T) dynamics and their interaction with environmental conditions in the TP region.
The F/T processes that redistribute soil moisture are complex in the regions affected by seasonal and permafrost frozen conditions. The F/T processes could redistribute soil moisture by affecting soil water movement. During freezing and thawing periods, soil water tends to migrate to colder layers under the control of soil temperature gradient (Perfect and Williams Citation1980), which may change the thermal and hydrological properties of soil layers. Moreover, oscillations in the soil thermal regime and the corresponding high frequency of F/T cycles in some permafrost areas would affect the exchange of energy and water between land surface and atmosphere (Guo, Yang, and Wang Citation2011a, Citation2011b; Yang et al. Citation2007), which further influence regional vegetation coverage (Chen et al. Citation2016). Soil moisture, in turn, influences subsurface soil physical properties, vegetation growth, and energy exchange process (Hinkel et al. Citation2001; Pellet et al. Citation2016). For example, in regions with thick snow cover, increases in soil-moisture content caused by meltwater infiltration would result in soil temperature fluctuation during thawing periods (Scherler et al. Citation2010). In some Arctic tundra areas, precipitation would control the partitioning of available energy via the soil-moisture regime (Boike, Wille, and Abnizova Citation2008), and then influence the soil F/T processes. However, the impacts of F/T dynamics on soil moisture and vegetation growth were compared less between permafrost and SFG in the TP. Previous studies about F/T dynamics and their influences in the TP mostly focused on permafrost area (Chen et al. Citation2016; Jin et al. Citation2008; Wang et al. Citation2002; Yang et al. Citation2007), while the changes in SFG were relatively less investigated (Guo and Wang Citation2013, Citation2014; Zhao et al. Citation2004). Because the soil F/T processes may exhibit contrasting dynamics in permafrost and SFG areas, the interactions between F/T dynamics and soil-moisture transfer as well as vegetation conditions are likely different.
In this study, we aimed to investigate the impacts of soil F/T dynamics on soil water transfer and vegetation spring phenology in the TP. The different soil F/T dynamics were compared between the permafrost and SFG areas using multiple in situ observations. Then, the impacts of soil F/T on soil-moisture transfer and vegetation spring phenology were explored by integrating in situ observations and satellite vegetation index data. Our study aimed to provide a better understanding about the interactions between soil F/T dynamics and environmental variables in the TP.
Data and methods
Study area and datasets
The region along Qinghai-Tibet Railway (QTR) in the central TP was used as the study area (). This region is above 4,000 m and is dominated by Alpine grasslands and meadows (Jin et al. Citation2008). The prevalence of the east Asian and Indian monsoons results in the cold and arid climate in this region (Yao et al. Citation2012). Annual mean air temperature in the study area ranges from −5.5°C to 7.8°C (Li et al. Citation2003), while annual precipitation varies from 306.6 mm at Wudaoliang to 472.6 mm at Dangxiong, and precipitation mainly occurs during summer.
Figure 1. The terrain (A) and permafrost distribution (B) of the study area. Inset small panels in (A) and (B) showed the location of the study area and the CTP-SMTMN sites, respectively. The high and low in (B) refers to the ice content of the permafrost
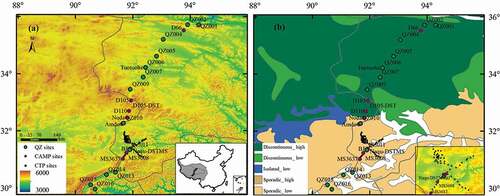
In situ data of soil moisture and temperature were used to reflect soil heat and water transfer in this study, which were observed by the CEOP (Coordinated Enhanced Observing Period) Asia-Australia Monsoon Project sites within the TP domain (CAMP-Tibet, 1997–2007, 4–270 cm; Ma et al. Citation2003), the China Meteorological Administration (CMA-QZ, 2009–2015, 10–320 cm), and the Central Tibetan Plateau Soil Moisture and Temperature Monitoring Network (CTP-SMTMN, 2010–2014, 5–40 cm; Yang Citation2013).
The CAMP-Tibet network consisted of eleven sites, including two relatively deep observations (D105-DST and Naqu-DST). These sites spanned from D66 in a permafrost area to MS3637 in an SFG area along the QTR. The soil types for these sites are shown in . The CMA-QZ network was set to monitor the permafrost and SFG along the QTR, which spanned from Yuzhu Mt. (QZ001) in the north to Deqing (QZ016) in the south (). Soil temperature in this network was measured at ten depths (10, 20, 40, 60, 80, 100, 120, 160, 180, and 320 cm) during the period 2009–2015, while the soil-moisture data was unavailable. The CTP-SMTMN consisted of fifty-six sites in a 1.0 × 1.0° region around Naqu. Soil moisture and temperature were measured at four depths (5, 10, 20, and 40 cm) during the period 2011–2014. The soil moisture used in this study was unfrozen water content measured by TDR. The observations at CAMP-Tibet and CMA-QZ networks with larger longitudinal range and deeper soil layers were used to analyze the soil F/T dynamics in permafrost and SFG areas, while data from CTP-SMTMN sites were used to explore the spatial heterogeneity of interaction between upper soil thawing and vegetation phenology.
Table 1. Characteristics of the CAMP-Tibet sites (DST = deep soil temperature measurement system)
Table 2. Locations and altitudes of the CMA-QZ sites
The enhanced vegetation index (EVI) from the Moderate Resolution Imaging Spectroradiometer (MODIS) was sensitive to vegetation growth (Sims et al. Citation2006), so it was used to extract vegetation spring onset for sites in the study area. The MODIS product of MOD13Q1 (v005) provides EVI at 250-m resolution and sixteen-day compositing in the period from 2000 to 2016. The EVI uses the blue band to remove residual atmosphere contamination caused by smoke and subpixel thin clouds, and it minimizes canopy background variations and maintains sensitivity across dense vegetation conditions. This product has been successfully used to analyze vegetation spring phenology despite some uncertainties in the dataset (Arantes, Ferreira, and Coe Citation2016; Li et al. Citation2014).
Methods
Estimating soil F/T variables
We used the following variables to describe soil F/T dynamics in this study, including F/T onsets, zero-curtain periods, maximum frozen depth, active-layer thickness, and rates of F/T lags. Annual soil freeze (thaw) onset was defined as the first day when the soil temperature of a five-day moving window dropped below (or raised above) the freezing point. Considering the influence of observation error, we selected different freezing points (approximately ±0.2°C), depending on the site-specific conditions, to calculate F/T onsets. Maximum frozen depth was calculated through linearly interpolating the soil-temperature time series of the soil profile and identifying the deepest soil layer dropping to a threshold of 0°C during the entire year, while active-layer thickness was estimated by identifying the annual deepest layer raising above 0°C. The rate of vertical F/T lag (in day cm−1) was defined as the value of F/T lag (in days) between two continuous layers divided by their depth, and zero-curtain (days) was calculated as the period when the soil temperature remained in the limited range close to 0°C (approximately ±0.2°C). Then, the associations between zero-curtain length and soil-moisture content (averaged across the fifteen days before frozen onset and the zero-curtain period) were further examined.
Detecting vegetation spring phenology
Vegetation spring onsets at the study sites were detected from the time series of MODIS EVI using a threshold-based method (Wang et al. Citation2017). Spring onset was defined as the day during the first half of a year when the EVI increased above the threshold. The threshold was determined as a percentage of annual EVI amplitude, which generally varied between 20 percent and 40 percent. The threshold of 35 percent of annual EVI amplitude has been shown to efficiently detect spring onset in the TP grasslands (Zhang et al. Citation2015), so we adopted this threshold for the detection of spring onset in this study.
Before onset detection, we preprocessed EVI data so as to reduce the influences of data uncertainties. We averaged EVI over a window of 3 × 3 pixels (with the site located in the central pixel) at each CAMP-Tibet and CMA-QZ site, and then removed the abnormal value that was extremely low (usually lower than 0). Considering that CTP-SMTMN contained a larger number of sites (54) in a relatively small area (1.0 × 1.0°), we filtered the EVI time series using the double logistic method to remove outliers and fill data gaps (Jönsson et al. Citation2010) at these sites. A linear regression method was used to examine the correlation between thaw onset and spring onset at site-specific locations. To better understand the relationship between spring phenology and soil F/T cycles, we further examined the variation of the correlations between spring onset and thaw onset with soil moisture using the observations from CTP-SMTMN. We first sorted the CTP-SMNTM sites in ascending soil moisture, and then used a fifteen-site moving correlation method to examine the impact of soil moisture (0–40 cm) on the relationship of spring onset and soil-thaw onset (5 cm).
Results
Contrasting F/T characteristics between SFG and permafrost areas
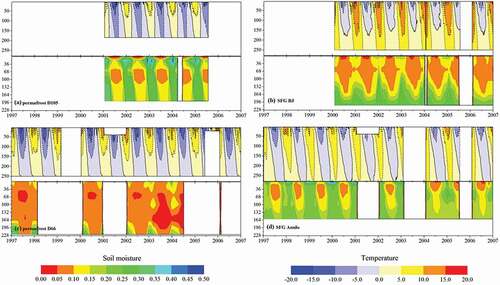
The in situ observations of soil temperature reflected that the study area was underlain by permafrost in the north ( and ) and SFG in the south ( and ). Maximum frozen depths in the SFG area varied from 1.4 m to 2.6 m, as shown in . Multiyear averaged active-layer thicknesses were 2.37 ± 0.01 m at PF-D105-DST (the prefix PF- means that this is a permafrost site) and 2.97 ± 0.04 m at PF-QZ005, while the permafrost table was deeper than observation depth at other permafrost sites. Observed liquid soil moisture showed different patterns between sites underlain by permafrost and SFG (). Unfrozen liquid soil moisture increased with soil depth during the freezing period at SFG sites ( and ). However, at permafrost sites liquid soil water decreased to the annual lowest level because of phase change, and the vertical minimum level of liquid soil water occurred at the intermediate layer of the soil column ( and ).
Table 3. Annual averaged MFD or ALT (mean ± SD) at the observation sites
Figure 2. Soil temperature and moisture observed at the D105 (A), BJ (B), D66 (C), and Amdo (D) sites during the period 1997.7–2007.7. The black solid line refers to the 0°C isotherm and the y-axis refers to soil depth (cm)
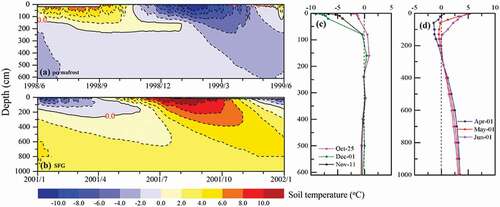
The freeze and thaw onsets respectively showed overall advancing and delaying trends with increasing latitude (); however, there were some differences in F/T onsets between permafrost and SFG areas. At SFG sites (left side of the dashed line in ), soil layers generally thawed at similar times but froze at different times across soil layers. In contrast, the freeze onsets at permafrost sites (right side of the dashed line in ) were similar between soil layers, while thaw onsets were different. The F/T lag rates also exhibited different patterns. The freeze lag rates in SFG areas likely became larger with depth, but the thaw lag rates were smaller in deep layers, which indicated increasingly later freezing but earlier thawing in deeper layers (). However, in permafrost areas, the F/T lag rates were contrary to the situation in SFG areas (), which implies that deeper layers freeze earlier but thaw later. The contrasting F/T lag rates in SFG and permafrost areas indicate different soil F/T dynamics, as shown in . The soil at both the surface and bottom of the active layer (around 2.0 m) at the PF-D105-DST site began to freeze in the middle of October (), which implies that the soil column froze downward from the ground surface and upward from the bottom of the active layer almost simultaneously ( and ), while the thawing process was in a unidirectional manner. In contrast, at the SFG-Naqu-DST site (the prefix SFG- means that this is a seasonally frozen ground site; and ), the soil layer at around 1 m was still frozen when surface and lower (approximately 2.00 m) soil layers began to thaw.
Figure 3. Averaged freeze/thaw onsets (DOY) at CAMP-Tibet (A) and QZ (B) sites (in ascending latitude) during the observational period. The different color of the lines in panels (A) and (B) indiate the soil layer depth; for example, L10 means soil layer at 10 cm depth. Panels (C) and (D) are the rates of F/T lag (day cm−1) in SFG and permafrost areas, respectively. The x-axis in (C) and (D) refers to the soil layers
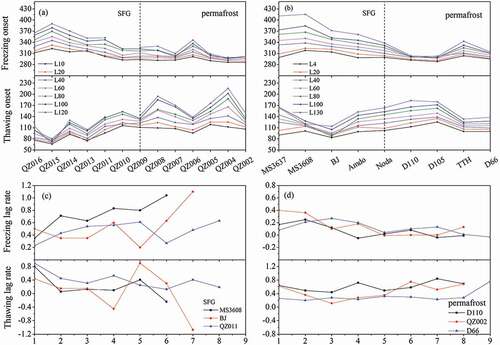
Figure 4. The bidirectional freezing process observed at the D105_DST site underlain by permafrost (A and C, 1998.6–1999.5), and bidirectional thawing process observed at the Naqu-DST site underlain by SFG (B and D, 2001.1–2001.12). Panels (A) and (B) describe the temporal variations in soil temperature profile, and panels (C) and (D) indicate the profiles of soil temperature for seasonally representative days. The black solid line in panels (A) and (B) denotes the 0°C isotherm
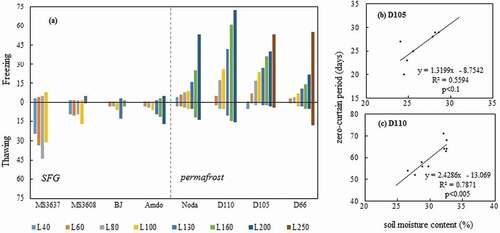
The zero-curtain period was distinct at the soil layers below 40 cm during F/T periods; however, it behaved differently between sites underlain by permafrost and SFG (). At permafrost sites (right side of the dashed line), a distinct zero-curtain period was observed during the freezing period with the maximum-thawing zero-curtain sustained for nearly two months, while the thawing zero-curtain was much shorter (approximately ten days). The temporal pattern of the zero-curtain period at SFG sites (left side of the dashed line) was contrary to that at the permafrost sites. The zero-curtain during the thawing period would persist longer, and the maximum-thawing zero-curtain period sustained for nearly forty days, while the freezing zero-curtain was shorter than ten days. The close correlation between soil moisture and zero-curtain length at the PF-D110 (R = 0.89, p < 0.005) and the PF-D105 (R = 0.75, p < 0.1) suggested that the zero-curtain period was likely related to the level of liquid soil water content (). Observations showed that the zero-curtain period would become longer by 1.3 and 2.4 days with a 1 percent increase in soil moisture at PF-D105 and PF-D110 sites, respectively. Moreover, the SFG-BJ site in the SFG area did not show the distinct zero-curtain period, likely because of low soil-moisture content ().
Figure 5. Length of averaged freezing and thawing zero-curtain (days) at the CAMP-Tibet sites (A), and the correlation between the freezing zero-curtain length and unfrozen liquid soil moisture at the D105 site (B) (100 ~ 130 cm) and the D110 site (C) (160 ~ 180 cm). The soil moisture was averaged over the fifteen days before freeze onset and the zero-curtain period. The deepest soil layers at the D110 and D105 sites were 1.80 m and 1.85 m, respectively
Link between soil-thaw onset and vegetation spring phenology
Satellite-based EVI showed that spring onsets ranged from DOY (day of year) 140 to 170 across the study sites. The correlation between vegetation spring onset and upper-soil-thaw onset was largely dependent on site-specific conditions (). At permafrost sites, vegetation spring onset exhibited a positive correlation with soil-thaw onset (, R = 0.46 ~ 0.68, p = 0.028 ~ 0.4), although the thaw onset was estimated at 4 cm for CAMP-Tibet sites and 10 cm for CMA-QZ sites. This suggested that vegetation spring onset would be later when the thawing of the surface soil layer was delayed. However, the vegetation spring revival showed a varying response to soil-thaw onset at SFG sites (). Spring onset showed a negative correlation with soil thawing at the SFG-Amdo (R = −0.78, p = 0.12) and SFG-QZ010 (R = −0.66, p = 0.15) sites, which indicated that spring onset tended to advance moderately with later soil-thaw onset. In contrast, spring onset was positively correlated with thaw onset at the SFG-BJ (R = 0.72, p = 0.11) and SFG-QZ013 (R = 0.78, p = 0.10) sites, which meant that vegetation spring revival would likely become later with delayed thaw onset. However, vegetation spring onset showed nonsignificant correlations with the observed soil-thaw onset at other SFG sites.
Figure 6. Correlations between spring onset and surface soil-thaw onset in permafrost (A) and SFG areas (B). Thaw onset was derived from observed upper soil temperature at CAMP-Tibet sites (4 cm, 1997–2007) and QZ sites (10 cm, 2009–2015) with some data missing, and spring onset was derived from the MODIS EVI. The spring onset derived from EVI was consistent with the thaw onset at the specific site
Results from the CTP-SMTMN sites underlain by SFG showed that vegetation spring onset had a variable response to soil thawing under different in situ soil-moisture levels (). In an arid environment, vegetation spring onset was positively correlated with thaw onset. However, such links become increasingly weaker with an increase in soil-moisture content. In a wetter environment, spring onset even showed a significantly negative correlation with soil-thaw onset. These correlations from the CTP-SMTMS sites coincided with the results from CAMP-Tibet sites, which are shown in . Spring onset showed a positive correlation with soil thawing at the arid site SFG-BJ, where the annual average spring moisture content in the upper soil layer (0 ~ 60 cm) was approximately 10 percent (). However, spring revival was negatively correlated with soil-thaw onset at the SFG-Amdo site (), where the spring liquid soil-moisture level (~16%) was higher than at the SFG-BJ site ().
Figure 7. Variation of correlation coefficients between spring onset and soil-thaw onset (averaged from 2011 to 2014, except 2013) at CTP-SMTMN sites. The dashed line denotes p < 0.10
Discussion
Impact of F/T dynamics on soil water migration and zero-curtain period
The contrasting soil F/T dynamics in SFG and permafrost areas shown in this study likely had varying impacts on vertical soil water migration, which may result in different soil-moisture conditions in upper layers. In permafrost areas, soil froze simultaneously downward from the surface and upward from the bottom of the active layer, but the freezing process only started downward from the ground surface in SFG areas. During freezing periods, there was little precipitation-caused soil-moisture infiltration or evaporation-caused soil water migration; instead, soil-moisture movement was influenced more by temperature gradients (Zhao et al. Citation2000). Soil water tends to migrate toward colder layers (i.e., the freezing front) under the control of temperature gradient (Perfect and Williams Citation1980). Therefore, soil water in permafrost areas likely moved from the intermediate layers to the ground surface and the bottom of active layer, and this process may result in a minimum level of soil moisture in the middle of the soil column (). However, as the freezing front penetrated downward unidirectionally in SFG areas, unfrozen water moved toward the freezing front, so soil-moisture content would increase along with soil depth. During the soil-thawing process, soil water migration would be more complex. Liquid soil water could infiltrate under gravity, move upward driven by surface evaporation, or move toward the thawing front. Moreover, soil water migration was also influenced by site-specific conditions such as soil type and vegetation cover (Harlan Citation1973; Wang et al. Citation2009).
The movements in soil moisture, in turn, would also influence F/T characteristics. The soil layer in SFG areas was drier during the freezing period, because the soil water that was recharged by precipitation was easily drained away. In addition, the soil-moisture migration was less in SFG areas than in permafrost areas because soil froze downward from the surface unidirectionally. The relatively low soil water content may explain the limited freezing zero-curtain period at SFG sites (). However, during the thawing period, increases in evaporation may result in water loss from surface soil, while some water could still be retained in the middle and deep soil layers because of water infiltration and migration. Therefore, zero-curtain was more obvious during thawing periods than freezing periods in deep layers in SFG areas.
The zero-curtain may also be affected by other factors besides soil moisture, such as heat conduction. In SFG areas, the soil temperature of the intermediate layers was lower than in the upper and lower layers of the soil column during thawing periods, so heat tended to be transferred from the two thawing fronts to the middle layers. This process would result in a relatively low thermal gradient in the soil column, which was beneficial to the development of the thawing zero-curtain in SFG areas. However, in permafrost areas soil froze simultaneously downward from the surface and upward from the bottom of the active layer during the freezing period, so the active layer was like a closed system with heat only released through two vertical boundary layers; that is, the two freezing fronts (Luo et al. Citation2014). Soil temperature was higher in the middle of the active layer, so the thermal gradient was smaller than that in the thawing period. Then, the heat was dominantly transferred through the hydrothermal coupling process (Outcalt, Nelson, and Hinkel Citation1990; Zhao et al. Citation2000), which caused the release of latent heat. Therefore, a prolonged freezing zero-curtain period was generally observed at permafrost sites. Previous studies also found that a zero-curtain period trended to be relatively longer during the freezing period than during the thawing process at permafrost sites, likely because of the different ways of heat transfer (Hinkel et al. Citation2001; Luo et al. Citation2014).
Effects of soil moisture on the link between vegetation spring onset and soil-thaw onset
The surface soil F/T cycles in permafrost and SFG affected soil hydrological and nutritional conditions, which would influence surface vegetation cover and plant community and productivity (Wang et al. Citation2008). Our results showed that vegetation spring onset was positively correlated with surface-soil thaw onset in permafrost areas, while in SFG areas it showed variable responses to soil-thaw onset depending on in situ soil-moisture level. Soil-thaw onset was mainly driven by soil temperature, while the vegetation spring revival was not only influenced by temperature but also affected by other factors, such as soil water content. Previous studies indicated the important role of soil moisture in the response of spring phenology to climate change (Cong et al. Citation2013; Dorji et al. Citation2013; Shen et al. Citation2015; Zhang et al. Citation2015). Specifically, spring phenology in Alpine regions (e.g., the TP) likely responds more sensitively to climate changes (Zhang et al. Citation2015). Therefore, the variations in spring temperature and soil water content could both induce changes in vegetation spring onset.
The interaction between soil F/T dynamics and soil moisture in permafrost and SFG areas may impact spring vegetation growth, which may partially explain the variable correlation between soil-thaw onset and spring onset. In this study, we found that vegetation spring onset showed a positive correlation with soil-thaw onset at drier SFG sites. However, this correlation gradually became nonsignificant and even negative with increasing soil moisture. A high level of soil moisture at some sites may result in fluctuation of surface soil temperature during thawing periods (Scherler et al. Citation2010). Therefore, surface temperature would not increase significantly even though soil began to thaw, and vegetation spring revival would still be limited by surface heat condition. This probably could explain the negative correlation between spring onset and soil-thaw onset. However, at arid sites surface temperature may increase rapidly after thaw onset because of the relatively lower frequency and shorter duration of soil water phase transition. Increasing spring temperatures provided the necessary heat and thawing water for vegetation revival, so spring onset was positively correlated with soil-thaw onset at arid sites. Moreover, the positive correlation between spring onset and thaw onset at permafrost sites may also partially be ascribed to the shorter phase transition during the thawing period than during the freezing period. In addition to soil moisture and soil F/T dynamics, vegetation spring growth was also influenced by other factors, such as surface precipitation and evapotranspiration. Increasing temperatures not only melted the ice in the soil but also exacerbated the evaporation at the sites underlain by permafrost and SFG (Wang et al. Citation2012; Yu et al. Citation2003). There were still some differences in evapotranspiration among these sites, likely affecting the correlation between vegetation spring onset and soil-thaw onset, where spring precipitation was generally limited and showed negligible differences.
Conclusion
In this study, we used in situ observations of soil temperature and moisture as well as the MODIS EVI to analyze the soil F/T dynamics in permafrost and seasonally frozen ground areas, and to investigate their potential impacts on soil-moisture migration and vegetation spring phenology. Our results showed contrasting soil F/T dynamics in SFG areas along the southern Qinghai-Tibet Railway and permafrost areas in the north. In SFG areas, soil froze downward from the ground surface during the fall, but the thawing process started both upward from the deep soil layer and downward from the ground surface. A distinct zero-curtain period was observed in SFG areas during the spring thawing period. In contrast, soil froze both downward from the surface and upward from the deep layer with a distinct freezing zero-curtain in permafrost areas, while soil thawed only downward from the ground surface in the spring. Our results also indicated different soil-moisture patterns between these two areas. Soil moisture in the SFG area generally increased with soil depth, while the vertical minimum level of soil moisture occurred in the intermediate zone of the soil column in the permafrost area. The different patterns of soil moisture might be attributed to the contrasting soil F/T dynamics, because the soil water tended to move toward the cold layer under the control of temperature gradient. The vegetation spring onset derived from MODIS data showed positive correlation with the in situ observed soil-thaw onset in permafrost areas, while in SFG areas it showed a more variable response to soil-thaw onset depending on in situ soil-moisture levels. Our study indicates a complex relationship among soil F/T processes, soil moisture, and vegetation growth in the TP frozen ground. Contrasting soil F/T dynamics may have varying impacts on soil water transfer, while soil moisture, in turn, would influence the soil freezing and thawing processes through affecting the zero-curtain period and vegetation response to soil thawing. Our study highlights the importance of soil moisture in affecting F/T cycles and understanding the links between environmental variables and soil F/T dynamics in the TP.
Additional information
Funding
Related Research Data
References
- Arantes, A. E., L. G. Ferreira, and M. T. Coe. 2016. The seasonal carbon and water balances of the Cerrado environment of Brazil: Past, present, and future influences of land cover and land use. Isprs Journal of Photogrammetry and Remote Sensing 117:1–11.
- Boike, J., C. Wille, and A. Abnizova. 2008. Climatology and summer energy and water balance of polygonal tundra in the Lena River Delta, Siberia. Journal of Geophysical Research 113:G03025.
- Chen, S., W. Liu, Q. Zhao, L. Zhao, Q. Wu, X. Lu, S. Kang, X. Qin, S. Chen, J. Ren et al., 2016. Response of freeze-thaw processes to experimental warming in the permafrost regions of the central Qinghai-Tibet Plateau. The Cryosphere Discussions 1–24. doi:https://doi.org/10.5194/tc-2016-80.
- Cheng, G., and T. Wu. 2007. Responses of permafrost to climate change and their environmental significance, Qinghai-Tibet Plateau. Journal of Geophysical Research 112:F02S03.
- Cong, N., T. Wang, H. Nan, Y. Ma, X. Wang, R. B. Myneni, and S. Piao. 2013. Changes in satellite-derived spring vegetation green-up date and its linkage to climate in China from 1982 to 2010: A multimethod analysis. Global Change Biology 19:881–91.
- Dorji, T., Ø. Totland, S. R. Moe, K. A. Hopping, J. Pan, and J. A. Klein. 2013. Plant functional traits mediate reproductive phenology and success in response to experimental warming and snow addition in Tibet. Global Change Biology 19:459–72.
- Guo, D., and H. Wang. 2013. Simulation of permafrost and seasonally frozen ground conditions on the Tibetan Plateau, 1981–2010. Journal of Geophysical Research-Atmospheres 118:5216–30.
- Guo, D., and H. Wang. 2014. Simulated change in the near-surface soil freeze/thaw cycle on the Tibetan Plateau from 1981 to 2010. Chinese Science Bulletin 59:2439–48.
- Guo, D., H. Wang, and D. Li. 2012. A projection of permafrost degradation on the Tibetan Plateau during the 21st century. Journal of Geophysical Research: Atmospheres 117:D05106.
- Guo, D., M. Yang, and H. Wang. 2011a. Characteristics of land surface heat and water exchange under different soil freeze/thaw conditions over the central Tibetan Plateau. Hydrological Processes 25:2531–41.
- Guo, D., M. Yang, and H. Wang. 2011b. Sensible and latent heat flux response to diurnal variation in soil surface temperature and moisture under different freeze/thaw soil conditions in the seasonal frozen soil region of the central Tibetan Plateau. Environmental Earth Sciences 63:97–107.
- Harlan, R. L. 1973. Analysis of coupled heat-fluid transport in partially frozen soil. Water Resources Research 9:1314–23.
- Hinkel, K. M., F. Paetzold, F. E. Nelson, and J. G. Bockheim. 2001. Patterns of soil temperature and moisture in the active layer and upper permafrost at Barrow, Alaska: 1993–1999. Global and Planetary Change 29:293–309.
- Jin, H., Q. Yu, S. Wang, and L. Lü. 2008. Changes in permafrost environments along the Qinghai–Tibet engineering corridor induced by anthropogenic activities and climate warming. Cold Regions Science and Technology 53:317–33.
- Jones, B. M., C. A. Baughman, V. E. Romanovsky, A. D. Parsekian, E. L. Babcock, E. Stephani, M. C. Jones, G. Grosse, and E. E. Berg. 2016. Presence of rapidly degrading permafrost plateaus in south-central Alaska. The Cryosphere 10:2673–92.
- Jönsson, A. M., L. Eklundh, M. Hellström, L. Bärring, and P. Jönsson. 2010. Annual changes in MODIS vegetation indices of Swedish coniferous forests in relation to snow dynamics and tree phenology. Remote Sensing of Environment 114:2719–30.
- Li, D., H. Guo, W. Wang, and L. Wei. 2003. Prediction of annual average temperature change along Qinghai-Xizang railway. Plateau Meteorology 22:431–39.
- Li, G., X. Li, G. Zhao, Z. Zhang, and Y. Li. 2014. Characteristics of spatial and temporal phenology under the dynamic variation of grassland in the Qinghai Lake watershed. Acta Ecologica Sinica 34:3038–47.
- Luo, D., H. Jin, L. Lü, and Q. Wu. 2014. Spatiotemporal characteristics of freezing and thawing of the active layer in the source areas of the Yellow River (SAYR). Chinese Science Bulletin 59:3034–45.
- Ma, Y. M., Z. B. Su, T. Koike, T. D. Yao, H. Ishikawa, K. Ueno, and M. Menenti. 2003. On measuring and remote sensing surface energy partitioning over the Tibetan Plateau: From GAME/Tibet to CAMP/Tibet. Physics and Chemistry of the Earth 28:63–74.
- Outcalt, S. I., F. E. Nelson, and K. M. Hinkel. 1990. The zero-curtain effect: Heat and mass transfer across an isothermal region in freezing soil. Water Resources Research 26:1509–16.
- Pang, Q., G. Cheng, S. Li, and W. Zhang. 2009. Active layer thickness calculation over the Qinghai–Tibet Plateau. Cold Regions Science and Technology 57:23–28.
- Pellet, C., C. Hilbich, A. Marmy, and C. Hauck. 2016. Soil moisture data for the validation of permafrost models using direct and indirect measurement approaches at Three Alpine Sites. Frontiers in Earth Science 3:1–21.
- Perfect, E., and P. J. Williams. 1980. Thermally induced water migration in frozen soils. Cold Regions Science and Technology 3:101–9.
- Sazonova, T. S., and V. E. Romanovsky. 2003. A model for regional-scale estimation of temporal and spatial variability of active layer thickness and mean annual ground temperatures. Permafrost and Periglacial Processes 14:125–39.
- Schaefer, K., H. Lantuit, V. E. Romanovsky, E. A. G. Schuur, and R. Witt. 2014. The impact of the permafrost carbon feedback on global climate. Environmental Research Letters 9:085003.
- Scherler, M., C. Hauck, M. Hoelzle, M. Stähli, and I. Völksch. 2010. Meltwater infiltration into the frozen active layer at an alpine permafrost site. Permafrost and Periglacial Processes 21:325–34.
- Shen, M., S. Piao, N. Cong, G. Zhang, and I. A. Jassens. 2015. Precipitation impacts on vegetation spring phenology on the Tibetan Plateau. Global Change Biology 21:3647–56.
- Sims, D. A., A. F. Rahman, V. D. Cordova, B. Z. El-Masri, D. D. Baldocchi, L. B. Flanagan, A. H. Goldstein, D. Y. Hollinger, L. Misson, R. K. Monson, et al. 2006. On the use of MODIS EVI to assess gross primary productivity of North American ecosystems. Journal of Geophysical Research: Biogeosciences 111:G04015.
- Wang, G., G. Liu, C. Li, and Y. Yang. 2012. The variability of soil thermal and hydrological dynamics with vegetation cover in a permafrost region. Agricultural and Forest Meteorology 162:44–57.
- Wang, G., J. Qian, G. Cheng, and Y. Lai. 2002. Soil organic carbon pool of grassland soils on the Qinghai-Tibetan Plateau and its global implication. Science of the Total Environment 291:207–17.
- Wang, G., L. Shengnan, H. Hongchang, and L. Yuanshou. 2009. Water regime shifts in the active soil layer of the Qinghai–Tibet Plateau permafrost region, under different levels of vegetation. Geoderma 149:280–89.
- Wang, G., L. Yuanshou, W. Yibo, and W. Qingbo. 2008. Effects of permafrost thawing on vegetation and soil carbon pool losses on the Qinghai–Tibet Plateau, China. Geoderma 143:143–52.
- Wang, S., X. Wang, G. Chen, Q. Yang, B. Wang, Y. Ma, and M. Shen. 2017. Complex responses of spring alpine vegetation phenology to snow cover dynamics over the Tibetan Plateau, China. Science of the Total Environment 593–594:449–61.
- Wu, Q., and T. Zhang. 2008. Recent permafrost warming on the Qinghai-Tibetan Plateau. Journal of Geophysical Research 113:D13108.
- Xue, X., J. Guo, B. Han, Q. Sun, and L. Liu. 2009. The effect of climate warming and permafrost thaw on desertification in the Qinghai–Tibetan Plateau. Geomorphology 108:182–90.
- Yang, K. 2013. A multi-scale soil moisture and freeze-thaw monitoring network on the Tibetan Plateau and its applications. Bulletin of the American Meteorological Society 94:1907–16.
- Yang, M., F. E. Nelson, N. I. Shiklomanov, D. Guo, and G. Wan. 2010. Permafrost degradation and its environmental effects on the Tibetan Plateau: A review of recent research. Earth-Science Reviews 103:31–44.
- Yang, M., T. Yao, X. Gou, N. Hirose, H. Y. Fujii, L. Hao, and D. F. Levia. 2007. Diurnal freeze/thaw cycles of the ground surface on the Tibetan Plateau. Chinese Science Bulletin 52:136–39.
- Yao, T., L. Thompson, W. Yang, W. Yu, Y. Gao, X. Guo, X. Yang, K. Duan, H. Zhao, B. Xu, et al. 2012. Different glacier status with atmospheric circulations in Tibetan Plateau and surroundings. Nature Climate Change 2:663–67.
- Yi, Y., J. S. Kimball, R. H. Chen, M. Moghaddam, R. H. Reichle, U. Mishra, D. Zona, and W. C. Oechel. 2018. Characterizing permafrost active layer dynamics and sensitivity to landscape spatial heterogeneity in Alaska. The Cryosphere 12:145–61.
- Yi, Y., J. S. Kimball, M. A. Rawlins, M. Moghaddam, and E. S. Euskirchen. 2015. The role of snow cover affecting boreal-arctic soil freeze-thaw and carbon dynamics. Biogeosciences 12:5811–29.
- Yu, F., K. P. Price, J. Ellis, and P. Shi. 2003. Response of seasonal vegetation development to climatic variations in eastern central Asia. Remote Sensing of Environment 87:42–54.
- Zhang, W., Y. Yi, J. Kimball, Y. Kim, and K. Song. 2015. Climatic controls on spring onset of the Tibetan Plateau Grasslands from 1982 to 2008. Remote Sensing 7:16607–22.
- Zhao, L., G. Cheng, S. Li, X. Zhao, and S. Wang. 2000. Process of freezing and thawing of permafrost active layers near Wudaoliang on Tibetan Plateau. Chinese Science Bulletin 45:1205–11.
- Zhao, L., C.-L. Ping, D. Yang, G. Cheng, Y. Ding, and S. Liu. 2004. Changes of climate and seasonally frozen ground over the past 30 years in Qinghai–Xizang (Tibetan) Plateau, China. Global and Planetary Change 43:19–31.
- Zhao, L., Q. B. Wu, S. S. Marchenko, N. Sharkhuu, and A. G. Lewkowicz. 2010. Thermal state of permafrost and active layer in Central Asia during the international polar year. Permafrost and Periglacial Processes 21:198–207.
- Zou, D., L. Zhao, Y. Sheng, J. Chen, G. Hu, T. Wu, J. Wu, C. Xie, X. Wu, Q. Pang, et al. 2017. A new map of permafrost distribution on the Tibetan Plateau. The Cryosphere 11:2527–42.