
 ?Mathematical formulae have been encoded as MathML and are displayed in this HTML version using MathJax in order to improve their display. Uncheck the box to turn MathJax off. This feature requires Javascript. Click on a formula to zoom.
ABSTRACT
Plateau pikas (Ochotona curzoniae), burrowing lagomorphs endemic to the Qinghai-Tibetan Plateau (QTP), are considered pests by Chinese authorities because of their association with grasslands that are characterized as degraded. Officials typically blame pikas for causing the degraded conditions, whereas studies increasingly suggest that sparse vegetation encourages population growth and high densities of pikas. Correlational investigations that document pika density while simultaneously describing grassland conditions can quantify this association, but are uninformative regarding causation. We used livestock exclosures and pika reductions in partially controlled experiments to examine how pika habitat use responds to changes in vegetation structure caused by wintertime livestock grazing. Mean counts of pikas were higher on grazed than ungrazed plots. Linear models accounting for experimental pika reduction as well as seasonal phenology indicated that grazing significantly increased pika use compared with ungrazed plots. These results show that moderate livestock density is likely consistent with both biodiversity conservation and economic activity, and that high pika populations alone are not responsible for observed degradation of the QTP alpine grasslands. Moderate levels of livestock grazing and pika presence are consistent with maintaining the integrity of the alpine steppe ecosystem of the QTP.
Introduction
The plateau pika (Ochotona curzoniae), a small, burrowing, nonhibernating, social lagomorph (Dobson, Smith, and Wang Citation1998; Smith Citation2018; Smith and Wang Citation1991) and the domesticated livestock of indigenous Tibetan pastoralists are two major drivers of grassland ecosystem processes on the Qinghai-Tibetan Plateau (QTP) in western China. The QTP occupies 2.5 million km2, which is approximately 25 percent of China’s land area (Harris et al. Citation2016; Miller Citation1995). The pastoralism of domesticated livestock has influenced the grasslands that cover approximately 70 percent of the QTP for approximately 8,000 years (Miehe et al. Citation2009; Miller Citation1995). These grasslands support a unique flora and fauna (Smith et al. Citationin press; Smith and Foggin Citation1999). Therefore, the current status, as well as future prospects for sustaining the integrity of this grassland ecosystem, are important at both local and regional scales.
Throughout the past few decades, the grasslands of the QTP have been perceived to be increasingly degraded (Fan et al. Citation1999; Foggin Citation2000; Li et al. Citation2013), yet documentation of the extent and magnitude of grassland degradation is lacking (Harris Citation2010). Our understanding of pastureland degradation on the QTP has also been hampered by a lack of clear consensus of what is meant by degradation. Some studies that have attempted to understand the causes of grassland degradation have claimed that pikas are a chief contributor to such degradation, especially when their populations reach high density (Fan et al. Citation1999; Sun et al. Citation2011; Wang, Zheng, and Xiao Citation2005; Zhao Citation1998). Others have attributed perceived degradation to human-induced overgrazing or poor livestock management (Bai, Zhang, and Xie Citation2002; Zhang et al. Citation2004). The arguments about the extent, causes, and remedies of degradation are highly variable, leading to controversial policy responses to address the perceived problem of degradation (Harris Citation2010). One such policy is the decades-long campaign to eradicate plateau pikas, which has been considered an essential component of grassland-management programs by policy makers aimed to mitigate and reverse degradation (Fan et al. Citation1999; Liu, Zhang, and Xin Citation1980; Sun et al. Citation2011; Wang, Zheng, and Xiao Citation2005). However, some researchers have argued that the high density of pika populations is a symptom of grassland degradation rather than a cause of the problem and that the root cause lies elsewhere (Harris Citation2010; Smith et al. Citationin press; Smith and Foggin Citation1999). In addition, evidence from many studies has shown that pikas provide critical ecological services to biodiversity and ecosystem functioning on the QTP (Badingqiuying et al. Citation2016; Delibes-Mateos et al. Citation2011; Harris et al. Citation2014; Hogan Citation2010; Lai and Smith Citation2003; Smith et al. Citationin press; Smith and Foggin Citation1999; Wilson and Smith Citation2015). Therefore, understanding the interactions between these herbivores (pikas and livestock) and grassland condition remains critical for making sound policy decisions.
Livestock grazing is the primary land-use practice on the grasslands of the QTP (Harris et al. Citation2016). These grasslands are also the natural habitat of pikas across the QTP (Smith and Foggin Citation1999). While livestock and plateau pikas have long coexisted (Miehe et al. Citation2009), in recent times dramatic increases in the density of these two major herbivores across the grasslands of the QTP have been reported (Caidan Citation2006; Fan et al. Citation1999; Harris Citation2010). Thus, the potential interaction between livestock and pikas is of interest: to what extent does the population density of one component (livestock or pikas) impact the other? Such an example includes a high population density of pikas being associated with increased grazing intensity by livestock (Li et al. Citation2013).
Pika population density has been shown to be highly dependent on local habitat conditions (Liu et al. Citation2009; Shi Citation1983; Xia Citation1984; Zhang et al. Citation1998). Habitat quality likely determines the population density of pikas because pika density tends to be higher in more degraded or overgrazed habitat than in habitat with more natural vegetation conditions, as suggested by Shi (Citation1983) and Liu et al. (Citation2003). However, the majority of studies examining relationships between pikas and grassland conditions have focused on the impact of pikas on vegetation communities (Bagchi, Tsewang, and Ritchie Citation2005; Guo et al. Citation2012; Hogan Citation2010; Sun et al. Citation2011). The possible reverse influence of vegetation on pikas has rarely been studied. A few studies have provided evidence that pika population density (or survival) responds to site-specific variables, such as vegetation biomass (Liu et al. Citation2003; Pech et al. Citation2007), cover (Liu et al. Citation2003; Shi Citation1983; Wangdwei, Steele, and Harris Citation2013), and height (Shi Citation1983). Other studies have subjectively categorized habitats as lightly, moderately, or heavily degraded (Li et al. Citation2014; Liu et al. Citation2003; Yu et al. Citation2010). Studies have not yet addressed causal relationships between pika density and habitat use or habitat conditions.
Here, we made use of livestock exclosures (Harris et al. Citation2015) to isolate the role that domestic livestock may play in determining pika habitat use and, ultimately, density. We hypothesized that livestock exclusion would result in greater standing vegetation biomass, which in turn would reduce pika habitat use. We reduced pika abundance to estimate the converse relationship of how pika density may impact vegetative characteristics in the alpine steppe habitat. These experiments allowed us to disentangle cause from effect—to determine whether pikas may exacerbate vegetative conditions or merely be responding to existing conditions.
Materials and methods
Study location and system
We conducted field experiments in four pastures of Village Five (approximately 35.5° N, 98.7° E), Gouli Township, Dulan County, Qinghai Province, PR China (). The study area is characterized by mountainous terrain with low to moderate slopes adjacent to the valley bottom (elevation 3,950 m), which rises to surrounding peaks at 4,900 m (Harris et al. Citation2015). The major habitat type is alpine steppe grassland dominated by the genus Stipa, accompanied by Leymus spp., Poa spp., Oxytropis spp., and more than 100 other species of vegetation (primarily forbs; full details are in Harris et al. Citation2015, Citation2016). The onset of spring vegetation green-up is determined by precipitation and temperature (Shen et al. Citation2011); in our study area, its timing typically occurred in June. The average annual precipitation during 2008–2013 at the study area was 398 mm (SD = 53.4), and approximately 92 percent of the precipitation occurred during April through September. Mean annual temperature was −1.4°C; the annual average temperature of the warmest eight-day period was 14.0°C, and the coldest eight-day period was −16.3°C (Harris et al. Citation2015).
Figure 1. Map of Qinghai Province, People’s Republic of China, showing county boundaries (fine lines). *Indicates the approximate location of the study site in Gouli Township, Dulan County, Qinghai Province, China (from Harris et al. Citation2015)
Pastures in the study area were mainly used as winter pasture; thus, they were grazed during mid-October through mid-June of the following year. Livestock were primarily domestic sheep and yaks, and a small number of goats and horses. Prior to 2010, and during the years of our investigation (2010–2013), all pastures where our field experiments were located were mainly grazed by sheep, with a small number of goats (Citation2016; Harris et al. Citation2015; Yeh and Gaerrang Citation2010).
Pikas were the most numerous above-ground vertebrate herbivore. Other small mammal herbivores, such as Chinese zokors (Eospalax fontanierii), Mongolian five-toed jerboas (Allactaga sibirica), mountain voles (Neodon spp.), voles (Microtus spp. and Lasiopodomys spp.), and dwarf hamsters (Cricetulus spp.), were observed in the vicinity of the study site. With the exception of one active vole colony that resided approximately 700 m from one exclosure, we did not observe the presence of these small mammals on or adjacent to the experiments during our study. Himalayan marmots (Marmota himalayana) and woolly hares (Lepus oiostolus) were present nearby, but were not observed on or near our study plots (Harris et al. Citation2015). Wild ungulates, including blue sheep (Pseudois nayaur), Tibetan gazelle (Procapra picticaudata), and argali (Ovis ammon), were present, but only gazelles (occasionally and in small numbers) were observed in the vicinity of the experiments. Tibetan foxes (Vulpes ferrilata) were often seen around the study area, apparently searching for pikas or other prey (Harris et al. Citation2014; Liu, Harris, and Wang Citation2010; Liu et al. Citation2007).
Experimental design
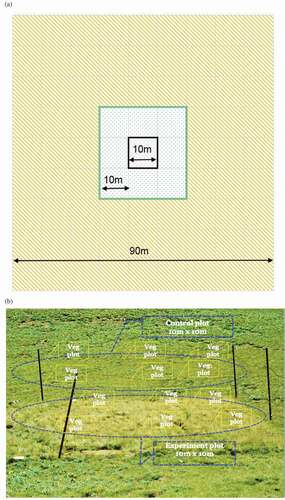
To test the effects of grazing exclusion on pika habitat use, we made use of twelve 10 m × 10 m woven wire livestock exclusion fences that had previously been constructed in specifically selected locations within four active pastures in fall 2009 to study livestock–vegetation relationships (, Appendix 1; Harris et al. Citation2015). We refer to each exclosure, together with its surrounding unexclosed area, as an “experiment” (Harris et al. Citation2015). All exclosures were on gentle slopes (mean percent slope 5%; range 0–15%) that faced southerly or southeasterly, and the experiments were distributed across the study area with only minor differences in elevation. Thus, the effects of weather variability and slope on the twelve experiments were inconsequential. Additional details on the positioning and characteristics of exclosure placements are given in Harris et al. (Citation2015).
Figure 2. Schematic map of randomly chosen grazed observation plots adjacent to ungrazed observation plots at Gouli field study site based on UTM coordinates. The solid squares represent the exclosures and dashed squares adjacent to the exclosures represent the grazed observation (i.e., control) plots. Plots 1, 2, 3, 7, 9, and 10 represent pika removal experiments; plots 4, 5, 6, 8, 11, and 12 represent nonremoval experiments. Further details on plot selection and characteristics are available in Harris et al. (Citation2015)
We refer hereafter to the 100 m2 areas within each fenced livestock exclosure as “ungrazed observation plots.” In spring 2010, we randomly selected and marked a single 10 m × 10 m (100 m2) observation plot adjacent to each of the exclosures; these served as controls, in the sense that grazing was allowed to occur on these observation plots without interference. Each control plot (hereafter “grazed observation plots”) was selected by tossing a piece of dried dung toward an ungrazed plot while standing approximately 20 m away without facing the plot. The direction of the ungrazed plot where the yak dung landed was selected for a grazed observation plot. Thus, our experimental design consisted of twelve grazed plots (1,200 m2 total area) adjacent to twelve ungrazed plots (also 1,200 m2 total area).
Pika reduction
Pikas were removed by kill (snap) trapping in six of the experiments (). To reduce incursions of pikas from neighboring family territories (and because pika family territories are much larger than the exclosures), trapping at each pika-reduction site extended 30 m beyond the experiment boundaries (; Harris et al. Citation2015). We set fifteen to twenty traps within each experiment at around noon, and they were checked the following morning and the number of animals removed was documented (Appendix 2). When we were unable to find a trap that had been set earlier, we assumed that a pika had been killed in it because we occasionally observed Tibetan foxes carrying away traps, suggesting that missing traps indicated dead pikas. Pikas are the primary prey for Tibetan foxes in this study area (Harris et al. Citation2010, Citation2014; Liu et al. Citation2007), and no other hypothesis for traps to be missing was reasonable to consider. The protocol for our study was approved by the Institutional Animal Care and Use Committee at Arizona State University (Protocol #12-1231R), and the Dulan County Forestry Bureau, Dulan, Qinghai, PRC.
Figure 3. Experimental design. (A) The black line demarcates a fenced exclosure plot; the green line defines the area within which paired, nonexclosure plots were located; and the orange hatching indicates the boundary area within which pikas were reduced surrounding pika-reduction experiments. (B) A fenced exclosure and an adjacent, randomly selected observation (control) plot that was grazed. Here, both are marked with blue dashed lines. Vegetation sampling plots within the exclosure and outside of the exclosure are represented by dashed markers in yellow. Not all the vegetation sampling plots were located in the randomly selected observation plot; others were located in adjacent unselected grazed plots (also 10 × 10 m)
Thus, our experimental design () consisted of: (1) six replicate experiments with the exclusion of livestock grazing and no pika reduction; (2) six replicates with the exclusion of livestock grazing and pika reduction; (3) six replicates with livestock grazing and no pika reduction; and (4) six replicates with livestock grazing and pika reduction.
Pika counts
Two observers counted pikas while sitting approximately 15 m away from each observation plot, tallying the number of individuals that appeared during one-hour sessions during 0800–1200 h and 1400–1800 h time periods (when pika activity peaks; Fan et al. Citation1999; Yin et al. Citation2009). We selected vantage points that allowed us to clearly see pika activities inside the plot while minimizing disturbance. Pikas generally became active within several minutes of our initial disturbance at the beginning of each observation session. Counts were averaged on the rare sessions when the two observers differed in the number of pikas seen. Thus, although we cannot account for imperfect or variable detection, that the two observers rarely differed in pika counts during individual sessions suggests that little would have been gained had we been able to employ a double-observer mark-recapture approach (sensu Nichols et al. Citation2000). We made observations in late May, late June, and late July of each year during summers 2010–2013.
Pika burrow counts
Two observers also counted active pika burrows; burrows were assessed as active by the presence of fresh soil at the burrow mouth (Lai and Smith Citation2003). We first divided each observation plot in half, marked with flags at the central line. We counted burrows within each half starting from the opposite side of the enclosure. For accuracy, we then switched halves to recount burrows, and reported the matched count numbers. Burrow sampling was carried out in late June 2010 and in mid-July from 2011 to 2013.
Vegetation sampling
We sampled vegetation in six randomly located plots (0.5 m2) within the exclosures, and at six paired 0.5 m2 plots outside the exclosures. Random selection of vegetation plots was achieved by first dividing each exclosure into 100 1 m2 sections, excluding the outmost 2 m-wide strips of each (to minimize possible edge effects arising from the presence of the fence); the remaining 64 m2 were assigned random numbers (1–64, using the pseudorandom number generator in MS-Excel), and those with integers 1–6 were selected for sampling (Harris et al. Citation2015). Sample plots were demarcated by positioning a 0.5 m2 PVC-made quadrat at each plot (). Plots were permanently marked with approximately 5 mm diameter steel cable anchors inserted approximated 30 cm into the ground to facilitate repeated vegetation measurements. Each of the six paired vegetation sampling plots outside the exclosure were selected based on vegetative similarity to its pair within the exclosure. Field crews conducted vegetation sampling from mid-July to mid-September of years 2010–2013, in addition to the pre-exclosure sampling in September 2009 (Harris et al. Citation2015); that is, a total of (144 × 4 = 576 vegetation plot readings). Field technicians who carried out the vegetation sampling for those consecutive years were trained in species identification and field protocol (see Harris et al. Citation2015 for details).
We used plot-specific data on vegetation height, percent live vegetation cover, percent litter cover, percent bare soil, and fresh biomass (in grams). Species-specific height was measured using a ruler, and the mean was recorded if more than one individual of the species was present. Species-specific fresh biomass was estimated using standardized known-weight reference samples and calibration of samples from check plots (Harris et al. Citation2015). To increase the precision of each estimation, vegetation was calibrated by clipping samples from selected plots near the randomly selected permanent plots. Percent live vegetation cover, percent litter cover, and percent bare soil were estimated visually (Harris et al. Citation2015).
Data analyses and hypotheses tested
We tested for differences in Stipa height, vegetation cover, vegetation fresh biomass (green weight), litter cover, and percentage of bare soil measurements between treatments using mixed-effect linear models (lmer function in the lme4 package for R; Bates et al. Citation2015). For each test, we treated as fixed effects grazing (excluded or not) and whether pikas were reduced or not. Random factors were the six pairs of vegetation plot pairs nested within each of the twelve experiments, each of which was nested within year (2010–2013) as well as Julian date.
To test hypotheses that grazing exclusion and/or pika reduction explained differences in the number of pikas observed, we treated as fixed effects grazing (excluded or not) and whether pikas were reduced or not and also examined the interaction of these two fixed effects; we treated as random effects year nested within experiment as well as Julian date, using the R program glmer (Bates et al. Citation2017). Our model took the form (in R syntax):
Pikas observed ~ grazing excluded × pikas reduced + (1|Julian date) + (1| year/experiment)
To address the hypothesis that livestock exclusion or pika reduction explained the variation in the number of burrows, we applied the same model structures for predicting pika count differences between treatments, as previously. For models of both pika counts and burrow counts, we used negative binomial error structures for response variables because goodness-of-fit tests suggested poor fits to models with Poisson error structures, and because variances were much larger than means for both counts of pikas (variance = 11.49, mean = 3.41) and of active pika burrows (variance = 200.08, mean = 17.58).
We conducted statistical tests with R (version 3.2.4, R Core Team Citation2016). Results of all statistical tests were considered significant at p < 0.05.
Results
We counted a total of 297 pikas on ungrazed observation plots and 442 pikas on grazed observation plots (Appendix 3). Across all treatments and replicates (n = 312), the mean pika count was 2.37. presents the means and standard errors of pikas observed across the treatments from May to July 2010–2013; presents vegetation characteristics across the treatments. Stipa height, vegetation cover, litter cover, and bare soil differed between the ungrazed and grazed conditions ().
Table 1. Means of the total number of pikas counted from May to July (n = 739 in 312 counting bouts) of years 2010–2013, Village Five, Gouli Township, Dulan County, Qinghai Province, China. July (2010–2013) data (n = 494 in 167 counting bouts) are presented separately because vegetation measurements were not collected prior to this time, and thus data were analyzed separately
Table 2. Means and standard deviations (in parenthesis) of selected vegetative characteristics habitat variables (n = 576) in 0.5 m2 plots in grazed plots and ungrazed plots, as well in pika-reduced plots and plots without pika reduction, in Village Five, Gouli Township, Dulan County, Qinghai Province, China, July–September 2010–2013
Table 3. Mixed-effect linear models showing fixed effects of the joint influence of grazing and pika reduction on selected vegetative characteristics, in Village Five, Gouli Township, Dulan County, Qinghai Province, China, July–September 2010–2013. Shown are estimated coefficients, standard errors of coefficients (SE), and t values. Variance explained by random effects plot, experiment, year, and Julian date not shown
During July only, across all years, fewer pikas were observed in plots that had been subjected to pika trapping () than where no trapping occurred (
. In July only, pika counts in ungrazed observation plots (
) did not differ from those in grazed observation plots (
.
Livestock exclusion and pika reduction both had significantly negative effects on pika counts (pika reduction: β = −0.506, SE = 0.225, z = −2.24, p = 0.025; grazing exclusion: β = −0.499, SE = 0.143, z = −3.49, p = 0.0005; interaction: β = 0.147, SE = 0.226, z = 0.54, p = 0.515; ).
Table 4. Mixed-model negative binomial regression predicting pika counts (n = 312) with fixed effects grazed (or not) and pikas reduced (or not), and random effects year, exclosure, and Julian date, Village Five, Gouli Township, Dulan County, Qinghai Province, China, 2010–2013. Shown are coefficients (β), standard errors (SE), z values, and probabilities (p) for fixed effects; standard deviations (SD) and number of observations (n) for random effects
The total number of burrows counted across all years on the twelve ungrazed observation plots was 825 (burrow density = 0.69/m2) and on the twelve grazed plots was 863 (burrow density = 0.72/m2). We counted fewer burrows annually in plots subjected to pika reduction (x̅ = 6.78, SE = 0.98) than in plots with no pika reduction (x̅ = 16.88, SE = 2.44).
Pika reduction had a significantly negative effect on counts of pika burrows (β = −0.762, SE = 0.233, z = −3.27, p = 0.001). However, livestock exclusion had no significant effect on burrow counts, with no interaction of treatments detected ().
Table 5. Mixed-model negative binomial regression predicting pika burrow counts (n = 96) with fixed effects grazed (or not) and pikas reduced (or not), and random effects year, exclosure, and Julian date, Village Five, Gouli Township, Dulan County, Qinghai Province, China, 2010–2013. Shown are slope coefficients (β), standard errors (SE), z values, and probabilities (p) for fixed effects; standard deviations (SD) and number of observations (n) for random effects
Discussion
It has long been known that high pika population densities are associated with degraded grassland conditions (Han, Hua, and Xu Citation2008; Jiang Citation1998; Liu et al. Citation2003, Citation2009; Shi Citation1983; Zhang et al. Citation1998), as indicated by the reduction in above-ground biomass and the presence of bare soil (Han, Hua, and Xu Citation2008; Liu et al. Citation2003; Wu and Du Citation2007). Some have argued that the burrowing activities of pikas exacerbate degraded conditions when the pika density reaches high levels (Guo et al. Citation2012; Han, Hua, and Xu Citation2008; Su and Fan Citation2002; Sun et al. 2015).
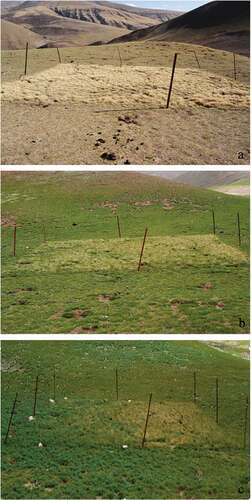
However, previous work has not been conducive to disentangling cause from effect in this relationship. Pikas may cause or exacerbate vegetative conditions (as suggested previously), or they may respond to these conditions. By artificially controlling grazing—and thus vegetation characteristics—our study demonstrated that pika habitat use at a local spatial scale responded to vegetation characteristics. Mean pika counts in the presence of grazing were higher than in ungrazed plots across all census periods, a pattern that was similar regardless of whether or not pikas were reduced. In contrast to the marked differences seen earlier in the growing season, we noted little difference in vegetation height or biomass between the ungrazed and grazed conditions in July ().
Figure 4. Example of phenological progression of vegetation from May (a), June (b), and July (c) 2011, showing decreasing contrast of vegetation between an ungrazed and a grazed observation plot (experiment 3), Village Five, Gouli Township, Dulan County, Qinghai Province, China
As expected, we counted fewer pikas and fewer pika burrows in experiments subjected to pika reduction than experiments with no pika reduction. Our pika trapping efforts resulted in reducing pika abundance by approximately half. Achieving a complete reduction of pikas was difficult because of the small size of our experiments relative to the mean size of a pika family territory (~12 m radius from the center of activities; Dobson, Smith, and Wang Citation1998).
In contrast to the marked effect on pika habitat use, livestock grazing exclusion showed no effect on pika burrow density. The number of pika burrows did decline with pika reduction. We interpret the decline as reflecting a temporal lag, in which the reduced use of burrows with fewer pikas led to a hastened collapse of previously used burrows. Liu et al. (Citation2003) and Han, Hua, and Xu (Citation2008) showed that pika population density and burrow density are positively correlated.
Our use of livestock exclosures to isolate cause and effect allowed us to demonstrate that grazing produced changes in vegetation conditions, and that pikas responded to those changed conditions. Consistent with our hypothesis, livestock grazing, which resulted in lower standing vegetation biomass, was associated with greater use by pikas than where grazing was excluded. These observations suggest that grassland habitats characterized by low height, low biomass, or both, are favored habitats for plateau pikas.
Understanding the magnitude and causes of grassland degradation remains an area of active research, but overgrazing, if it occurs, is generally thought to play a major role in grassland degradation. Increases in stocking rates and grassland degradation have occurred simultaneously throughout the past few decades (Dong et al. Citation2005; Jing et al. Citation1991; Zhang et al. Citation1998; Zhou et al. Citation2005). A high stocking rate is associated with a large percentage of bare soil patches, which is thought to be an important indicator of grassland degradation (Li and Huang Citation1995; Liu et al. Citation1999; Yan et al. Citation2003).
In a related study, Harris et al. (Citation2016) found that a combination of foraging, clipping, and burrowing activities of pikas under certain circumstances tended to perpetuate conditions undesirable to pastoralists. Our work suggests that some control of pikas, if desired, can be achieved by excluding livestock alone. However, Harris et al. (Citation2015) cautioned that policies emphasizing restoration via a long-term grazing ban merit reconsideration, because QTP steppe plants have adapted to moderate levels of offtake and disturbance. They argued that, although the stocking rate of sheep was positively associated with bare soil and erosion (Harris et al. Citation2016), some plant species appear to have coevolved with, and would thus benefit from, grazing by both pikas and livestock. Taken together, these results argue that moderate livestock density is likely to be consistent with both biodiversity conservation and economic activity. Both livestock grazing and pika presence can be consistent with maintaining the integrity of the alpine steppe ecosystem of the QTP, particularly at moderate densities.
Acknowledgments
For field assistance, we thank Kunsang, Ryabtengyal, Drokarji, Hualchendorjie, Pemabum, and Maxwell Wilson. Badingqiuying thanks his additional doctoral committee members, Jingle Wu, Ben Minteer, and Marty Anderies, for their academic guidance and support during his studies at Arizona State University.
Additional information
Funding
References
- Badingqiuying, A. T. Smith, J. Senko, and M. Siladan. 2016. Plateau pika (Ochotona curzoniae) poisoning campaign reduces carnivore abundance in southern Qinghai, China. Mammal Study 41:1–8.
- Bagchi, S., N. Tsewang, and E. M. Ritchie. 2005. Small mammalian herbivores as mediators of plant community dynamics in the high-altitude arid rangelands of Trans-Himalaya. Biological Conservation 127:438–42.
- Bai, W. Q., Y. L. Zhang, and G. D. Xie. 2002. Analysis of formation causes of grassland degradation in Maduo County in the source region of Yellow River. [In Chinese.] Chinese Journal of Applied Ecology 13:823–26.
- Bates, D., M. Maechler, B. Bolder, S. Walker, R. H. B. Christensen, H. Singmann, B. Dai, G. Grothendieck, and P. Green. 2017. Package ‘lme4’ (version 1.1-14). September 27, 2017. Accessed October 13, 2017. https://cran.r-project.org/web/packages/lme4/lme4.pdf.
- Bates, D., M. Maechler, B. Bolker, and S. Walker. 2015. Fitting linear mixed-effects models using lme4. Journal of Statistical Software 67:1–48.
- Caidan. 2006. An assessment on causes to degradation of alpine grassland ecosystems of Qinghai and their management strategies. [In Chinese.] Pratacultural Science 23:7–11.
- Delibes-Mateos, M., A. T. Smith, C. N. Slobodchikoff, and J. E. Swenson. 2011. The paradox of keystone species persecuted as pests: A call for the conservation of abundant small mammals in their native range. Biological Conservation 144:1335–46.
- Dobson, F. S., A. T. Smith, and X. G. Wang. 1998. Social and ecological influences on dispersal and philopatry in the plateau pika (Ochotona curzoniae). Behavioral Ecology 9:622–35.
- Dong, Q. M., Y. S. Ma, Q. Y. Li, X. Q. Zhao, Q. J. Wang, and J. J. Shi. 2005. Effects of stocking rates for yak on community composition and plant diversity in Kobresia parva alpine meadow warm-season pasture. [In Chinese.] Acta Botany Boreal-Occident Sinica 25:94–102.
- Fan, N., W. Zhou, W. Wei, Q. Wang, and Y. Jiang. 1999. Rodent pest management in the Qinghai-Tibet alpine meadow ecosystem. In Ecologically-based rodent management, ed. G. R. Singleton, L. A. Hinds, L. Leirs, and Z. Zhang, 285–304. Canberra, Australia: Australian Centre for International Agricultural Research.
- Foggin, J. M. 2000. Biodiversity protection and the search for sustainability in Tibetan Plateau grasslands (Qinghai, China). Ph.D. diss., Arizona State University, Tempe, Arizona.
- Guo, G. Z., L. F. Xiao, L. Y. Xing, and Z. R. Xue. 2012. Response of alpine meadow communities to burrow density changes of plateau pika (Ochotona curzoniae) in the Qinghai-Tibet Plateau. Acta Ecologica Sinica 32:44–49.
- Han, T. H., L. M. Hua, and G. C. Xu. 2008. Rodent damage assessment on the plateau pika. [In Chinese.] Acta Prataculturae Sinica 17:130–37.
- Harris, R. B. 2010. Rangeland degradation on the Qinghai-Tibetan Plateau: A review of the evidence of its magnitude and causes. Journal of Arid Environments 74:1–12.
- Harris, R.B., L.H. Samberg, E.T. Yeh, A.T. Smith, W.Y. Wang, J. B. Wang, Gaerrang, and D. J. Bedunah. 2016. Rangeland responses to pastoralists’ grazing management on a Tibetan steppe grassland, Qinghai Province, China. The Rangeland Journal 38:1–15.
- Harris, R. B., W. Y. Wang, Badingqiuying, A. T. Smith, and D. J. Bedunah. 2015. Herbivory and competition of Tibetan steppe vegetation in winter pasture: Effects of livestock exclosure and plateau pika reduction. PLoS One 10 (7):e0132897.
- Harris, R.B., J. K. Zhou, Y.Q. Ji, K. Zhang, C.Y. Yang, and D. W. Yu. 2014. Evidence that the Tibetan fox is an obligate predator of the plateau pika: Conservation implications. Journal of Mammalogy 95:1207–21.
- Hogan, B. W. 2010. The plateau pika: A keystone engineer on the Tibetan Plateau. Ph.D. diss., Arizona State University, Tempe, Arizona.
- Jiang, X. L. 1998. Relationship of population quantities of plateau pika with vegetation homogeneity. [In Chinese.] Acta Prataculturae Sinica 7:60–64.
- Jing, Z. C., N. C. Fan, W. Y. Zhou, and J. H. Bian. 1991. Integrated management of grassland rodent pest in Panpo area. [In Chinese.] Chinese Journal of Applied Ecology 2:32–38.
- Lai, C. H., and A. T. Smith. 2003. Keystone status of plateau pikas (Ochotona curzoniae): Effect of control on biodiversity of native birds. Biodiversity and Conservation 12:1901–12.
- Li, M., W. T. Feng, S. X. Li, W. Liu, M. L. Jing, X. X. Ming, and L. Yu. 2014. Effect of plateau pikas on alpine meadow grassland in upstream of Datong River. [In Chinese.] Chinese Qinghai Journal of Animal and Veterinary Sciences 44:7–9.
- Li, X. L., and B. J. Huang. 1995. The cause of “black soil patch” grassland in Qinghai Province and management countermeasures. [In Chinese.] Journal of Grassland of China 4:64–67.
- Li, X. L., G. L. W. Perry, G. Brierley, J. Gao, J. Zhang, and Y. W. Yang. 2013. Restoration prospects for Heitutan degraded grassland in the Sanjiangyuan. Journal of Mountain Science 10:687–98.
- Liu, J. K., Y. Z. Zhang, and G. W. Xin. 1980. Relationship between the numbers of plateau pikas and the level of their damage. Acta Zoologica Sinica 26:278–85.
- Liu, Q. X., R. B. Harris, and X. M. Wang. 2010. Food habits of Tibetan fox (Vulpes ferrilata) in the Kunlun Mountains, Qinghai Province, China. Mammalian Biology 75:283–86.
- Liu, Q. X., R. B. Harris, X. M. Wang, and Z. H. Wang. 2007. Home range size and overlap of Tibetan foxes (Vulpes ferrilata) in Dulan County, Qinghai Province. [In Chinese.] Acta Theriologica Sinica 27:370–75.
- Liu, W., Q. J. Wang, X. Wang, L. Zhou, and F. J. Li. 1999. Ecological process of forming “black-soil-type” degraded grassland. [In Chinese.] Acta Agrestia Sinica 7:300–307.
- Liu, W., X. Wang, Z. Li, and H. K. Zhou. 2003. Studies on destruction, prevention and control of plateau pikas in Kobresia pygmaea meadow. [In Chinese.] Acta Theriologica Sinica 23:214–19.
- Liu, W., Z. Yu, W. Xi, J. Z. Zhao, Q. M. Xu, and Z. Li. 2009. The relationship of the harvesting behavior of plateau pikas with the plant community. Acta Theriologica Sinica 29:40–49.
- Miehe, G., S. Miehe, K. Kaiser, C. Reudenback, L. Behrendes, L. Duo, and F. Schlütz. 2009. How old is pastoralism in Tibet? An ecological approach to the making of a Tibetan landscape. Palaeogeography, Palaeoclimatology, Palaeoecology 276:130–47.
- Miller, D. J. 1995. Herds on the move: Winds of change among pastoralists in the Himalayas and on the Tibetan Plateau.Kathmandu, Nepal: International Centre for Integrated Mountain Development.
- Nichols, J. D., J. E. Hines, J. R. Sauer, F. W. Fallon, J. E. Fallon, and P. J. Heglund. 2000. A double-observer approach for estimating detection probability and abundance from point counts. The Auk 117:393–408.
- Pech, R. P., Jiebu, A. D. Arthur, Y. M. Zhang, and H. Lin. 2007. Population dynamics and responses to management of plateau pikas Ochotona curzoniae. Journal of Applied Ecology 44:615–24.
- R Core Team. 2016. R: A language and environment for statistical computing. Vienna, Austria: R Foundation for Statistical Computing. https://www.R-project.org.
- Shen, M., T. Tang, J. Chen, X. Zhu, and Y. Zheng. 2011. Influences of temperature and precipitation before the growing season on spring phenology in grasslands of the central and eastern Qinghai-Tibetan Plateau. Agricultural and Forest Meteorology 151:1711–22.
- Shi, Y. Z. 1983. On the influences of rangeland vegetation to the density of plateau pika (Ochotona curzoniae). [In Chinese.] Acta Theriologica Sinica 3:181–87.
- Smith, A. T. 2018. Ochotona curzoniae (Hodgson, 1958): Plateau pika. In Lagomorphs: Pikas, rabbits, and hares of the world, ed. A. T. Smith, C. H. Johnston, P. C. Alves, and K. Hackländer, 40–43. Baltimore, MD: Johns Hopkins University Press.
- Smith, A. T., Badingqiuying, M. C. Wilson, and B. W. Hogan. In press. Functional-trait ecology of the plateau pika Ochotona curzoniae (Hodgson, 1858) in the Qinghai-Tibetan ecosystem. In Integrative Zoology, ed. Zhibin Zhang. Richmond, Australia: Wiley Publishing Asia.
- Smith, A. T., and J. M. Foggin. 1999. The plateau pika (Ochotona curzoniae) is a keystone species for biodiversity on the Tibetan plateau. Animal Conservation 2:235–40.
- Smith, A. T., and X. G. Wang. 1991. Social relationships of adult black-lipped pikas (Ochotona curzoniae). Journal of Mammalogy 72:231–47.
- Su, W. Z., and N. C. Fan. 2002. The cause of rodent pests occurring on the grassland in China and the strategies of ecological management. [In Chinese.] Bulletin of Biology 37:1–4.
- Sun, F.D., W.Y. Chen, L. Liu, W. Liu, Y.M. Cai, and P. Smith. 2015. Effects of plateau pika activities on seasonal plant biomass and soil properties in the alpine meadow eco-systems of the Tibetan Plateau. Grassland Science 61:195–203.
- Sun, F. D., R. J. Long, Z. G. Guo, W. L. Liu, Y. M. Gan, and W. Y. Cheng. 2011. Effects of rodent activities on plant community and soil environment in alpine meadow. [In Chinese.] Pratacultural Science 28:146–51.
- Wang, L. H., Q. Y. Zheng, and B. X. Xiao. 2005. Progress in China’s grassland rodent control. [In Chinese.] Grassland Preservation 5:48–52.
- Wangdwei, M., B. Steele, and R. B. Harris. 2013. Demographic responses of plateau pikas to vegetation cover and land use in the Tibetan Autonomous Region, China. Journal of Mammalogy 94:1077–86.
- Wilson, M. C., and A. T. Smith. 2015. The pika and the watershed: The impact of small mammal poisoning on the ecohydrology of the Qinghai-Tibetan Plateau. Ambio 44:16–22.
- Wu, G. L., and G. Z. Du. 2007. Discussion on ecological construction and sustainable development of degraded alpine grassland ecosystem of the Qinghai-Tibetan Plateau. [In Chinese.] Chinese Journal of Nature 29:159–64.
- Xia, W. P. 1984. Progress in mammalian ecology in China. [In Chinese.] Acta Theriologica Sinica 13:74–77.
- Yan, Z. L., H. K. Zhou, W. L. Liu, and L. Zhou. 2003. Preliminary discuss on grassland degradation in the source region of Yangtze and Yellow Rivers. [In Chinese.] Grassland of China 25:73–78.
- Yeh, E. T., and Gaerrang. 2010. Tibetan pastoralism in neoliberalising China: Continuity and change in Gouli. Area 43:165–72.
- Yin, B. F., S. M. Yang, W. H. Wei, and Y. M. Zhang. 2009. Male reproductive success in plateau pikas (Ochotona curzoniae): A microsatellite analysis. Mammalian Biology 74:344–50.
- Yu, J. L., H. X. Shi, J. Li, and C. Y. Zhao. 2010. Preliminary study on range conditions of alpine Kobresia meadows under different degradation degrees. Journal of Pratacultural Science 27:115–18.
- Zhang, H. F., F. G. Liu, Q. Zhou, and H. R. Dou. 2004. Degradation mechanism of the grass in Qinghai-Plateau and its prevention and control countermeasures. [In Chinese.] Journal of Natural Disasters 13:115–20.
- Zhang, Y., N. Fan, Q. Wang, and Z. Jing. 1998. The changing ecological process of rodent communities during rodent pest managements on alpine meadow. [In Chinese.] Acta Theriologica Sinica 18:137–43.
- Zhao, M. C. 1998. The environment quality and the analysis of obstacle factors of sustainable development in south Qinghai. [In Chinese.] Progress in Geography 17:25–32.
- Zhou, H., S. Gu, X. Zhao, L. Zhou, and Z. Yan. 2005. Alpine grassland degradation and its control in the source region of the Yangtze and Yellow rivers, China. Japanese Society of Grassland Science 51:191–97.
Appendices
Characteristics of four winter pastures on which the twelve experimental exclosures were established, in Village Five, Gouli Township, Dulan County, Qinghai Province, China, 2009–2013. Further details of pasture site characteristics available in Harris et al. (Citation2015)
Number of pikas killed in twelve experiments (six with pika reduction, six without) during 2010–2012, Village Five, Gouli Township, Dulan County, Qinghai Province, China
Pikas counted during one-hour observation bouts at each of the observation plots from 2010 to 2013 at the Gouli field site, Dulan County, Qinghai Province, China. Pika counts in 2010 were conducted only during July; two separate bouts were conducted in July 2011–2013, and these are summed here (means for these months are per counting bout)