
ABSTRACT
Ice-wedge polygons are common features of northeastern Siberian lowland periglacial tundra landscapes. To deduce the formation and alternation of ice-wedge polygons in the Kolyma Delta and in the Indigirka Lowland, we studied shallow cores, up to 1.3 m deep, from polygon center and rim locations. The formation of well-developed low-center polygons with elevated rims and wet centers is shown by the beginning of peat accumulation, increased organic matter contents, and changes in vegetation cover from Poaceae-, Alnus-, and Betula-dominated pollen spectra to dominating Cyperaceae and Botryoccocus presence, and Carex and Drepanocladus revolvens macro-fossils. Tecamoebae data support such a change from wetland to open-water conditions in polygon centers by changes from dominating eurybiontic and sphagnobiontic to hydrobiontic species assemblages. The peat accumulation indicates low-center polygon formation and started between 2380 ± 30 and 1676 ± 32 years before present (BP) in the Kolyma Delta. We recorded an opposite change from open-water to wetland conditions because of rim degradation and consecutive high-center polygon formation in the Indigirka Lowland between 2144 ± 33 and 1632 ± 32 years BP. The late Holocene records of polygon landscape development reveal changes in local hydrology and soil moisture.
Introduction
Permafrost regions are strongly affected by ongoing global warming (ACIA Citation2004). Hence, the widely distributed patterned ground of Arctic polygonal wetlands is considered to be sensitive to environmental and climate changes (Liljedahl et al. Citation2016). Ice-wedge polygons occur abundantly in the Canadian Arctic, in the Alaskan Arctic coastal plains, and in northern Siberian lowlands. Circumarctic polygonal wetlands cover about 250,000 km2 (Minke et al. Citation2007). Ice-wedge polygons form either low (often pond filled) polygon centers, which are surrounded by elevated peaty polygon rims underlain by ice wedges or high-center polygons in which the center is elevated and surrounded by polygon trenches underlain by melting ice wedges (MacKay Citation2000). Soils in permafrost regions consist of the seasonally unfrozen active layer and the underlying, perennially frozen ground (Ellis et al. Citation2008).
The functioning and dynamics of polygonal ecosystems have increasingly been studied in recent years (e.g., de Klerk, Theuerkauf, and Joosten Citation2017; Fritz et al. Citation2016; Jorgenson, Shur, and Pullman Citation2006; Zibulski et al. Citation2013). A first comprehensive species inventory of tundra-wetland ponds combined with a detailed survey of physical and chemical water parameters was carried out from 1971 to 1973 near Barrow, Alaska (Hobbie Citation1980; Hobbie et al. Citation1999); it was repeated forty years later by Lougheed et al. (Citation2011). Polygon studies in the Canadian Arctic deal with the hydrology (Woo et al. Citation2008; Young and Abnizova Citation2008) and the disappearance of polygon ponds because of increasing evaporation/precipitation ratios, probably associated with climatic warming (Andresen and Lougheed Citation2015; Wolfe et al. Citation2011). Multiparameter analysis of late Holocene Canadian Arctic polygon deposits, as performed by Fortier and Allard (Citation2004), Ellis and Rochefort (Citation2006), Fritz et al. (Citation2016), and Wolter et al. (Citation2016), is valuable for reconstructing millennial-scale polygon dynamics. Recent polygon studies in northeastern Siberia, mainly in the Indigirka Lowland, were undertaken by Beermann et al. (Citation2015, Citation2017), Bobrov et al. (Citation2013), de Klerk et al. (Citation2004, Citation2009, Citation2011, Citation2014, Citation2017), Minke et al. (Citation2007, Citation2009), Schneider et al. (Citation2016), and Teltewskoi et al. (Citation2016). They show, for example, new results on nutrient dynamics, current and past vegetation dynamics, and polygon morphology. Furthermore, studies of changes in morphology and surface hydrology of polygonal tundra were undertaken in the Lena River Delta and near Barrow, Alaska (e.g., Andresen and Lougheed Citation2015; Helbig et al. Citation2013; Lara et al. Citation2015).
Most polygon studies deal with surface-related modern geomorphological and ecological changes and greenhouse gas emission. Below-surface conditions, characteristics, and paleoecology of polygons were studied in the Canadian Arctic (Bockheim et al. Citation2004; Fortier and Allard Citation2004; Fritz et al. Citation2016; Morse and Burn Citation2013) as well as in the Indigirka Lowland (de Klerk et al. Citation2011; Teltewskoi et al. Citation2016) and the Lena Delta (Zubrzycki et al. Citation2013). Organic matter (OM) characteristics of polygons have, however, seldom been studied.
In our study, we investigate ice-wedge polygons in the northeastern Siberian lowlands using cryolithological and paleoecological approaches to reconstruct temporal and spatial variations of polygon dynamics. The objectives of this article are (1) to classify the cryostratigraphy and chronostratigraphy of cores drilled in different parts of polygons, (2) to differentiate the paleoecological and OM characteristics, and (3) to calculate the OM inventory of ice-wedge polygon environments based on the studied cores. By applying tecamoebae, pollen, and macrofossil analyses in conjunction with cryolithological analyses and radiocarbon dating we further aim to resolve the stability of polygons during their development, especially in terms of hydrological conditions.
Study area
We studied the cryolithology and micropalaeontological inventory of ice-wedge polygons in the Kolyma Delta near Pokhodsk (N 69.079184°, E 160.963365°), while we obtained one additional data set from a polygon center in the Indigirka Lowland approximately 550 km to the west near the World Wildlife Foundation (WWF) Kytalyk research station (N 70.827232°, E 147.490542°) for comparison (; Schirrmeister et al. Citation2016). The general climate of the Kolyma Delta is according to meteorological data from the nearest World Meteorological Organization (WMO) station in Cherskii (no. 25123), characterized by high annual temperature amplitudes and low precipitation (TJuly 12°C, TJanuary −33.3°C, TMean −11.6°C, and pAnn 290 mm). The regional permafrost temperature varies from –7°C to –5°C, and the permafrost is 100–300 m thick (Geocryological Map Citation1991). The uppermost seasonally unfrozen active layer commonly reaches depths of 15–35 cm (Andreev Citation2001). The surface morphology of the flat and low-lying terrestrial part of the delta (2–4 m above sea level; Andreev Citation2001) is largely shaped by periglacial processes; that is, widespread formation of thermokarst basins and pingo and ice-wedge polygon growth (Wetterich et al. Citationunder review). Extended ice-wedge polygon systems were studied in the floodplain areas of the small Viska Pokhodskaya River and the Pokhodskaya Kolyma Channel, which is one of the major channels in the Kolyma Delta (Appendix 1). The area is described as sedge, moss, low-shrub wetland (W3) and low-shrub tundra (S2; CAVM Team Citation2003).
Figure 1. Position of the study areas (A), marked by red stars: Kytalyk in the Indigirka Lowland and Pokhodsk in the Kolyma Delta. DEM compiled by G. Grosse (AWI Potsdam). Position of the studied polygons at the Kytalyk site (B) and at the Pokhodsk site (C). Satellite maps compiled by S. Laboor (AWI Potsdam)
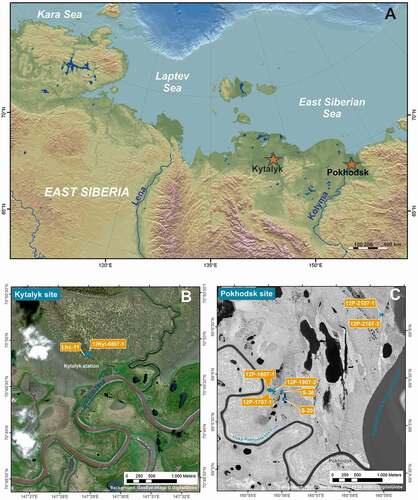
Our Kytalyk study area is located along the Berelekh River 28 km northwest of Chokurdakh. The mean annual precipitation is higher (pann 354 mm), the air temperature is lower (TMean −14.4°C), and the seasonal temperature amplitude between summer and winter is larger (TJuly 9.7°C, TJanuary −38.3°C) compared to the Kolyma Delta area (Chokurdakh, WMO station no. 21946; Worldwide Bioclimatic Classification System Citation1996–2017). The regional permafrost temperature is –6°C to –4°C and the permafrost is 200–300 m thick (Geocryological Map Citation1991). The periglacial surface morphology exhibits Yedoma remnants and large thermokarst basins (alases) and floodplains, both partly occupied by lakes and extended ice-wedge polygon systems (Appendix 1). The vegetation is a tussock-sedge, dwarf shrub, moss tundra (G4; CAVM Team Citation2003).
Materials and methods
In order to study near-surface cryolithology of polygons and to obtain sample material, cores were drilled down to 130 cm below surface (cm b.s.) using a SIPRE Coring Auger Set (Ø 70 mm). Sediment features and cryostructures were described following Katasonov (Citation1975), Murton and French (Citation1994), and French and Shur (Citation2010); sketched; and photographed.
We drilled four cores from polygon centers (core 12Kyt-0807-1 from the Kytalyk study area) and two cores from polygon rims. Cores labeled as 12P-. . . were from the Pokhodsk (Kolyma Delta) study area. In addition, unfrozen soil (core S-20, 50 cm) was sampled with a Russian peat corer from coalesced ponds. A second short core of unfrozen polygon pond sediments (core S-36, 9 cm) was taken with a gravity corer (Appendix 2-1). Site description, coordinates, and cryolithological descriptions of each core are summarized in the Appendixes 2-1, 2-2, and 3-1. The sediment samples were stored cool in plastic bags until analysis. The gravimetric ice content was measured during fieldwork and is expressed as weight percentage (wt%).
In the laboratory the samples were freeze-dried, homogenized, and split into subsamples. Grain-size analyses were carried out using a laser particle analyzer (LS 200 Beckman-Coulter) after removing OM with H2O2 (3%). We used grain-size classifications according to Reineck and Sing (Citation1980) and Wenthworth (Citation1922). Total organic carbon (TOC), total carbon (TC), and total nitrogen (TN) contents were measured with element analyzers (VARIO MAX C for TOC and VARIO-EL-III for TC and TN with analytical accuracy of ±0.1 wt%). OM inventory calculations were based on Strauss et al. (Citation2012), including the calculation of bulk density for ice-saturated sediments. Total inorganic carbon (TIC) content was calculated by subtracting TOC from TC. For TOC and stable organic carbon isotope (δ13C) analyses, samples were decalcified for 3 h at 95°C by adding 1.3 N HCl. The δ13C of TOC was measured with a Finnigan DELTA S mass spectrometer and is expressed in delta per mil (δ, ‰) notation relative to the Vienna Pee Dee Belemnite (VPDB) standard with an uncertainty of 0.15‰. Mass-specific magnetic susceptibility (MS) was measured using Bartington MS2 instruments equipped with an MS2B sensor. The data are expressed in SI units (according to Le Système International d’Unités, 10–8 m3 kg−1). The hydrogen (δD) and oxygen (δ18O) stable isotope composition of intrasedimentary ice was analyzed with a Finnigan MAT Delta-S mass spectrometer and values are given as per mil (δ, ‰) difference from the Vienna Standard Mean Ocean Water (VSMOW) standard, with internal 1σ errors of better than 0.8‰ for δD and 0.1‰ δ18O. The deuterium excess (d excess) is calculated according to Dansgaard (Citation1964) as d = δD–8δ18O.
Identified plant macro-remains were radiocarbon dated by accelerator mass spectrometry (AMS) at the Poznan Radiocarbon Laboratory, Poland, and at the CologneAMS Laboratory, Germany (Rethemeyer et al. Citation2013). Samples were prepared using an acid-alkali-acid three-step treatment (AAA) to remove humic and fulvic acids and secondary carbonates. Conventional radiocarbon ages are reported as years before present (yrs BP; Stuiver and Polach Citation1977). Ages were calibrated using the Calib 7.0.2 software and the IntCal13 calibration curve (Reimer et al. Citation2013; in conjunction with Stuiver and Reimer Citation1993) and are given as yrs cal BP.
For tecamoebae (testate amoebae) analysis, about 3 g per sample were suspended in distilled water and passed through a 0.5 mm mesh sieve. Tecameobae shells were identified and counted on glycerin slides under a light microscope (Zeiss Axioskop 2) at 100–400 times magnification. The taxonomic determination and ecological characterization is based on Chardez (Citation1965) and on publications on tecamoebae ecology in Arctic and subarctic environments (Beyens and Bobrov Citation2016; Bobrov et al. Citation2013).
Two Kolyma Delta cores were selected for paleobotanical analysis, 12P-1707-1 (center) and 12P-2107-1 (rim). From each sample approximately 3 g (dry weight) were taken for sample standard preparation (Faegri and Iversen Citation1989) to extract pollen, spores, and non-pollen palynomorphs (NPPs). A Lycopodium spore tablet (Batch nr. 1031; n = 20,848) was added to each sample to calculate pollen concentration (Stockmarr Citation1971). At least 400 terrestrial pollen grains were counted per sample using a light microscope (Zeiss Axioskop 2) under 400 times magnification. Pollen and spore taxonomy is based on Sokolovskaya (Citation1958); Kupriyanova and Alyoshina (Citation1972, Citation1978); Moore, Webb, and Collinson (Citation1991); Beug (Citation2004); and Savelieva, Raschke, and Titova (Citation2013). Identification of NNPs was based on Van Geel et al. (Citation1983), Van Geel (Citation2001), Van Geel and Aptroot (Citation2006), Jankovská and Komárek (Citation2000), and Komárek and Jankovská (Citation2001). The relative pollen frequency is based on tree, shrub, and herb pollen sum. The spore, aquatic taxa, algae, and fungi percentages are based on the sum of pollen and the respective group (e.g., pollen+spores, pollen+fungi; Berglund and Ralska-Jasiewiczowa Citation1986). For macrofossil analysis, only the sample volume available after the KOH (10%) washing step for pollen preparation was used, which includes a 10 min water bath and sieving through 200 µm mesh. All plant remains greater than 200 µm were scanned using a light microscope (Zeiss Axioskop 2) under 100–400 times magnification. Macrofossils were identified based on Dombrovskaya, Koreneva, and Tyuremnov (Citation1959) and a reference collection at AWI Potsdam. The Tilia software (version 1.7.16; Grimm Citation2011) was used for calculating the pollen percentages and for drawing the pollen and macrofossil diagrams.
Results
Cryolithology, dating, and organic matter characteristics
Polygon center deposits
The cores drilled in polygon centers reveal basal ages between 3133 ± 34 and 1720 ± 30 yrs BP (, ). In all four cores peat deposition characterizes the uppermost sections or even the entire core in 12P-2107-2 and started between 2380 ± 30 yrs BP and 1632 ± 32 yrs BP (). Minerogenic deposits are generally characterized by horizontal reticulate to lenticular cryostructures and oversaturated ice content. Increasing δ18O and δD correspond to decreasing d excess values in intrasedimentary ice and are seen in cores 12P-1707-1 and 12P-1907-2 (). The sand fraction is highest in minerogenic deposits, although the deposits are mostly classified as silts. MS remains below 25 SI. OM characteristics are TOC < 10 wt%, TIC < 2 wt%, TN < 1 wt%, and δ13C of TOC around –30‰. The OM inventory has a mean of 33.2 ± 45.4 kg/m3 (median 14.8 kg/m3). The peat of polygon centers differs from the underlying minerogenic deposits by slightly decreasing δ18O and δD and increasing d excess as seen in core 12P-1907-2 () of intrasedimentary ice, which is present in the peat as pseudoataxitic, structureless, or porphyric cryostructures. Silts dominate the grain-size distribution and MS reaches values above 25 SI. TOC, TIC, and TN reach values up to 30 wt%, up to 6 wt%, and up to 2 wt%, respectively. TOC/TN and δ13C are similar to the minerogenic deposits, pointing to a comparable origin and degree of decomposition of OM in both deposit types.
Table 1. Radiocarbon dating of selected permafrost core samples
Figure 2. Sediment and ice data from polygon center permafrost cores. Gray-shaded areas in the plots highlight the peat horizons. The white dots in the δ D column refer to the δ18O values. The black dots in the fraction column refer to the mean grain-size values. Radiocarbon dates and thaw depths are given to the right of the columns
Polygon rim deposits
Polygon rim deposits are captured in two cores whose basal ages reach 1952 ± 32 yrs BP and 2975 ± 30 yrs BP (, ). Both uppermost rim sections are composed of peat, but the peat was accumulated in different time periods, after 325 ± 31 yrs BP in core 12P-2107-1 and around 1765 ± 30 yrs BP in core 12P-1607-1. The latter peat accumulation starting date is comparable to that of the center cores, but exhibits two distinct peat sections intersected by minerogenic deposits (). Reticulated and lenticular cryostructures characterize the minerogenic rim ice-oversaturated deposits with slightly decreasing δ18O and δD and positive d excess, which is opposite to the pattern seen in the minerogenic deposits of the polygon centers. The MS mainly remains below 30 SI and the mean grain size varies between silt and fine-grained sand. As in the polygon center cores, the OM generally shows TOC < 10 wt%, TIC < 2 wt%, TN < 1 wt%, and δ13C of TOC around −27‰, while TOC/TN varies largely between 1.4 and 23.8. The OM inventory has a mean of 9.7 ± 16.1 kg/m3 (median 4.8 kg/m3). The peat deposits were solely analyzed in core 12P-1607-1 in three samples, which differ from the minerogenic deposits in higher TOC, TIC, and TN values. Peat cryostructures are pseudoataxitic or structureless.
Figure 3. Sediment and ice data from polygon rim permafrost cores. Gray-shaded areas in the plots highlight the peat horizons. The white dots in the δ D column refer to the δ18O values. The black dots in the fraction column refer to the mean grain-size values. Radiocarbon dates and thaw depths are given to the right of the columns
Polygon pond deposits
Unfrozen uppermost deposits of polygon ponds are present as a minerogenic section in core S-36 and as mostly peat in core S-20 (). The latter core shows the transition from minerogenic deposits to the topmost peat by decreasing mean grain size from about 40 to 20 µm, higher MS, and increasing TOC, TIC, and TN; TOC/TN and δ13C of TOC show only small variations.
Figure 4. Sediment data from polygon pond deposits. Gray-shaded areas in the plots highlight the peat horizons
Tecamoebae studies
On average, five slides were examined per sample, while the number of identified specimens depends on the sample’s paleo-cenoses tecamoebae density and ranged from 1 to 350 specimens per sample. In 104 samples, a total of 102 tecamoebae taxa were found, which were aligned to three ecological groups; that is, hydrobiontic, sphagnobiontic, and eurybiontic (, Appendix 4). Ecological features of species inhabiting polygon tundra landscapes were taken into account (Bobrov et al. Citation2013). The hydrobionts include obligate hydrophilic species that inhabit open-water bodies and hygrophilic species that occur in temporary wetlands. Sphagnobionts include species preferring oligotrophic Sphagnum moss associations, which can be either xeromorphic (dry) or hygromorphous (moist to wet). Hence, some species belong to both the sphagnobiontic and the hygrophilic (hydrobiontic) groups. Most of the sphagnobionts belong to the hygrophilic (hygromorphous) group, except for Assulina muscorum and Trigonopyxis arcula, which are xeromorphic (Bobrov, Charman, and Warner Citation1999).
Figure 5. Distribution of tecamoebae ecological groups in polygon center, rim, and pond deposits; eurybionts, white; sphagnobionts, gray; and hydrobionts, black
Eurybionts tolerate a wide range of environmental factors and include calcephilic species, such as Cyclopyxis kahli and Centropyxis plagiostoma sensu lato, which were not distinguished graphically as a special ecological group because their sample density was too low, but their presence is a significant bioindicator. Calcephilic species occurrence in samples is, therefore, mentioned when describing environmental conditions. Changes in the ratio of ecological groups indicate changes of environmental conditions, primarily changes in habitat moisture.
Polygon center deposits
In the uppermost sampled part of the 12Kyt-0807-1 core (), from 20 cm to 37 cm, open-water conditions are indicated by the predominance of hydrophilic species, genera Centropyxis, Difflugia, and Lagenodifflugia. From 37 cm to 56 cm wetland conditions with neutral to weakly alkaline pH conditions are indicated by hydrobiontic species such as D. minuta v. minor and C. pontigulasiaformis, and calcephilic species (C. plagiostoma). Tecamoebae were absent from 56 cm to 70 cm. The presence of eurybiontic and sphagnobiontic species at 70–80 cm points to wetland and slightly acidic conditions. At 80–96 cm open-water conditions are deduced by the presence of hydrophilic species (C. gibba and Pyxidicula operculata). The 12Kyt-0807-1 results delineate a succession from open-water to wetland conditions and back to open water.
The tecamoebae record of center core 12P-1701-1 () shows a high diversity of hydrobiontic species of the genera Arcella, Centropyxis, Heleopera, Phryganella, Pyxidiculla, and Difflugia. Neutral to slightly alkaline pH at 61–68 cm and 87–95 cm is indicated by calcephilic species. The sphagnobiontic group predominates at 87–95 cm. Eurybiontic species prevail in all samples.
Similar to core 12P-1701-1, the entire record of 12P-1907-2 () is characterized by prevalent hydrobionts indicating succession from wetland to open-water conditions in a polygon center. Calcephilic species indicate neutral to slightly alkaline pH.
The tecamoebae record of center core 12P-2107-2 exhibits varying proportions of sphagnobiontic, eurybiontic, and hygro-hydrophilic species (). Hydrophilic species are less diverse, with five Difflugia species of which two are not yet described in the scientific literature (D. sp. 1, D. sp. 2). Calcephilic C. plagiostoma and C. kahli indicate neutral to slightly alkaline pH. The tecamoebae association reflects predominantly wetland conditions in a polygon center.
Polygon rim deposits
In its upper part (down to 81 cm) core 12P-1607-1 () is dominated by eurybiontic species of the genera Centropyxis and Cyclopyxis. In its lower part (81–115 cm) it is characterized by hygro-hydrophilic Centropyxis species and hydrophilic Difflugia species. The calcephilic C. plagiostoma f. minor indicates neutral to slightly alkaline pH. The tecamoebae record indicates rim formation by the change from wet to moist conditions.
In core 12P-2107-1 () hygro-hydrophilic Centropyxis and hydrophilic Difflugia species reach high shares above and below 29–34 cm and constitute 100 percent of the identified species at 55 cm. At 29–34 cm eurybiontic Centropyxis, Plagiopyxis, and Schoenbornia species and calcephilic species prevail, likely pointing to drier conditions. Increasing dryness during rim formation is not reflected in the tecamoebae record.
Polygonal pond deposits
The uppermost 0–2 cm of the 9 cm S-36 short core () shows high hydrophilic species diversity with two species of genus Centropyxis (C. cassis v. spinifera, C. gibba) and twenty Difflugia species. Furthermore, five hygro-hydrophilic species of the genera Arcella and Centropyxis and nine eurybiontic species of the genera Centropyxis, Cyclopyxis, and Trinema are present; below 2 cm tecamoebae are lacking or very rare.
The S-20 short core () was sampled from 13–48 cm. The uppermost 13–15 cm shows the highest percentage of hydrophilic Difflugia and sphagnobiontic-hygrophilic Heleopera species. At 15–40 cm the percentage of hydrobionts, sphagnobionts, and eurybionts varies. Most diverse are hydrobionts, with twenty-two species of the genera Centropyxis, Heleopera, Difflugia, and Lagenodifflugia, while only four eurybiontic Centropyxis species are present. The tecamoebae association is interpreted as a polygon pond succession with an upwardly increasing percentage of hydrophilic species.
Paleobotanical analysis
Polygon center deposits
The 12P-1707-1 core exhibits two palynological zones (PZs, ). PZ I (137–95 cm) is dominated by Alnus fruticosa-type, Betula sect. Nanae, Poaceae, and Cyperaceae. Within PZ I, Alnus gradually decreases toward PZ II (from 32% to 18%), while Cyperaceae increases (from 14% to 34%). Poaceae varies from 17 percent to 33 percent. Betula sect. Nanae is almost constant at about 15 percent. Among spores, Sphagnum dominates with ≤3.6 percent. PZ II (95–54 cm) is characterized by decreasing Poaceae (10–16%) and a dominance of Cyperaceae (≤50%). Among shrubs, Alnus fruticosa-type and Betula sect. Nanae dominate. Alnus gradually increases from 16 percent to 29 percent toward the upper part of PZ II. Betula sect. Nanae varies from 14 percent to 21 percent. The presence of a small amount of the freshwater algae Botryoccocus is remarkable.
Figure 6. Results of pollen analysis from center core 12P-1701-1
The study of plant macrofossils revealed three macrofossil zones (MFZs; ), which do not correspond to PZs. Carex rootlets (60–65%), Sphagnum leaves (10–15%), and Salix (periderm, roots, and leaves) predominate in MFZ I (137–116 cm). MFZ II (116–78 cm) is dominated by Carex rootlets (60–85%), Poaceae rootlets (≤25%), and Drepanocladus revolvens (≤35%). The presence of Carex nutlets is also remarkable. MFZ III (78–54 cm) is characterized by a decrease in Poaceae (≤5%) and Carex (from 90% to 20%). Drepanocladus abundance rises up to 60 percent. Sphagnum leaves and periderm fossils from Salix and Betula sect. Nanae appear in MFZ III.
Figure 7. Results of macrofossil analysis of center core 12P-1707-1
Polygon rim deposits
Core 12P-2107-1 was divided into four PZs (). PZ I (118–105 cm) contains high amounts of Cyperaceae (56%), Poaceae (13%), and Potentilla sp. (11%). Shrubs are represented by Alnus fruticosa-type (9%) and Betula sect. Nanae (6%). PZ II (94–64 cm) is characterized by almost absent Potentilla sp. and rising Alnus fruticosa-type (≤17%), Betula sect. Nanae (≤12%), and Salix (≤5%). Cyperaceae (≤60%), Poaceae (≤10%), and Ranunculaceae (≤2%) predominate among herbs and Sphagnum (≤4.5%) among spores. PZ III (64–34 cm) is distinguished by a sharp increase of Poaceae (≤27%) and gradually increasing Potentilla sp. (≤10%). The percentage of Cyperaceae is unchanged (45–50%), while the Poaceae and Potentilla sp. show opposing trends. Betula sect. Nanae, Alnus fruticosa-type, and Salix are still present. PZ IV (34–25 cm) is similar to PZ II, but instead of Ranunculaceae, Ericales (≤4%) appears. Sphagnum spores decrease to 2 percent. Freshwater algae Botryoccocus and Pediastrum occur in PZ II, PZ III, and PZ IV as single specimens only.
Figure 8. Results of pollen analysis from rim core 12P-2107-1
The plant macrofossils of 12P-2107-1 distinguish four MFZs (), which correspond relatively well to the PZs. MFZ I (118–105 cm) contains mainly Carex rootlets (48%), Poaceae rootlets (35%), and Equisetum (10%). MFZ II (94–46 cm) shows a sharp increase of Drepanocladus revolvens (50–78%), a decrease in Carex and Poaceae rootlets, and the presence of Carex nutlets. MFZ III (46–34 cm) is similar to MFZ I, but Equisetum remains are absent, while single Carex nutlets were found. MFZ IV (34–25 cm) is characterized by the predominance of Poaceae rootlets (≤60%) and shrub remains (such as periderms and leaves from Salix and Betula sect. Nanae, and Salix roots).
Figure 9. Results of macrofossil analysis of rim core 12P-2107-1
Discussion
Polygon Succession as Reflected in Center and Rim Cores
Studying active-layer soil pits along a polygon rim-to-center transect, Bobrov et al. (Citation2013) found a relationship between tecamoebae species distribution and soil moisture. Here, soil moisture was found to be controlled by the polygonal micro-relief with elevated, drier rims and lower, wetter centers. Warmer, wetter conditions of the seasonally deeper thawed polygon center caused higher tecamoebae biodiversity compared to the rim. Polygon rims are inhabited by eurybiontic and sphagnobiontic-xerophilic species; centers provide niches for hydrobiontic and sphagnobiontic-hydrophilic species. Changes in the tecamoebae communities, that is, the varying representation of the three main ecological groups, indicate changes in the developing polygon. First, rims grow and centers deepen, creating a rim-to-center gradient in soil moisture. Later, polygons silt up or central open-water bodies grow; their paludification and/or collapsing rims can further alter the moisture pattern within the polygon. For instance, the tecamoebae record of the 12P-1701-1 polygon center core shows a high diversity of hydrobiontic species, pointing to a succession from wetland to open-water conditions, which further coincides with the onset of peat accumulation in the polygon center. The paleovegetation inferred from pollen analysis indicate relative dry conditions (PZ I in ) with a dominance of Poaceae, Alnus, Betula, Cyperaceae, and Sphagnum. Similar results are described by de Klerk et al. (Citation2011) from a rim core in the Indigirka Lowland near Chokurdakh. This is also supported by the presence of Sphagnum, Salix, and Carex plant macrofossils (MFZ I in ). Increased moisture in the upper part of the core is reflected by dominating Cyperaceae pollen (PZ II in ) and abundant Carex rootlets and nutlets (MFZ II and MFZ III in ). The presence of Botryoccocus algae in PZ II and increasing Drepanocladus moss remains in MFZ II and MFZ III also point to a wet setting (Teltewskoi et al. Citation2016) and peat accumulation in the polygon since about 1676 ± 32 yrs BP.
The rim core 12P-2107-1 differentiates into four zones in both the pollen and the macrofossil record ( and ). Dominance of Cyperaceae pollen in all PZs reflects wet conditions during the accumulation time. High values of Cyperaceae and Potentilla sp. pollen together with abundance of Carex and Poaceae rootlets and the presence of Equesetum indicate an initial accumulation under wet conditions or even in water (in agreement with silt layers), probably in the rim-to-pond transition zone (de Klerk et al. Citation2011). The predominance of Drepanocladus remains and Carex nutlets in MFZ II, together with high proportions of Cyperaceae and the presence of algae in PZ II, point to an episode of stable wet settings favorable for peat accumulation. Dominating hydrobiontic tecamoebae support this interpretation (). Relative high values of Poaceae pollen in PZ III and PZ IV () and an abundance of Poaceae rootlets and shrub remains in MFZ III and MFZ IV () reflect drying associated with the heaving polygon rim, where willow and dwarf birch grew. The formation of the polygon rim around 1892 ± 32 yrs BP coincides with polygon center deepening, peat accumulation, and open-water conditions as shown in the cryolithological and tecamoebae records of the center core from the same polygon (12P-2107-2) since about 1720 ± 30 yrs BP.
Generally, polygon center cores from the Pokhodsk area reflect the transition from wetland to open-water conditions during a relatively short period between 2380 ± 30 and 1676 ± 32 yrs BP. The low-center polygon formation was accompanied by growing rims and deepening centers in which peat accumulated in ponded water. A later stage of polygon micro-relief development is recorded in the Kytalyk area (Indigirka Lowland) center core. Here, the transition from pond to wetland conditions (low-center to high-center polygon) is recorded due to siltation or paludification within about 500 years between 2144 ± 33 and 1632 ± 32 yrs BP.
The timing and rate of polygon formation is, however, highly dependent on local climatic and hydrological conditions, limiting the comparability of records from different study areas. Decadal to centennial changes in the polygon micro-relief, and consequently in the wetness of different polygon compartments, were found in a high-resolution multi-proxy study by Teltewskoi et al. (Citation2016) in the Indigirka Lowland. Wet episodes as reflected by pollen, plant macro-fossil, and tecamoebae data span between 3630 ± 40 and 2040 ± 60 yrs BP. Similar results might be deduced from our records even though the sampling resolution is lower and uppermost active-layer samples are mostly lacking.
OM characteristics
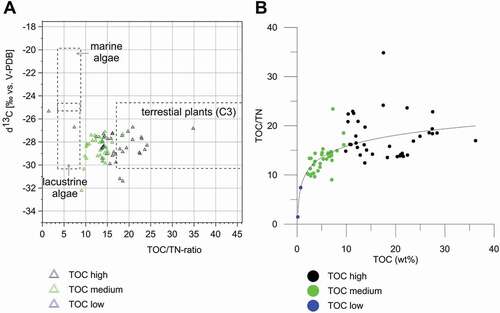
The TOC, TOC/TN ratios, and δ13C values of all core samples () range widely. TOC ranges from 0.15 wt% to 36.2 wt%, with a median of 9.7 wt%. TOC/TN ratios vary between strongly decomposed (TOC/TN of 1.4) and undecomposed OM (TOC/TN of 34.8), with a median of 14.2. δ13C values range between −32.22‰ and −25.3‰ (median −28.3‰). According to Meyers (Citation1997) the relationship between TOC/TN and δ13C reflects the existence of lacustrine algae and terrestrial C3 plants (); many points fall in between, which is not unexpected in polygons. High TOC (10–36 wt%) is close to the values associated with terrestrial plants, and falls in the transition zone between lacustrine and terrestrial plants. Medium TOC points (2–9 wt%) cluster in the area of lacustrine algae. Two samples with TOC less than 1 wt% are outside of the areas associated with different organisms. The relationship between TOC and the TOC/TN ratio () shows that low TOC and low TOC/TN indicate strongly degraded OM, medium TOC and higher TOC/TN indicate less OM degradation, and high TOC and high TOC/TN indicate almost no OM degradation. The correlation curve of Y = 3.225 × ln(X) + 8.41 (n = 79) has an r2 of 0.411. This probably reflects different degrees of OM decomposition and different stages of polygon development.
Figure 10. OM characteristics of polygon cores from the Indigirka Lowland and the Kolyma Delta. (A) distribution of the TOC/TN ratio: δ13CTOC relationships according to Meyers (Citation1997). (B) correlation of TOC and the TOC/TN ratio
When we calculate the OM inventory according to Strauss et al. (Citation2012), we find that the upper peaty parts of the studied cores down to 70 cm depth contain more TOC, up to 173.5 kg/m3, while the lower minerogenic parts contain less than 20 kg/m3 (). When comparing polygon center and rim records (), the OM inventory of the centers is much higher (median 14.8 kg/m3, n = 16) than under the rims (median 4.8 kg/m3, n = 8). These new data contribute to the Northern Circumpolar Soil Carbon Database (Hugelius et al. Citation2014, Citation2013) and extend the OM permafrost inventory estimation of Arctic deltaic and floodplain deposits.
Figure 11. (A) OM inventory of the polygon cores and (B) box-whisker plots of center (n = 16) and rim (n = 8) samples
Late Holocene Polygon Landscapes
The records from polygon centers reflect different episodes of development. The Pokhodsk area center cores reflect the transition from wetland to open-water conditions in the Kolyma Delta during more than 1,500 years between 3190 ± 30 and 1676 ± 32 yrs BP. Such processes, accompanied by wall formation and center deepening and ponding, are typical for the initial polygon micro-relief development phase (MacKay Citation2000). A later stage is recorded in the Kytalyk area (Indigirka Lowland) center core, which shows micro-relief dynamics from pond to wetland conditions, reflecting the siltation or paludification of a polygon pond within about 500 years between 2144 ± 33 and 1632 ± 32 yrs BP. The timing and rate of polygon formation is, however, highly dependent on local climatic and hydrological conditions, limiting the comparability of records from different study areas. A general pattern of initial polygon formation and transition from wetland to pond conditions starting around 3200 yrs BP is reflected in cores 12P-1907-2 and 12P-1701-1, while core 12P-2107-2 records wetland conditions since at least ≈1700 yrs BP. The pond-to-wetland transition as found in core 12Kyt-0807-1 started around 2100 yrs BP and represents the subsequent stage in polygon formation. Less pronounced but nevertheless recognizable are the signals from polygon rim records reflecting wet to moist or dry conditions in connection with wall formation during about 2,600 years between 2975 ± 30 and 325 ± 31 yrs BP in the Kolyma Delta.
Fast changes in micro-relief throughout several hundred years, and consequently in wetness of different polygon compartments, were found in the high-resolution multi-proxy study of Teltewskoi et al. (Citation2016). Wet episodes reflected by pollen, plant macro-fossil, and tecamoebae data span between 3630 ± 40 and 2040 ± 60 yrs BP.
Conclusions
The presented cores from ice-wedge polygon centers and rims of the Indigirka Lowland and the Kolyma Delta cover the late Holocene period between 3190 ± 30 and 325 ± 31 yrs BP. This is similar in range to polygon studies from the Canadian Arctic (Fritz et al. Citation2016) and the Indigirka Lowland (de Klerk et al. Citation2011; Teltewskoi et al. Citation2016). According to cryolithological records there is a clear differentiation between minerogenic and peat horizons. In the Kolyma Delta, center cores show a transition from wetland to open water between 2380 ± 30 and 1676 ± 32 yrs BP. The formation of low-center polygons was accompanied by growing rims and deepening centers with peat accumulation. The Indigirka Lowland center core shows a later stage, the transition from pond to wetland conditions is recorded because of siltation or paludification between 2144 ± 33 and 1632 ± 32 yrs BP.
Varying occurrence of the three ecological tecamoebae groups indicate changes in the developing polygons. Rims were inhabited by eurybiontic and sphagnobiontic-xerophilic communities, while centers provide niches for hydrobiontic and sphagnobiontic-hydrophilic organisms. The tecamoebae record in polygon centers is interpreted as reflecting changes from wetland to open-water conditions. Similar conclusions will be drawn from paleobotanical records where Poaceae-, Alnus-, and Betula-dominated pollen spectra change to Cyperaceae-dominated, with the presence of Botryoccocus and Carex and Drepanocladus revolvens macro-fossils.
Finally, the OM inventory calculation shows a clear differentiation of higher OM content in polygon centers compared to polygon rims.
Data availability
Analytical data are available at doi.pangaea.de/10.1594/PANGAEA.887933.
Supplementary Appendices
Download Zip (5.1 MB)Acknowledgments
The field studies in 2012 were supported by several Russian and German institutions and authorities. In particular, we thank the Committee of Nature Conservation in Chokurdakh (Tatyana Stryukova), the Pokhodsk administration, the Arbatsky family in Pokhodsk, the Northeastern Federal University (especially Mikhail Cherosov), colleagues from the Northeast Science Station in Cherskii, and Alexey Pestryakov, our most important logistic support contact in Yakutsk. The studies in Kytalyk were realized together with Dutch groups from the Vrije Universiteit Amsterdam (led by Ko van Huissteden) and the University of Wageningen (led by Monique Heijmans). In addition we thank the colleagues who helped to obtain the cores and to analyze several parameters in the field, including Vladimir Tumskoy, Evgeniya Zhukova, Lilit Pogosyan, Fabian Beermann, Viktor Sitalo, and Andrea Schneider. The manuscript preparation and revision greatly benefited by valuable comments and English-language correction from Candace O’Connor (Fairbanks, Alaska, USA).
Supplementary material
Supplemental data for this article can be accessed here.
Additional information
Funding
Related Research Data
References
- ACIA. 2004. Impacts of a warming arctic: arctic climate impact assessment, 1. Cambridge: University Press.
- Andreev, A. V. 2001. Wetlands in Northeastern Russia (Wetlands in Russia, volume 4), 296 pp. Moscow, Russia: WWF, Wetlands International Programme.
- Andresen, C. G., and V. L. Lougheed. 2015. Disappearing Arctic tundra ponds: Fine-scale analysis of surface hydrology in drained thaw lake basins over a 65 year period (1948–2013). Journal of Geophysical Research: Biogeosciences 120:466–18. doi:https://doi.org/10.1002/2014JG002778.
- Beermann, F., M. Langer, S. Wetterich, J. Strauss, J. Boike, C. Fiencke, L. Schirrmeister, E. M. Pfeiffer, and L. Kutzbach. 2017. Permafrost thaw and liberation of inorganic nitrogen from polygonal tundra soils in eastern Siberia. Permafrost and Periglacial Processes 28:605–18. doi:https://doi.org/10.1002/ppp.1958.
- Beermann, F., A. Teltewskoi, C. Fiencke, E.-M. Pfeiffer, and L. Kutzbach. 2015. Stoichiometric analysis of nutrient availability (N, P, K) within soils of polygonal tundra. Biogeochemistry 122:211–27. doi:https://doi.org/10.1007/s10533-014-0037-4.
- Berglund, B. E., and M. Ralska-Jasiewiczowa. 1986. Pollen analysis and pollen diagrams. In Handbook of Holocene palaeoecology and palaeohydrology, ed B. E. Berglund, 455–84. Chichester: Wiley.
- Beug, H.-J. 2004. Leitfaden der Pollenbestimmung für Mitteleuropa und angrenzende Gebiete. 542 pp. München: Verlag Dr. Friedrich Pfeil. (in German).
- Beyens, L., and A. Bobrov. 2016. Evidence supporting the concept of a regionalized distribution of testate amoebae in the Arctic. Acta Protozoologica, Polska Akademia Nauk 55 (4):197–209.
- Bobrov, A. A., A. A. Andreev, L. Schirrmeister, and C. Siegert. 2004. Testate amoebae (Protozoa: Testacealobosea and Testaceafilosea) as bioindicators in the Late Quaternary deposits of the Bykovsky Peninsula, Laptev Sea, Russia. Palaeogeography, Palaeoclimatology, Palaeoecology 209:165–81. doi:https://doi.org/10.1016/J.PALAEO.2004.02.012.
- Bobrov, A. A., D. J. Charman, and B. G. Warner. 1999. Ecology of testate amoebae (Protozoa: Testacea) on peatlands in Western Russia with special attention to niche separation in closely related taxa. Protistology 150:125–36. doi:https://doi.org/10.1016/S1434-4610(99)70016-7.
- Bobrov, A. A., S. Wetterich, F. Beermann, A. Schneider, L. Kokhanova, L. Schirrmeister, L. Pestryakova, and U. Herzschuh. 2013. Testate amoebae and environmental features of polygon tundra in the Indigirka lowland (East Siberia). Polar Biology 36:857–70. doi:https://doi.org/10.1007/s00300-013-1311-y.
- Bockheim, J. G., L. K. M. Hinkel, W. R. Eisner, and X. Y. Dai. 2004. Carbon pools and accumulation rates in an age-series of soils in drained thaw-lake basins, Arctic Alaska. Soil Science Society of America Journal 68:697–704. doi:https://doi.org/10.2136/sssaj2004.6970.
- CAVM Team. 2003. Circumpolar Arctic vegetation map, scale 1:7.500.000. Anchorage, Alaska: Conservation of Arctic Flora and Fauna (CAFF) Map No.1. U.S. Fish and Wildlife Service. http://www.geobotany.uaf.edu/cavm/finalcavm/index.html.
- Chardez, D. 1965. Ecologie generale des Thecamoebiens (Rhizopoda, Testacea). Bulletin De l’Institut Agronomigue Et Des Stations De Recherches Gembloux 3:306–41.
- Dansgaard, W. 1964. Stable isotopes in precipitation. Tellus 16:436–68.
- de Klerk, P., N. Donner, H. Joosten, N. S. Karpov, M. Minke, N. Seifert, and M. Theuerkauf. 2004. Vegetation patterns, recent pollen deposition and distribution of non-pollen palynomoprhs in a polygon mire near Chokurdakh (NE Yakutia, NE Siberia). Boreas 38:39–58. doi:https://doi.org/10.1111/j.1502-3885.2008.00036.x.
- de Klerk, P., N. Donner, H. Joosten, N. S. Karpov, M. Minke, N. Seifert, and M. Theuerkauf. 2009. Vegetation patterns, recent pollen deposition and distribution of non-pollen palynomorphs in a polygon mire near Chokurdakh (NE Yakutia, NE Siberia). Boreas 38:39–58. doi:https://doi.org/10.1111/j.1502-3885.2008.00036.x.
- de Klerk, P., N. Donner, N. S. Karpov, M. Minke, and H. Joosten. 2011. Short-term dynamics of a low-centred ice-wedge polygon near Chokurdakh (NE Yakutia, NE Siberia) and climate change during the last ca 1250 years. Quaternary Science Reviews 30:3013–31. doi:https://doi.org/10.1016/j.quascirev.2011.06.016.
- de Klerk, P., A. Teltewskoi, M. Theuerkauf, and H. Joosten. 2014. Vegetation patterns, pollen deposition and distribution of non-pollen palynomorphs in an ice-wedge polygon near Kytalyk (NE Siberia), with some remarks on Arctic pollen morphology. Polar Biology 37:1393–412. doi:https://doi.org/10.1007/s00300-014-1529-3.
- de Klerk, P., M. Theuerkauf, and H. Joosten. 2017. Vegetation, recent pollen deposition, and distribution of some non-pollen palynomorphs in a degrading ice-wedge polygon mire complex near Pokhodsk (NE Siberia), including size-frequency analyses of pollen attributable to Betula. Review of Palaeobotany and Palynology 238:122–43. doi:https://doi.org/10.1016/j.revpalbo.2016.11.015.
- Dombrovskaya, A. V., M. M. Koreneva, and S. N. Tyuremnov. 1959. Atlas rastitel’nyh ostatkov, vstrechaemyh v torfe (Atlas of plant remains found in peat). 228 pp. Moskow, Leningrad: Gosudarstvennoe energeticheskoe izdatel’stvo. (in Russian).
- Ellis, C. J., and L. Rochefort. 2006. Long-term sensitivity of a high Arctic wetland to Holocene climate change. Journal of Ecology 94:441–54. doi:https://doi.org/10.1111/j.1365-2745.2005.01085.x.
- Ellis, C. J., L. Rochefort, G. Gauthier, and R. Pienitz. 2008. Paleoecological evidence for transitions between contrasting landforms in a polygon-patterned high arctic wetland. Arctic, Antarctic, and Alpine Research 40:624–37. doi:https://doi.org/10.1657/1523-0430(07-059)[ELLIS]2.0.CO;2.
- Faegri, K., and J. Iversen. 1989. Textbook of pollen analysis. ( Fourth Edition by Faegri, K., Kaland, P.E., and Krzywinski, K.), 328 pp. New York: John Wiley & Sons.
- Fortier, D., and M. Allard. 2004. Late holocene syngenetic ice-wedge polygons development, Bylot Island, Canadian Arctic Archipelago. Canadian Journal of Earth Sciences 41:997–1012. doi:https://doi.org/10.1139/e04-031.
- French, H., and Y. Shur. 2010. The principles of cryostratigraphy. Earth Science Reviews 101:190–206. doi:https://doi.org/10.1016/j.earscirev.2010.04.002.
- Fritz, M., J. Wolter, N. Rudaya, O. Palagushkina, L. Nazarova, J. Obu, J. Rethemeyer, H. Lantuit, and S. Wetterich. 2016. Holocene ice-wedge polygon development in the northern Yukon, Canada. Quaternary Science Reviews 147:279–97. doi:https://doi.org/10.1016/j.quascirev.2016.02.008.
- Geocryological Map of the USSR. 1991. 1: 2,500,000, Moscow State University.
- Grimm, E. C. 2011. TILIA software version 1.7.16. Springfield, USA: Illinois State Museum, Research and Collection Center.
- Helbig, M., J. Boike, M. Langer, P. Schreiber, B. R. K. Runkle, and L. Kutzbach. 2013. Spatial and seasonal variability of polygonal tundra water balance: Lena River Delta, northern Siberia (Russia). Hydrogeology Journal 21 (1):133–47. doi:https://doi.org/10.1007/s10040-012-0933-4.
- Hobbie, J. E. ed. 1980. Limnology of tundra ponds, Barrow, Alaska, US/IBP Synthesis Series, Vol. 13, 513 pp. Stroufburg, PA: Dowden, Hutchison & Ross Inc.
- Hobbie, J. E., B. J. Peterson, N. Bettez, L. Deegan, J. O’Brien, G. W. Kling, and G. W. Kipphut. 1999. Impact of global change on biogeochemistry and ecosystems of arctic Alaska freshwaters. Polar Research 18:207–14. doi:https://doi.org/10.1111/j.1751-8369.1999.tb00295.x.
- Hugelius, G., J. Strauss, S. Zubrzycki, J. W. Harden, E. A. G. Schuur, C. L. Ping, L. Schirrmeister, G. Grosse, G. J. Michaelson, C. D. Koven, J. A. O’Donnell, B. Eberling, U. Mishra, P. Camill, Z. Yu, J. Palmtag, and P. Kuhry. 2014. Estimated stocks of circumpolar permafrost carbon with quantified uncertainty ranges and identified data gaps. Biogeosciences 11:6573–93. doi:https://doi.org/10.5194/bg-11-6573-2014.
- Hugelius, G., C. Tarnocai, J. G. Bockheim, G. Camill, B. Elberling, G. Grosse, J. Harden, K. Johnson, T. Jorgenson, C. D. Koven, P. Kuhry, P. Michaelson, U. Mishra, J. Palmtag, C.-L. Ping, J. O’Donnel, L. Schirrmeister, E. A. G. Schuur, Y. J. Sheng, L. C. Smith, J. Strauss, and Z. Yu. 2013. A new dataset for estimating organic carbon storage to 3 m depth in soils of the northern circumpolar permafrost region. Earth System Science Data 5:393–402. doi:https://doi.org/10.5194/essd-5-393-2013.
- Jankovská, V., and J. Komárek. 2000. Indicative value of Pediastrum and other coccal green algae in palaeoecology. Folia Geobotanica 35:59–82. doi:https://doi.org/10.1007/BF02803087.
- Jorgenson, M. T., Y. L. Shur, and E. R. Pullman. 2006. Abrupt increase in permafrost degradation in Arctic Alaska. Geophysical Research Letters 33:L02503. doi:https://doi.org/10.1029/2005GL024960.
- Katasonov, E. M. 1975. Frozen-ground and facies analysis of Pleistocene deposits and paleogeography of Central Yakutia. Biuletyn Peryglacjalny 24:33–40.
- Komárek, J., and V. Jankovská. 2001. Review of the green algal genus Pediastrum; Implication for pollen-analytical research, Bibliotheca Phycologica, Band 108, 127 pp. Berlin: Gebrüder Borntraeger Verlagsbuchhandlung.
- Kupriyanova, L. A., and L. A. Alyoshina. 1972. Pollen and spores of plants from the flora of European part of USSR. Vol. I, 166 pp. Leningrad: Academy of Sciences USSR, Komarov Botanical Institute. (in Russian).
- Kupriyanova, L. A., and L. A. Alyoshina. 1978. Pollen and spores of plants from the flora of European part of USSR. Lamiaceae-Zygophyllaceae. 184 pp. Leningrad: Academy of Sciences USSR, Komarov Botanical Institute. (in Russian).
- Lara, M. J., A. D. McGuire, E. S. Euskirchen, C. E. Tweedie, K. M. Hinkel, A. N. Skurikhin, V. E. Romanovsky, G. Grosse, W. R. Bolton, and H. Genet. 2015. Polygonal tundra geomorphological change in response to warming alters future CO2 and CH4 flux on the Barrow Peninsula. Global Change Biology 21:1634–51. doi:https://doi.org/10.1111/gcb.12757.
- Liljedahl, A. K., J. Boike, R. P. Daanen, A. N. Fedorov, G. V. Frost, G. Grosse, L. D. Hinzman, Y. Iijma, J. C. Jorgenson, N. Matveyeva, M. Necsoiu, M. K. Raynolds, V. E. Romanovsky, J. Schulla, K. D. Tape, D. A. Walker, C. J. Wilson, H. Yabuki, and D. Zona. 2016. Pan-Arctic ice-wedge degradation in warming permafrost and its influence on tundra hydrology. Nature Geoscience 9 (4):312–18. doi:https://doi.org/10.1038/ngeo2674.
- Lougheed, V. L., M. G. Butler, D. C. McEwen, and J. E. Hobbie. 2011. Changes in tundra pond limnology: Re-sampling Alaskan ponds after 40 Years. Ambio 40:589–99. doi:https://doi.org/10.1007/s13280-011-0165-1.
- MacKay, R. 2000. Thermally induced movements in ice-wedge polygons, western arctic coast: A long-term study. Géographie Physique et Quaternaire 54 (1):41–68. doi:https://doi.org/10.7202/004846ar.
- Meyers, P. A. 1997. Organic geochemical proxies of paleoceanographic, paleolimnologic, and paleoclimatic processes. Organic Geochemistry 27:213–50.
- Minke, M., N. Donner, N. Karpov, P. de Klerk, and H. Joosten. 2009. Patterns in vegetation composition, surface height and thaw depth in polygon mires in the Yakutian Arctic (NE Siberia): A microtopographical characterisation of the active layer. Permafrost and Periglacial Processes 20:357–68. doi:https://doi.org/10.1002/ppp.663.
- Minke, M., N. Donner, N. S. Karpov, P. de Klerk, and H. Joosten. 2007. Distribution, diversity, development and dynamics of polygon mires: examples from Northeast Yakutia (Siberia). Peatlands International 2007 (1):36–40.
- Moore, P. D., J. A. Webb, and M. E. Collinson. 1991. Pollen analysis, 216 pp. London: Blackwell Scientific.
- Morse, P. D., and C. R. Burn. 2013. Field observations of syngenetic ice wedge polygons, outer Mackenzie Delta, western Arctic coast. Canada, Journal of Geophysical Research: Earth Surface 118:1320–32. doi:https://doi.org/10.1002/jgrf.20086.
- Murton, J. B., and H. M. French. 1994. Cryostructures in permafrost, Tuktoyaktuk coastlands, western arctic Canada. Canadian Journal of Earth Sciences 31 (4):737–47. doi:https://doi.org/10.1139/e94-067.
- Reimer, P. J., E. Bard, A. Bayliss, J. W. Beck, P. G. Blackwell, C. Bronk Ramsey, C. E. Buck, H. Cheng, R. L. Edwards, M. Friedrich, P. M. Grootes, T. P. Guilderson, H. Haflidason, I. Hajdas, C. Hatté, T. J. Heaton, A. G. Hogg, K. A. Hughen, K. F. Kaiser, B. Kromer, S. W. Manning, M. Niu, R. W. Reimer, D. A. Richards, E. M. Scott, J. R. Southon, C. S. M. Turney, and J. Van Der Plicht. 2013. IntCal13 and MARINE13 radiocarbon age calibration curves 0–50000 years cal BP. Radiocarbon 55:1869–87. doi:https://doi.org/10.2458/azu_js_rc.55.16947.
- Reineck, H.-E., and I. B. Sing. 1980. Depositional sedimentary environments, 2nd rev. and updated ed., 551 pp. Berlin, Heidelberg: Springer.
- Rethemeyer, J., R.-H. Fülöp, S. Höfle, L. Wacker, S. Heinze, I. Hajdas, U. Patt, S. König, B. Stapper, and A. Dewald. 2013. Status report on sample preparation facilities for 14C analysis at the new CologneAMS center. Nuclear Instruments and Methods in Physics Research, B 294:168–72. doi:https://doi.org/10.1016/j.nimb.2012.02.012.
- Savelieva, L. A., E. A. Raschke, and D. V. Titova. 2013. Photographic atlas of plants and pollen of the Lena River Delta, 111 pp. St-Petersburg: St-Petersburg State University. (in Russian).
- Schirrmeister, L., L. Pestryakova, A. Schneider, and S. Wetterich, eds. 2016. Studies of polygons in Siberia and Svalbard. Berichte zur Polar- und Meeresforschung = Reports on polar and marine research, vol. 697, 275 pp. Bremerhaven: Alfred Wegener Institute for Polar and Marine Research.
- Schneider, A., S. Wetterich, L. Schirrmeister, U. Herzschuh, H. Meyer, and L. A. Pestryakova. 2016. Freshwater ostracods (Crustacea) of polygon tundra in the Indigirka Lowland (northeast Siberia). Polar Research 35:25225. doi:https://doi.org/10.3402/polar.v35.25225.
- Sokolovskaya, A. P. 1958. Vegetation of Far North and its development. In Pollen of the Arctic Plants, 245–92. Moscow-Leningrad: Komarov Botanical Institute, Academy of Sciences USSR. (in Russian).
- Stockmarr, J. 1971. Tablets with spores used in absolute pollen analysis. Pollen et Spores 13:614–21.
- Strauss, J., L. Schirrmeister, S. Wetterich, A. Borchers, and S. P. Davydov. 2012. Grain-size properties and organic-carbon stock of Yedoma Ice Complex permafrost from the Kolyma lowland, northeastern Siberia. Global Biogeochemical Cycles 26:GB3003. doi:https://doi.org/10.1029/2011GB004104.
- Stuiver, M., and H. A. Polach. 1977. Discussion: Reporting of 14C data. Radiocarbon 19:355–63.
- Stuiver, M., and P. J. Reimer. 1993. Extended 14Cdata base and revised calib 3.014c age calibration program. Radiocarbon 35:215–30.
- Teltewskoi, A., F. Beermann, I. Beil, A. Bobrov, P. D. Klerk, S. Lorenz, A. Lüder, D. Michaelis, and H. Joosten. 2016. 4000 years of changing wetness in a permafrost polygon peatland (Kytalyk, NE Siberia): A comparative high-resolution multi-proxy study. Permafrost and Periglacial Processes 27 (1):76–95. doi:https://doi.org/10.1002/ppp.1869.
- van Geel, B. 2001. Non-pollen palynomorphs. In Tracking environmental change using lake sediments. Vol. 3: Terrestrial, algal and silicaceous indicators, eds. J. P. Smol, H. J. B. Birks, W. M. Last, R. S. Bradley, and K. Alverson, 99–119. Dordrecht: Kluwer.
- van Geel, B., and A. Aptroot. 2006. Fossil ascomycetes in Quaternary deposits. Nova Hedwigia 82:313–29. doi:https://doi.org/10.1127/0029-5035/2006/0082-0313.
- van Geel, B., D. P. Hallewas, and J. P. Pals. 1983. A late holocene deposit under the Westfriese Zeedijk near Enkhuizen (Prov. of Noord-Holland, The Netherlands): Palaeoecological and archaeological aspects. Review of Palaeobotany and Palynology 38:269–335.
- Wenthworth, C. K. 1922. A scale of grade and class terms for clastic sediments. The Journal of Geology 30 (5):377–92. doi:https://doi.org/10.1086/622910.
- Wetterich, S., L. Schirrmeister, L. Nazarova, O. Palagushkina, A. Bobrov, L. Pogasyan, L. Savelieva, L. Syrykh, H. Matthes, M. Fritz, F. Günther, and T. Opel. under review. Holocene thermokarst and pingo development in the Kolyma Lowland (NE Siberia). In Permafrost and Periglacial Processes. Hoboken, NJ: Wiley
- Wolfe, B. B., E. M. Light, M. L. Macrae, R. I. Hall, K. Eichel, S. Jasechko, J. White, L. Fishback, and T. W. D. Edwards. 2011. Divergent hydrological responses to 20th century climate change in shallow tundra ponds, western Hudson Bay Lowlands. Geophysical Research Letters 38:L23402. doi:https://doi.org/10.1029/2011GL049766.
- Wolter, J., H. Lantuit, M. Fritz, M. Macias-Fauria, I. Myers-Smith, and U. Herzschuh. 2016. Vegetation composition and shrub extent on the Yukon coast, Canada, are strongly linked to ice-wedge polygon degradation. Polar Research 35 (1):27489. doi:https://doi.org/10.3402/polar.v35.27489.
- Woo, M., D. K. Thompson, X. J. Guan, and K. L. Young. 2008. Hydrology, hydrochemistry, and vegetation of a High Arctic wetland complex. In Proceedings of the 9th international conference on permafrost (NICOP), eds. D. L. Kane, and K. M. Hinkel, 1951–56. Fairbanks: Institute of Northern Engineering University of Alaska Fairbanks.
- Worldwide Bioclimatic Classification System. 1996-2017. S.Rivas-Martinez & S.Rivas-Saenz, Phytosociological Research Center, Spain. http://www.globalbioclimatics.org
- Young, K. I., and A. Abnizova. 2008. Hydrologic status of high arctic ponds in a continuous permafrost environment, Somerset Island, Nunavut, Canada. In Proceedings of the 9th international conference on permafrost (NICOP), eds. D. L. Kane, and K. M. Hinkel, 2003–08. Fairbanks: Institute of Northern Engineering University of Alaska Fairbanks.
- Zibulski, R., U. Herzschuh, L. A. Pestryakova, J. Wolter, S. Müller, N. Schilling, S. Wetterich, L. Schirrmeister, and F. Tian. 2013. River flooding as a driver of polygon dynamics: Modern vegetation data and a millennial peat record from Anabar River lowlands (Arctic Siberia). Biogeosciences 10:5703–28. doi:https://doi.org/10.5194/bg-10-5703-2013.
- Zubrzycki, S., L. Kutzbach, G. Grosse, A. Desyatkin, and E.-M. Pfeiffer. 2013. Organic carbon and total nitrogen stocks in soils of the Lena River Delta. Biogeosciences 10:3507–24. doi:https://doi.org/10.5194/bg-10-3507-2013.