
ABSTRACT
Burrowing mammals can be ecosystem engineers by increasing soil aeration and erosion and altering the structure of plant communities. Studies that characterize the constraints on the distributions of fossorial mammal disturbances to soil can help predict changes in ecosystem engineering under future climates. We quantified the density of soil disturbances caused by Thomomys talpoides (northern pocket gopher) over replicate elevation gradients spanning 2,700–4,000 m a.s.l. in the Upper Gunnison Basin, Colorado, USA. As a conceptual framework for predicting biogeographic variation in soil disturbance, we used the abundant center hypothesis (ACH), which proposes that species abundance declines monotonically away from the most abundant location in its distribution, with the assumption that ecosystem engineering scales with gopher abundance. We also evaluated the relative importance of abiotic and biotic variables as correlates of soil disturbance. Gopher disturbance peaked at mid elevations (~3,150 m), supporting the ACH. The best model for predicting gopher-caused soil disturbance contained both abiotic and biotic variables, with increased soil disturbance where mean annual temperature, forb cover, and plant diversity were greatest. Results suggest that mountain ecosystems may experience increases in gopher-caused soil disturbance as climate warms, possibly accompanied by increases in plant diversity and forb cover.
Introduction
Burrowing mammals can have large effects on ecosystems that cascade to soil physical properties, plant composition, and primary productivity. However, little is known about the distribution and abundance patterns of bioturbations caused by fossorial mammals. The northern pocket gopher (Thomomys talpoides, Geomyidae; hereafter, pocket gopher or gopher) is an ecosystem engineer that creates physical soil disturbances (e.g., eskers, tunnels, mounds) by burrowing belowground and pushing subsoil to the surface. Gopher disturbances loosen the soil (Butler and Butler Citation2009; Turner et al. Citation1973), which can increase water infiltration (Hansen and Morris Citation1968; but see Yurkewycz et al. Citation2014) and soil erosion (Sherrod and Seastedt Citation2001). Pocket gophers dig an elaborate network of tunnels (Knight Citation2009), and, on average, can excavate 26.1 m3/ha a year of soil (Smallwood and Morrison, Citation1999). This large soil disturbance creates multiple microenvironments (Huntly and Inouye Citation1988). For example, pocket gopher disturbance can raise median subsurface temperatures while decreasing median surface temperatures when compared to undisturbed soils (Whitesides and Butler Citation2016). Furthermore, burrowing and plant foraging by pocket gophers can influence succession and plant species composition (Reichman and Seabloom Citation2002; Sherrod, Seastedt, and Walker Citation2005). Pocket gophers will come to the surface to cut plants away from their tunnel openings, and their diet includes bulbs, roots, tubers, and, occasionally, aboveground plant tissues (Rios and Álvarez-Castañeda Citation2007). For example, in the high elevations of central Utah (3,000–3,400 m), gophers primarily consumed and cut dandelion (Taraxacum officinale), penstemon (Penstemon rydbergii), sweet sage (Artemisia discolor), and yarrow (Achillea lanulosa) (Aldous Citation1951).
Despite the ecological dominance of the pocket gopher and its documented impacts on plant community structure, ecosystem processes, and geomorphology, little is known about the ecology and distribution of pocket gophers or their ecosystem engineering effects at high elevations. Although the range of pocket gophers can extend to approximately 3,800 m a.s.l., most studies have focused on low elevations (<2,500 m; e.g., Case, Halpern, and Levin Citation2013; Huntly and Inouye Citation1988). Among past observational studies, the highest elevation with reported data on pocket gopher abundance or incidence was 3,962 m (). Most prior studies examined a single altitudinal gradient (one mountain), and the lack of replication limits inference on the influence of elevation per se, because other factors could drive patterns along a single gradient. Most studies only acquired presence data or did not perform statistics on abundance patterns (). Furthermore, many prior studies included few sites along the altitudinal gradient, precluding the ability to detect nonlinear patterns, such as a hump-shaped distribution with elevation. Theory on species abundance patterns predicts the possibility of a quadratic relationship: the abundant center hypothesis (ACH; Brown Citation1995; Gaston Citation2003) proposed that a species abundance declines monotonically away from the most abundant location within its range. Thus, additional data are needed to examine biogeographic patterns in light of existing theory.
Table 1. Summary of prior studies documenting the distribution of northern pocket gophers (Thomomys talpoides) along elevation gradients
Climate factors associated with elevation could influence pocket gopher distributions in mountain ecosystems either directly by affecting their physiology or indirectly by affecting their food resources. In the Colorado Rocky Mountains, air temperature, atmospheric pressure, and soil nutrients decline with increasing elevation, but precipitation increases (Dunne, Harte, and Taylor Citation2003; Inouye and Wielgolaski Citation2013). Prior work showed that pocket gopher body size and fat content increased with higher elevation, but population densities were greatest at the middle of three sites spanning 2,255–3,099 m (Tryon and Cunningham Citation1968). An herbicide experiment additionally suggested that this distributional pattern was associated with the relative abundance of grasses and forbs. A greater grass-to-forb ratio at higher elevations correlated with lower gopher abundance (Keith, Hansen, and Ward Citation1959), because pocket gophers prefer forbs over grasses (Aldous Citation1951; Vaughn, Citation1967; Ward Citation1960). Metabolism and thermoregulation in pocket gophers is typically an insignificant aspect of pocket gopher survival because of the relatively constant temperatures in their burrows (Gettinger Citation1975). However, their metabolic rate was considerably greater than other fossorial rodents following movements outside of their burrows during critical temperatures (<25–26°C), suggesting a metabolic cost of cold weather (Gettinger Citation1975). Conversely, gophers facing heat stress above 37.5°C experienced absolute mortality (Gettinger Citation1975).
Understanding the distributions of individual species and their engineering impacts on ecosystems can improve our ability to predict range shifts along with their ecosystem consequences under climate change (Parmesan Citation2006; Pearson and Dawson Citation2003). Here, we use the ACH to set up expectations for how gopher-caused disturbance varies with elevation, with the assumption that disturbance scales with gopher abundance, as shown in prior research (Smallwood and Erickson Citation1995). Although the ACH has been supported (e.g., Fenberg and Rivadeneira Citation2011; Vaupel and Matthies Citation2012), its generality remains inconclusive (Dallas, Decker, and Hastings Citation2017; Sagarin and Gaines Citation2002). The ACH is predicated on spatial autocorrelation among the multiple dimensions of a species’ niche, suggesting that an analysis of the underlying abiotic and biotic factors that control, or at least correlate with, abundance would improve evaluations of the ACH (e.g., Martinez-Meyer et al. Citation2013).
This study adds to the general evaluation of the ACH by assessing the density of soil disturbances caused by T. talpoides along replicated elevation gradients in subalpine to alpine meadows. We focus on the biogeographic patterns of disturbance caused by gopher activity to highlight the spatial extent of this important ecosystem engineering process. First, we asked: How does pocket gopher disturbance vary across elevation gradients? To address this question, we compared models of the relationship between disturbance abundance and elevation that reflect the ACH prediction that abundance will decline in all directions away from the most abundant location (hump-shaped) versus an alternative hypotheses (random with respect to elevation or linear with elevation). Second, we also evaluated climate, soil, geography, and vegetation to ask: What are the biotic and abiotic environmental correlates of gopher disturbance? We expected gopher disturbance to decrease under low temperatures (Gettinger Citation1975), increase with relative cover of forbs (their primary food source; Keith, Hansen, and Ward Citation1959), and increase with soil depth (Miller Citation1964; Reichman and Seabloom Citation2002).
Materials and methods
Site description and gopher disturbance sampling
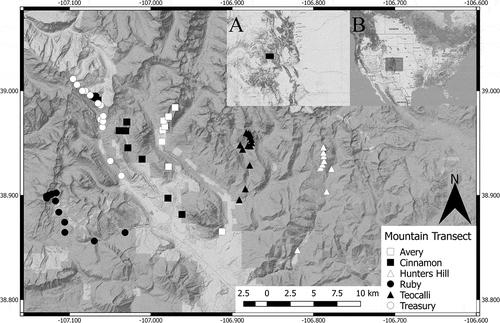
We assessed gopher surface disturbance of soils for sixty-seven sites spanning six replicate mountains (elevation transects, ; Table S1) in the Upper Gunnison Basin, Gunnison County, Colorado, USA. In the region, T. talpoides is the only mammal to cause significant burrowing activity in the soil (Findley and Negus Citation1953). Transects were chosen to avoid pseudoreplication of the lowest sites by sampling geographically distinct watersheds that were separated by ridges. Sites were sampled at every 100 m in elevation from the peak of the mountain to approximately 2,700 m in elevation. This resulted in nine to thirteen sites per transect, depending on elevation and topography. Sites were grassland habitat and were free of trees. To our knowledge, this is the largest altitudinal survey of northern pocket gopher disturbance to date.
Figure 1. Map of the sites and mountain transects (see legend) in the Upper Gunnison Basin, Colorado, USA. Inset A is a map of Colorado State, with a black box representing the area of the main map. Inset B is a map of the United States, with a gray box representing the area of inset A
At each site, we measured pocket gopher disturbance along three 40 m belt transects with a Precimeter 305 rolatape (R. C. 2002, Spokane, Washington, USA). Each transect was visually surveyed for gopher disturbance by operating the rolatape with a 1 m wide, 2.5 cm diameter PVC pipe attached perpendicular to its main axis to create a belt transect that increased the surface area of observation (following the methods of Beck and Hansen Citation1966; Hansen and Beck Citation1968). Each time a gopher disturbance was observed along the belt transect, it was counted with a hand-held tally counter. This “transect-mound count” is the most accurate non-capture-based method for estimating pocket gopher abundance (Smallwood and Erickson Citation1995); although, in addition, our method counted other forms of gopher disturbance. We defined gopher disturbance to soil as standing eskers/tunnels, infilled tunnels, or soil mounds. Photos of various gopher disturbances can be found in Butler and Butler (Citation2009). Eskers and infilled tunnels are created by gophers foraging under snowpack during winter, and infills are the disintegration of these tunnels (Knight Citation2009; Winchell et al. Citation2016). In our data collection we did not differentiate between the types of disturbance. When eskers followed the transects longitudinally, each 1 m section of the esker, in relation to the 1 m wide field of view, was counted as a single disturbance. However, this observation was rare, given the typical meandering patterns of eskers. The density of gopher disturbance was estimated as the number of gopher disturbances per m2, calculated over the three parallel 40 m belt transects per site.
Biotic and abiotic environment characterization
Vegetation was sampled during July 28–September 24, 2014. At each site, a 20 m vertical transect was arranged downslope, and three 20 m horizontal transects were placed across the top (0 m), middle (10 m), and bottom (20 m) positions of the vertical transect. Starting at the 0 m position of the transects, every 2.5 m of each transect was visually analyzed for percentage vegetative cover in a 20 cm × 20 cm quadrat. The percentage cover of forbs, graminoids, and bare ground was determined such that the maximum cover in a quadrat summed to 100. This sampling method resulted in thirty-three dispersed quadrats per site (nine positions per transect, no duplicate quadrats at the transect intersection), for a total of 1.32 m2 per site, representing an area of 400 m2. From this, six vegetation variables were constructed at the site level: forb to graminoid ratio (percent forb cover divided by the percent graminoid cover, including sedges and the like; hereafter referred to as “forb:grass ratio”), proportional forb cover (percent forb cover divided by total vegetative percent cover), total forb cover (summed forb cover across the thirty-three quadrats), total vegetative cover (summed cover across the quadrats), plant species richness, and inverse Simpson’s diversity index (calculated using the vegan package in R; Oksanen et al. Citation2015).
We also characterized several aspects of the nonclimatic abiotic environment. Soil depth was assessed by inserting a tile probe (Tile Probe 1.5 m length by 2 cm diameter, AMS Inc., American Falls, Idaho, USA) into the ground until bedrock was reached for ten independent points placed every 5 m along two 20 m transects. The slope and aspect for each site was obtained on site and also by analysis of open-source digital elevation models (DEMs) provided by the U.S. Geological Survey (one-third arc-second elevation product, Dollison Citation2010) within the QGIS GIS platform (QGIS Development Team Citation2017) by using GRASS GIS algorithms (GRASS Development Team Citation2017).
We collected climate data from twenty-nine regional weather stations to parameterize multiple regression models predicting the site-level climate based on elevation, aspect, and slope. Other studies modeling spatial patterns of a species have used freely available climate products, such as BIOCLIM (Hijmans et al. Citation2005). However, given the finer spatial scale of our data, where short linear distances have high elevation differences and are predicted to have substantially different climates (Pepin and Losleben Citation2002), such climate products are not useful (e.g., resolution ≥800 m2). All weather stations were located between 38.1628°–39.7649° latitude and −106.3397°–107.8741° longitude and covered various time ranges (starting points span 1981–2010; Supplementary Methods S1). From each weather station, we calculated yearly summaries of growing degree days (GDD) using a base temperature of 0°C (McMaster and Wilhelm Citation1997), mean annual temperature (MAT), mean annual precipitation (MAP), snow depth, and mean summer precipitation (SumP). We then constructed multiple regression models where the climate variable of interest (e.g., MAT) was modeled as a function of elevation, the sine and cosine of the aspect, and the slope, using maximum likelihood methods (lme4 package in R; Bates et al. Citation2015) with weather station and year as random effects. The sine of aspect in degrees creates a gradient from −1 to 1, representing west- to east-facing slopes, while the cosine of aspect creates a gradient of −1 to 1, representing south- to north-facing slopes. We used an information theoretic approach (Anderson Citation2008) to determine which combination of predictor variables were most predictive, given the set of candidate models. The best model for every climate parameter other than SumP (R2 = 0.63) had a conditional R2 (conditional on the group level effect) greater than 0.88. The estimated coefficients from these models were combined with the elevation, aspect, and slope from the survey sites to predict climate data for each gopher survey site. Models were aimed at predicting the recent climate experienced at the sites. A more detailed, step-by-step methodology of our climate modeling can be found in Supplementary Methods S1, including weather station geographic information, model details, and results.
Statistical analyses
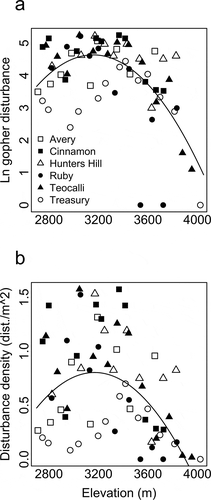
First, we used regression models to evaluate the three hypotheses on the shape of elevation–gopher disturbance relationships. Gopher disturbance was non-normally distributed; thus, we used natural log transformation (ln(Y + 1); Sokal and Rohlf Citation1995). We fit three models using the lm function in the stats package, and all analyses were performed in R (R Core Team Citation2015): (1) A null intercept-only model, predicting that the density of gopher disturbance was a random function of elevation; (2) a linear model with gopher disturbance predicted as a linear function of elevation; and (3) a model with a quadratic term specifying a mid-elevation peak in gopher disturbance as predicted under the ACH (Brown Citation1984, Citation1995). Each model also included mountain transect identity to account for spatial autocorrelation among sites within a transect. We used model selection procedures (Anderson Citation2008; Burnham and Anderson Citation2002) to compare models using AICc values. In addition, we computed AICc weights, which can be interpreted as the conditional probability that a given model is the best, given the set of candidate models. AICc and weights were derived using the AICc and Weights functions from the MuMIn package (Barton Citation2015). We report p values, F statistics, and r2 or R2 values for each model. An alternative approach using a generalized additive model that fit splines did not improve the fit to the data, nor did it suggest a different shape to the relationship, such as an asymptote at the lowest elevations rather than a decline at low elevation (data not shown). Additionally, we fit a model with gopher disturbance expressed as density per m2 to show that the pattern was invariant to log transformation (see ).
Figure 2. Gopher disturbance peaks at mid-elevation. Each point represents a sampled site, and different symbols reflect each mountain transect. Plot (a) reflects our model selection results with the relation between elevation and the natural log of gopher disturbance described by y = −41.75 + 2.94E-2*x-4.65E-6*x2 (p < 0.001; R2 = 0.55). Plot (b) presents the same model, but with gopher disturbance (dist.) presented as density per m2, described by y = –1.42 + 0.49E-3*x-1.50E-6*x2 (p < 0.001; R2 = 0.41). Parameter estimates were derived from least squares regression that included a linear and a quadratic term
To address our second question, we assembled site-level data to compare factors that are hypothesized to limit gopher disturbance and distribution. We first scaled all predictor variables to mean = 0 and standard deviation = 1 to evaluate predictors on comparable scales. To avoid multicollinearity (Zuur et al. 2010), we calculated variance inflation factors for candidate predictors and proceeded with the set of variables with minimal collinearity (vif <10, calculated using the vif function from the usdm package; Naimi Citation2013). This returned six variables with low collinearity: forb:grass ratio, inverse Simpson’s plant species diversity, mean annual temperature (MAT), natural log of soil depth, and the sine/cosine of aspect. Predictor variables were grouped as abiotic (MAT, soil depth, sine and cosine of aspect) or biotic (forb:grass ratio, inverse Simpson’s diversity). Biotic and abiotic sets were also combined to create a full model. The candidate set of four models included an intercept-only (null), abiotic-only, biotic-only, or the full model; hypotheses were evaluated in a model selection framework, as described previously (Anderson Citation2008; Burnham and Anderson Citation2002). Models were fit using maximum likelihood generalized mixed effects models, with mountain transect as the random effect, and a Poisson distribution for nonnormal count data (Bolker Citation2008) with a natural log link function (glmer via the lme4 package; Bates et al. Citation2015). We report AICc, ΔAICc, AICc model weights, and df for each model. We did not conduct model averaging of parameter estimates, because this can be problematic (Cade Citation2015), and model weights were strongly divergent (ΔAICc > 75; Anderson Citation2008).
Results
The ACH was supported for gopher disturbance, with a predicted quadratic relationship with elevation (, ). Gopher disturbance peaked at approximately 3,150 m a.s.l. and declined with elevation in both directions, with a stronger decline toward high elevation than low elevation (). Model selection procedures overwhelmingly supported the quadratic model against the intercept-only or linear models of gopher disturbance, as evidenced by the lowest AICc values and an AICc weight of 1 (). The quadratic model also had the largest R2 (0.55) and F ratio (10.41; p < 0.001; ).
Table 2. Summary of regression models. Beta and gamma refer to slope terms
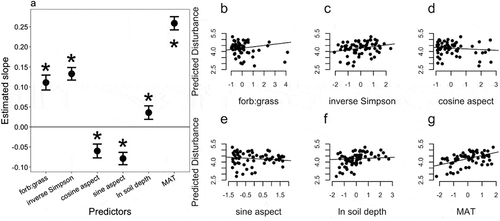
When we examined potential correlates of gopher disturbance, there was strong support for the full model, which included forb:grass ratio, inverse Simpson’s plant species diversity, as well as MAT, soil depth, and the sine/cosine of aspect (, ). The AICc weights overwhelmingly support the full model over models with only abiotic or only biotic correlates (). Because predictor variables were scaled prior to analysis, the slope estimates provide effect-size metrics. Within the full model, gopher disturbance increased with forb:grass ratio, inverse Simpson’s diversity, MAT, and soil depth, while it decreased with the sine and cosine of aspect (). The slope estimate for MAT was nearly double that of any other predictor, followed in rank order by plant species diversity then forb:grass ratio. The sine and cosine of aspect and soil depth were the weakest predictors.
Table 3. The best model of gopher disturbance supported both abiotic and biotic predictors. The best model was determined via an AICc model selection procedure. ΔAICc reports the difference in AICc that a given model is from the lowest AICc model. AICc weights are interpreted as probabilities that the model is the closest to reality given the set of candidate models
Figure 3. Gopher disturbance is predicted to vary with both abiotic and biotic factors (a). All variables were scaled (mean of 0 and standard deviation of 1) prior to analysis, making them unit-less and comparable as effect sizes. Estimates come from maximum likelihood mixed effects models with peak as a random-group level effect. Asterisks denote significance at the p < 0.05 level. Points show means ± s.e. Plots b–g present the relationship of each parameter to predicted disturbance, accounting for the other parameters and group effects. Gopher disturbance was modeled with a log link function (log disturbance counts)
Discussion
Gopher disturbance over elevation gradients supports the ACH
Gopher disturbance to soils was greatest at middle elevations (~3,150 m a.s.l.; ), supported over six replicated gradients. Given that soil disturbance is highly correlated with abundance for T. talpoides (Beck and Hansen Citation1966; Ellison Citation1946; Reid, Hansen, and Ward Citation1966; Smallwood and Erickson Citation1995), this result supported the ACH for the regional distribution of the northern pocket gopher. It is common to find support for the ACH (e.g., Fenberg and Rivadeneira Citation2011; Vaupel and Matthies Citation2012) despite recent skepticism (Dallas, Decker, and Hastings Citation2017; Sagarin and Gaines Citation2002; Sagarin, Gaines, and Gaylord Citation2006). It is important to note that Brown (Citation1984, Citation1995) predicated the ACH on three assumptions: (1) species abundance depends on the response of a local population to local conditions, (2) species abundance is determined by how closely local conditions meet the species’ Hutchinsonian (Citation1957) n-dimensional niche requirements, and (3) there is spatial autocorrelation in the multidimensional niche requirements that control species’ abundance and distribution. The last assumption is most central. Several tests of the ACH have failed to first assess whether these assumptions hold, thus causing premature rejection of the hypothesis based solely on observed patterns of abundance. If the Hutchinsonian niche dimensions are not spatially autocorrelated, then applying the ACH would be inappropriate. Thus, the ACH can be rejected via two avenues: (1) if there is evidence that the assumptions are poor and/or unrealistic or (2) if the assumptions hold but there is no abundant center. Spatial autocorrelation in environmental variables is widespread (Legendre Citation1993; Koenig Citation1999; but see Helmuth et al. Citation2002; Sagarin, Gaines, and Gaylord Citation2006). Our dataset showed significant spatial autocorrelation in four of five gopher disturbance niche dimensions, including the best predictor: mean annual temperature (evaluated using Moran’s I; Table S2). We suggest that a rigorous analysis of Brown’s (Citation1984, Citation1995) assumptions is key to determining the usefulness and generality of the ACH.
Our results are constrained by lack of data across the full geographical distribution of T. talpoides, and this is particularly evident in the stronger resolution on elevational pattern for high elevations than for low elevations in our dataset (). We expect that sampling additional sites at lower elevations than included in our study would increase understanding of potential factors that define the low-elevation range limits of T. talpoides. Despite this limitation, the large environmental diversity over a manageable spatial scale permitted detailed data collection on potential niche dimensions, such as plant composition. In fact, Brown (Citation1984, Citation1995) initially drew from work on abundance distributions over elevation gradients (Whittaker Citation1956, Citation1960, Citation1965) to formalize the ACH by characterizing the spatial distributions of environmental variables over elevation gradients. The ACH may be upheld more commonly over local elevation gradients (e.g., Herrera and Bazaga Citation2008; Vaupel and Matthies Citation2012) than for a species’ full geographic range, but to our knowledge no prior study has made such a comparison.
Niche dimensions of the pocket gopher
When parsing the niche dimensions that could underlie the abundant-center pattern, we found that aspects of climate, soil, geography, and plant communities were important correlates of gopher disturbance. Mean annual temperature was predicted to have a large influence on the distribution of gopher activity, with greater disturbance at sites with warmer mean annual temperature (MAT; ). Mean annual temperature declines with elevation, suggesting that variation in MAT may drive much of the elevation pattern (). Prior work suggested that pocket gophers experienced a high cost of low temperatures because of their relatively fast metabolic rates (Gettinger Citation1975). At low MAT, gophers were expected to be less abundant because a short growing season limits the vegetation production needed for their survival (Thorn Citation1978). In contrast, at low elevations warmer MAT may expose gophers to physiological stress related to thermal mortality limits (~37.5°C; Gettinger Citation1975). The metabolic stress associated with both ends of the gopher’s distribution over mean annual temperature gradients deserves further experimental attention and may drive the hump-shaped gradient in gopher disturbance with elevation.
Vegetation patterns were also strongly correlated with the abundance and distribution of the soil disturbances caused by T. talpoides (). Past work has suggested that gophers prefer forbs over grasses (Keith, Hansen, and Ward Citation1959; Stuebe and Andersen Citation1985; Vaughan Citation1967), and our survey supported the expectation that gopher disturbance increases with greater proportions of their preferred food. Future work may benefit from investigating the nutritional quality of the plant species associated with gopher disturbance (e.g., rodent preference for N-rich legumes; Sirotnak and Huntly Citation2000). We also found that gopher disturbance increased with plant-species diversity, suggesting that pocket gopher abundance increases with potential vegetative diet breadth or that pocket gophers promote plant diversity. The direction of causality for our biotic predictors is ambiguous: Does plant diversity and greater forb cover lead to increased gopher disturbance? Or does gopher disturbance promote plant diversity and increase forb cover? There is strong evidence for the latter from Sherrod, Seastedt, and Walker (Citation2005), who found that experimental disturbance designed to reflect gopher burial increased forb cover, and that plant-species richness increased in recently disturbed soils in alpine environments (Colorado Rocky Mountains, ~3,500 m a.s.l.). Additionally, northern pocket gophers selectively consumed forbs over graminoids and other functional groups in feeding trials (Aldous Citation1951; Keith, Hansen, and Ward Citation1959; Stuebe and Andersen Citation1985; Vaughan Citation1967). That evidence exists for both pathways of causality may indicate positive feedback loops between gopher abundance and forb abundance or plant-species diversity (Cortinas and Seastedt Citation1996; Sherrod, Seastedt, and Walker Citation2005), where gopher disturbance increases forb cover, leading to a greater abundance of the gopher’s primary food source, which in turn increases their population size and level of soil disturbance. Gopher activity could increase plant diversity by processes related to the intermediate disturbance hypothesis (Grime Citation1973a, Citation1973b; Huston Citation2014), given that the disturbance related to gopher burrows does not reach such extremes that it mimics landslides, fires, or other catastrophic events.
Soil depth and aspect were additional, reliable predictors of gopher disturbance across elevation gradients (). However, compared to climate and plant biotic factors, their influence on gopher disturbance was minor. Gopher disturbance increased with soil depth in our system (; see also Marcy et al. Citation2013). Pocket gophers tend to occupy the upper soil layer where plant roots are most dense, approximately 6–20 cm (Reichman and Seabloom Citation2002), and although the lowest average soil depth across our sites was approximately 80 cm, sites with deeper soil profiles had more gopher disturbance. Additionally, soil depth is known to have large effects on vegetation cover, productivity, and composition (e.g., Fridley et al. Citation2011, Citation2016).
Our results were partially consistent with past work that found the greatest densities of T. talpoides disturbance on southeast-facing slopes (Thorn Citation1982). The negative relationship between the sine of aspect and gopher disturbance suggested that gopher disturbance was greatest on western-facing slopes in the study region, while the negative relationship with the cosine of aspect suggested that gopher disturbance also increased toward southern-facing slopes (). The wind in the Colorado Rockies generally prevails from the west, leading to snow accumulation on east-facing slopes (Thorn Citation1982). Deeper snowpack during the winter better insulates gopher dwellings and could reduce reliance on metabolic heat (Andersen and MacMahon, Citation1981); however, deep snow also may reduce the length of the plant growing season and limit food availability.
Although our models investigated many of the niche dimensions expected to limit T. talpoides disturbance and abundance, there are other limiting factors that were not addressed. For instance, variable snow depth and drifts caused by islands of trees or geological features may provide winter refugia from freezing soils (Winchell et al. Citation2016), but our study was unable to characterize snow-depth variation at this large number of sites. Soil texture and rock features of the soil substrate are also known to influence gopher abundance (Sherrod and Seastedt Citation2001; Winchell et al. Citation2016), but were not available for our sites. Future modeling of fossorial mammals would benefit from considering these important, although difficult to quantify, niche dimensions.
Consequences of climate change for ecosystem engineering by pocket gophers
Pocket gophers are ecosystem engineers; thus, as climate change continues, understanding pocket gopher range shifts—and, importantly, shifts in the distribution of their soil disturbances—may be important for predicting shifts in local plant communities and ecosystem processes (Berteaux et al. Citation2004; Parmesan and Yohe Citation2003; Root et al. Citation2003). The usual response of animals to warming is to migrate toward cooler, higher elevations or latitudes (Berteaux et al. Citation2004; Parmesan and Yohe Citation2003; Root et al. Citation2003). Given that climate change may be dramatic in mountainous ecosystems (Rangwala and Miller Citation2012), and vegetation responses to altered climate have already been observed (Zorio, Williams, and Aho Citation2016), we expect that climate change could shift the existing T. talpoides populations up mountainsides (Gettinger Citation1975). If we assume that MAT limits the upper elevation distribution of the pocket gopher, as predicted by theory (Brown Citation1995; Dobzhansky Citation1950; MacArthur Citation1972) and supported by our results, what will happen to the distribution of T. talpoides in response to climate change? High elevation environments are expected to experience approximately 2–3°C increase in MAT with climate change (Rangwala and Miller Citation2012), which could increase snowmelt date by two weeks in both spring and fall (experimentally determined by Harte and Shaw Citation1995, and Harte, Saleska, and Levy Citation2015). Gopher activity is greatest during the fall months (Bandoli Citation1981). Extended fall growing seasons under warmer climates with more growing degree days will prolong resource capture periods and may increase T. talpoides population sizes at high elevations. Given our prediction that the high elevational limits of pocket gophers are temperature and growing-season limited, we suggest that gopher disturbance and abundance at high elevation will increase in future climates. If a 3°C increase in the coming decades for the region reflects climatic change approximate to a 430 m increase in elevation (Pepin and Losleben Citation2002), we predict that a 3°C temperature increase will shift the maximum gopher disturbance from approximately 3,150 m to 3,580 m in elevation. Interestingly, throughout the climate changes of the past sixty-five years, Zorio, Williams, and Aho (Citation2016) found that high elevation herbaceous plant communities generally decreased in plant diversity and forb representation. This result highlights the necessity of long-term experiments and observations to elucidate the interplay of various causes of gopher distributions, as changes in food resources (an indirect effect of climate change) could counteract direct climate-warming effects for pocket gophers.
Conclusion
Our data provide new support for the abundant center hypothesis across elevation gradients for the northern pocket gopher. Our study provides a more comprehensive understanding of pocket gopher disturbance at high elevations compared to previous studies that have focused primarily on low elevation grasslands or had low replication of elevation (). Our results suggest that mean annual temperature and aspects of plant resources are key niche dimensions for T. talpoides. If habitat suitability for this ecosystem engineer moves upslope with climate warming, our data predict that increases in forb cover and plant species diversity will track upslope increases in the density of T. talpoides disturbances to soil.
Supplementary Materials
Download Zip (2.7 MB)Acknowledgments
We thank the Rocky Mountain Biological Laboratory for logistical support and their summer REU program, which hosted SC. We also thank M. Kazenel, C. Forrester, I. Latella, and W. Brown for assistance in the field. M. Kazenel and S. Kivlin assisted with the climate interpolations.
Disclosure statement
No potential conflict of interest was reported by the authors.
Additional information
Funding
Related Research Data
References
- Aldous, C. M. 1951. The feeding habits of pocket gophers (Thomomys talpoides moorei) in the high mountain ranges of central Utah. Journal of Mammalogy 32:1–11.
- Andersen, D. C., and J. A. MacMahon. 1981. Population dynamics and bioenergetics of a fossorial herbivore, Thomomys Talpoides. Ecological Monographs 51:179–202.
- Anderson, D. R. 2008. Model based inference in the life sciences: A primer on evidence. New York: Springer.
- Bandoli, J. H. 1981. Factors influencing seasonal burrowing activity in the pocket gopher Thomomys talpoides. Journal of Mammalogy 62:293–303.
- Barton, K. 2015: MuMIn: Multi-model inference. R package version 1.13.4. http://CRAN.R-project.org/package=MuMIn.
- Bates, D., M. Maechler, B. Bolker, and S. Walker. 2015. Fitting linear mixed-effects models using lme4. Journal of Statistical Software 67:1–48.
- Beck, R. F., and R. M. Hansen. 1966. Estimating plains pocket gopher abundance on adjacent soil types by a revised technique. Journal of Rangeland Management 19:224–25.
- Berteaux, D., D. Réale, A. G. McAdam, and S. Boutin. 2004. Keeping pace with fast climate change: Can Arctic life count on evolution? Integrative and Comparative Biology 44:140–51.
- Bolker, B. M. 2008. Ecological models and data in R. Princeton. Princeton: Princeton University Press. 124–25.
- Brown, J. H. 1984. On the relationship between abundance and distribution of species. The American Naturalist 124:255–79.
- Brown, J. H. 1995. Macroecology. Chicago: The University of Chicago Press. 47–75.
- Burnham, K. P., and D. R. Anderson. 2002. Model selection and multimodel inference: A practical information-theoretic approach. New York: Springer.
- Butler, D. R., and W. D. Butler. 2009. The geomorphic effects of gophers on soil characteristics and sediment compaction: A case study from alpine treeline, Sangre de Cristo Mountains, Colorada, USA. The Open Geology Journal 3:82–89.
- Cade, B. S. 2015. Model averaging and muddled multimodel inferences. Ecology 96:2370–82.
- Case, M. F., C. B. Halpern, and S. A. Levin. 2013. Contributions of gopher mound and casting disturbances to plant community structure in a Cascade Range meadow complex. Botany 91:555–61.
- Cortinas, M., and T. Seastedt. 1996. Short- and long-term effects of gophers (Thomomys talpoides) on soil organic matter dynamics in alpine tundra. Pedobiologia 40:162–70.
- Dallas, T., R. R. Decker, and A. Hastings. 2017. Species are not most abundance in the centre of their geographic range or climatic niche. Ecology Letters 20:1526–33.
- Dobzhansky, T. 1950. Evolution in the tropics. American Scientist 38:209–21.
- Dollison, R. M., 2010, The national map: New viewer, services, and data download: U.S. Geological Survey Fact Sheet 2010–3055, 2 p. Available at https://pubs.usgs.gov/fs/2010/3055/.
- Dunne, J. A., J. Harte, and K. J. Taylor. 2003. Subalpine meadow flowering phenology responses to climate change: Integrating experimental and gradient methods. Ecological Monographs 73:69–86.
- Ellison, L. 1946. The pocket gopher in relation to soil erosion on mountain range. Ecology 27:1001–14.
- Fenberg, P. B., and M. M. Rivadeneira. 2011. Range limits and geographic patterns of abundance of the rocky intertidal owl limpet. Lottia Gigantea. Ecology 38:2286–98.
- Findley, J. S., and N. C. Negus. 1953. Notes on the mammals of the Gothic region, Gunnison County, Colorado. Journal of Mammalogy 34:235–39.
- Fridley, J. D., J. P. Grime, A. P. Askew, B. Moser, and C. J. Stevens. 2011. Soil heterogeneity buffers community response to climate change in species-rich grassland. Global Change Biology 17:2002–11.
- Fridley, J. D., J. S. Lynn, J. P. Grime, and A. P. Askew. 2016. Longer growing seasons shift grassland vegetation towards more-productive species. Nature Climate Change 6:865–68.
- Gaston, K. J. 2003. The structure and dynamics of geographic ranges. Oxford: Oxford University Press. 125–166 pps.
- Gettinger, R. D. 1975. Metabolism and thermoregulation of a fossorial rodent, the northern pocket gopher (Thomomys talpoides). Physiological Zoology 48:311–22.
- GRASS Development Team, 2017. Geographic resources analysis support system (GRASS) Software, Version 7.2. Open Source Geospatial Foundation. Electronic document. http://grass.osgeo.org
- Grime, J. P. 1973a. Competitive exclusion in herbaceous vegetation. Nature 242:344–47.
- Grime, J. P. 1973b. Control of species density in herbaceous vegetation. Journal of Environmental Management 1:151–67.
- Hansen, R. M., and G. D. Bear. 1964. Comparison of pocket gophers from alpine, subalpine, and shrub-grassland habitats. Journal of Mammalogy 45:638–40.
- Hansen, R. M., and R. F. Beck. 1968. Habitat of pocket gophers in Cochetopa Creek drainage, Colorado. The American Midland Naturalist 79:103–17.
- Hansen, R. M., and M. J. Morris. 1968. Movement of rocks by northern pocket gophers. Journal of Mammalogy 49:391–99.
- Harte, J., S. R. Saleska, and C. Levy. 2015. Convergent ecosystem responses to 23-year ambient and manipulated warming link advancing snowmelt and shrub encroachment to transient long-term climate-soil carbon feedback. Global Change Biology 21:2349–56.
- Harte, J., and R. Shaw. 1995. Shifting dominance within a montane vegetation community: Results of climate-warming experiment. Science 267:876–80.
- Helmuth, B., C. D. G. Harley, P. M. Halpin, M. O’Donnell, G. E. Hofmann, and C. A. Blanchette. 2002. Climate change and latitudinal patterns of intertidal thermal stress. Science 298:1015–17.
- Herrera, C. M., and P. Bazaga. 2008. Adding a third dimension to the edge of a species’ range: Altitude and genetic structuring in mountainous landscapes. Heredity 100:275–85.
- Hijmans, R. J., S. E. Cameron, J. L. Parra, P. G. Jones, and A. Jarvis. 2005. Very high resolution interpolated climate surfaces for global land areas. International Journal of Climatology 25:1965–78.
- Huntly, N., and R. Inouye. 1988. Pocket gophers in ecosystems: Patterns and mechanisms. BioScience 38:786–93.
- Huston, M. A. 2014. Disturbance, productivity, and species diversity: Empiricism vs. logic in ecological theory. Ecology 95:2382–96.
- Hutchinson, G. E. 1957. Concluding remarks. Cold Spring Harbor Symposia on Quantitative Biology 22:415–27.
- Inouye, D. W., and F. E. Wielgolaski. 2013. Phenology at high altitudes. In Phenology: An integrative environmental science, M. D. Schwartz. ed., 249–72. Dordrecht: Springer.
- Keith, J. O., R. M. Hansen, and A. L. Ward. 1959. Effect of 2, 4-D on abundance and foods of pocket gophers. Journal of Wildlife Management 23:137–45.
- Knight, J. 2009. Infilled pocket gopher tunnels: Seasonal features of high alpine plateaux. Earth Surface Processes and Landforms 34:590–95.
- Koenig, W. D. 1999. Spatial autocorrelation of ecological phenomena. TRENDS in Ecology and Evolution 14:22–26.
- Legendre, P. 1993. Spatial autocorrelation: Trouble or new paradigm? Ecology 74:1659–73.
- MacArthur, R. H. 1972. Geographical Ecology: Patterns in the distribution of species. New York: Harper & Row. 127–163 pps.
- Marcy, A. E., S. Fendorf, J. L. Patton, and E. A. Hadly. 2013. Morphological adaptations for digging and climate-impacted soil properties define pocket gopher (Thomomys spp.) distributions. PLOS ONE 8:e64935.
- Martinez-Meyer, E., D. Diaz-Porras, A. T. Peterson, and C. Yanez-Arenas. 2013. Ecological niche structure and rangewide abundance patterns of species. Biology Letters 9:20120637.
- McMaster, G. W., and W. W. Wilhelm. 1997. Growing degree days: One equation, two interpretations. Agricultural and Forest Meteorology 87:291–300.
- Miller, R. S. 1964. Ecology and distribution of pocket gophers (Geomyidae) in Colorado. Ecology 45:256–72.
- Naimi, B. 2013. usdm: Uncertainty analysis for species distribution models. R package version 1.1-12. http://CRAN.R-project.org/package=usdm.
- Oksanen, J., F. G. Blanchet, R. Kindt, P. Legendre, P. R. Minchin, R. B. O’Hara, G. L. Simpson, P. Solymos, M. H. H. Stevens, and H. Wagner, 2015: vegan: Community Ecology Package. R package version 2.3-2. http://CRAN.R-project.org/package=vegan
- Parmesan, C. 2006. Ecological and evolutionary responses to recent climate change. Annual Review of Ecology, Evolution and Systematics 37:637–69.
- Parmesan, C., and G. Yohe. 2003. A globally coherent fingerprint of climate change impacts across natural systems. Nature 421:37–42.
- Pearson, R. G., and T. P. Dawson. 2003. Predicting the impacts of climate change on the distribution of species: Are bioclimate envelopes models useful? Global Ecology and Biogeography 12:361–71.
- Pepin, N., and M. Losleben. 2002. Climate change in the Colorado Rocky Mountains: Free air versus surface temperature trends. International Journal of Climatology 22:311–29.
- QGIS Development Team, 2017. QGIS Geographic Information System. Open Source Geospatial Foundation. http://qgis.osgeo.org
- R Core Team. 2015. R: A language and environment for statistical computing. R Foundation for Statistical Computing, Vienna, Austria. ISBN 3-900051-07-0. http://www.R-project.org/.
- Rangwala, I., and J. R. Miller. 2012. Climate change in mountains: A review of elevation- dependent warming and its possible causes. Climate Change 114:527–47.
- Reichman, O. J., and E. W. Seabloom. 2002. The role of pocket gophers as subterranean ecosystem engineers. TRENDS in Ecology and Evolution 17:44–49.
- Reid, V. H., R. M. Hansen, and A. L. Ward. 1966. Counting mounds and earth plugs to census mountain pocket gophers. The Journal of Wildlife Management 30:327–34.
- Rickart, E.A. 2001. Elevational diversity gradients, biogeography and the structure of montane mammal communities in the intermountain region of North America. Global Ecology and Biogeography 10:77–100.
- Rios, E., and S. T. Álvarez-Castañeda. 2007. Environmental responses to altitudinal gradients and subspecific validity in pocket gophers (Thomomys bottae) from Baja California Sur, Mexico. Journal of Mammalogy 88:926–34.
- Root, T. L., J. T. Price, K. R. Hall, S. H. Schneider, C. Rosenzweig, and J. A. Pounds. 2003. Fingerprints of global warming on wild animals and plants. Nature 421:57–60.
- Sagarin, R. D., and S. D. Gaines. 2002. The ‘abundant centre’ distribution: To what extent is it a biogeographical rule? Ecology Letters 5:137–47.
- Sagarin, R. D., S. D. Gaines, and B. Gaylord. 2006. Moving beyond assumptions to understand the abundance distributions across the ranges of species. TRENDS in Ecology and Evolution 21:524–30.
- Sherrod, S. K., and T. R. Seastedt. 2001. Effects of the northern pocket gopher (Thomomys talpoides) on alpine soil characteristics, Niwot Ridge, CO. Biogeochemistry 55:195–218.
- Sherrod, S. K., T. R. Seastedt, and M. D. Walker. 2005. Northern pocket gopher (Thomomys talpoides) control of alpine plant community structure. Arctic, Antarctic, and Alpine Research 37:585–90.
- Sirotnak, J. M., and N. J. Huntly. 2000. Direct and indirect effects of herbivores on nitrogen dynamics: Voles in riparian areas. Ecology 81:78–87.
- Smallwood, K. S., and W. A. Erickson. 1995. Estimating gopher populations and their abatement in forest plantations. Forest Science 41:284–96.
- Smallwoood, K. S., and M. L. Morrison. 1999. Spatial scaling of pocket gopher (Geomyidae) density. The Southwestern Naturalist 44:73–82.
- Sokal, R. R., and F. J. Rohlf. 1995. Biometry: The principles and practice of statistics in biological research. 3rd ed. New York: W. H. Freeman and Company.
- Stuebe, M. M., and D. C. Andersen. 1985. Nutritional ecology of a fossorial herbivore: Protein N and energy value of winter caches made by the northern pocket gopher Thomomys talpoides. Canadian Journal of Zoology 63:1101–05.
- Thorn, C. E. 1978. A preliminary assessment of the geomorphic role of pocket gophers in the alpine zone of the Colorado Front Range. Geografiska Annaler. Series A, Physical Geography 60:181–87.
- Thorn, C. E. 1982. Gopher disturbance: Its variability by Braun-Blanquet vegetation units in the Niwot Ridge alpine tundra zone, Colorado Front Range, U.S.A. Arctic and Alpine Research 14:45–51.
- Tryon, C. A., and H. N. Cunningham. 1968. Characteristics of pocket gophers along an altitudinal transect. Journal of Mammalogy 49:699–705.
- Turner, G. T., R. M. Hansen, V. H. Reid, H. P. Tietjen, and A. L. Ward. 1973. Pocket gophers and Colorado mountain rangeland. Colorado State University Experimental Station Bulletin 554S:1–90.
- Vaughan, T. A. 1967. Food habits of the northern pocket gopher on shortgrass prairie. The American Midland Naturalist 77:176–89.
- Vaupel, A., and D. Matthies. 2012. Abundance, reproduction, and seed predation of an alpine plant decrease from the center toward the range limit. Ecology 93:2253–62.
- Ward, A. L. 1960. Mountain pocket gopher food habits in Colorado. The Journal of Wildlife Management 24:89–92.
- Whitesides, C. J., and D. R. Butler. 2016. Bioturbation by gophers and marmots and its effects on conifer germination. Earth Surface Processes and Landforms 41:2269–81.
- Whittaker, R. H. 1956. Vegetation of the Great Smoky Mountains. Ecological Monographs 22:1–44.
- Whittaker, R. H. 1960. Vegetation of the Siskiyou Mountains, Oregon and California. Ecological Monographs 30:279–338.
- Whittaker, R. H. 1965. Dominance and diversity in land plant communities. Science 147:250–59.
- Winchell, E. W., R. S. Anderson, E. M. Lombardi, and D. F. Doak. 2016. Gophers as geomorphic agents in the Colorado Front Range subalpine zone. Geomorphology 264:41–51.
- Yurkewycz, R. P., J. G. Bishop, C. M. Crisafulli, J. A. Harrison, and R. A. Gill. 2014. Gopher mounds decrease nutrient cycling rates and increase adjacent vegetation in volcanic primary succession. Oecologia 176:1135–50.
- Zorio, S. D., C. F. Williams, and K. A. Aho. 2016. Sixty-five years of change in montane plant communities in western Colorado, U.S.A. Arctic, Antarctic, and Alpine Research 48:703–22.
- Zuur, A. F., E. N. Ieno, and C. S. Elphick. 2010. A protocol for data exploration to avoid common statistical problems. Methods in Ecology and Evolution 1:3–14.