
ABSTRACT
Global climate change has increased temperatures and precipitation in the Arctic throughout the past thirty years. Lakes across the Arctic have demonstrated spatially and temporally variable trends in size and number because of these climate changes. Modifications in the hydrological budget and surface hydrology of Arctic regions have important implications for aquatic ecosystems and biogeochemical cycles. Since 1960 the ice-free region of southwestern Greenland (between Sisimiut, Kangerlussuaq, and the ice margin) has experienced temperature increases, while precipitation has risen at the coast at Sisimiut and has fallen inland at Kangerlussuaq. However, it remains unknown whether the lakes in this region have responded to these temperature and precipitation changes. Therefore, the surface area of 186 lakes was calculated from Landsat imagery for 1995, 2002, 2015, 2016, and 2017 to establish whether lakes in this region have changed in size during a twenty-two-year period. Lake surface area decreased by 855,449 m2 between 1995 and 2017. The greatest lake surface area changes occurred between 2002 and 2015, with large variations also between 2015 and 2016. Lakes close to Kangerlussuaq (area 1) demonstrated the greatest loss in lake surface area (−1.40 km2). It is proposed that this trend reflects high evaporation totals as a result of increasing temperatures and longer ice-free periods in this area. Lakes close to Sisimiut at the coast (area 2) exhibit a net increase in lake surface area, which could reflect the increase in precipitation experienced in this area during the study period. However, not all lakes in the study areas responded in a uniform manner. These heterogeneous changes in lake surface area may reflect how changes in regional climate are interacting with catchment geomorphology, and highlight the importance of individual catchment and lake characteristics in determining lake response to climatic change in this region.
Introduction
During the past 100 years the Arctic has experienced enhanced warming (Kaufman et al. Citation2009) and is predicted to experience increased precipitation relative to lower latitudes as a result of future global climate change (Stocker Citation2014). These climatic changes are modifying the hydrological budget, hydrological processes (Francis et al. Citation2009), aquatic ecosystems, and biogeochemical cycles (Anderson et al. Citation2017), including the carbon cycle of Arctic regions (Abnizova et al. Citation2012; Tranvik et al. Citation2009). In the Arctic, the hydrological cycle connects the atmosphere with the cryosphere and the terrestrial component of the Arctic land system, facilitating the transfer of water, nutrients, and sediments between ice sheets, rivers, lakes, soils, and permafrost, and supporting biogeochemical processes (i.e., weathering and nutrient cycling) and aquatic ecosystems (Anderson et al. Citation2017). Increased precipitation and temperatures are also raising permafrost temperatures (Romanovsky, Smith, and Christiansen Citation2010), increasing active layer depth, discharging water previously trapped in the permafrost store to the surface store (lakes, rivers, and soils), and releasing stored carbon (Serreze et al. Citation2000), which can be transported to other stores in the system (lakes, rivers). Warmer temperatures have altered terrestrial ecosystems (Post et al. Citation2009) and have produced a number of physical changes (e.g., ice cover, stratification, light availability) to lakes, which have changed lake ecosystems in the Arctic (Hobbs et al. Citation2010; Perren, Bradley, and Francus Citation2003; Rühland, Paterson, and Smol Citation2015).
Arctic lakes in permafrost regions demonstrate diverse trends in response to warmer air and soil temperatures. A number of studies from discontinuous permafrost zones indicate that thermokarst lakes are declining in number and aerial extent as a result of warmer air and soil temperatures. For example, in boreal Alaska shallow closed-basin ponds decreased in number and size from 1950 to 2002 (Riordan, Verbyla, and McGuire Citation2006); fifty lakes on the Arctic Coastal Plain have decreased in size or have completely disappeared from 2000 to 2009 (Hinkel et al. Citation2007); and a study from the early 1970s to 2004 of more than 10,000 Siberian thermokarst lakes revealed that, despite precipitation increases, overall lake number decreased and area declined by 6 percent (Jones et al. Citation2011; Smith et al. Citation2005). The processes responsible for the decline in lake number and area in discontinuous permafrost regions in the Arctic are evaporation and permafrost degradation triggered by temperature increases and subsequent thermokarst lake drainage (Smith et al. Citation2005). However, lakes in some discontinuous permafrost regions in areas such as Alaska, Sweden, and Russia have not shown any net change in size or number in relation to warming during the period of 1970–2000 (Sannel and Kuhry Citation2011). Similarly, in areas of continuous permafrost, lakes have also displayed variable responses to climate change during the past approximately sixty-five years. For Example, lake surface area has decreased in Canada (Carroll et al. Citation2011), with negligible change in Alaska (Hinkel et al. Citation2007; Riordan, Verbyla, and McGuire Citation2006) and an increase in area and number because of greater active-layer depth and water storage in Siberian lake catchments (Smith et al. Citation2005).
Greenland has experienced some of the most rapid and nonlinear changes in the Arctic as a result of climate change, and between 2007 and 2012 mean annual air temperatures were 3°C higher than between 1979 and 2000 (Mayewski et al. Citation2014). Warming air temperatures since 1990 have been significantly correlated to accelerated ice discharge rates (Hanna et al. Citation2008; Zwally et al. Citation2001) and thinning (Pritchard et al. Citation2009) of the Greenland Ice Sheet (GIS). In southwestern Greenland, the Kangerlussuaq outlet glaciers have experienced rapid thinning and recession following a twenty-year period (1980–2000) of thickening (Knight et al. Citation2007). This has resulted in an increase in supraglacial lakes along the western margin of the GIS (Fitzpatrick et al. Citation2014), which drain meltwater via moulins to the ice-sheet margins, increasing the number of ice-marginal lakes (Anderson et al. Citation2017). During the past twelve years the closed-basin oligosaline lakes at the head of the fjord have experienced drowned shrub tundra along the shorelines as a result of lake levels increasing by 2.5 m (). Future climate change is projected to be the most pronounced in Arctic regions (Kattsov et al. Citation2005). Given that lakes are key components of the Arctic hydrological cycle, Arctic ecosystems, and biogeochemical cycling, it is of paramount importance to accurately understand how lake systems in Arctic regions have changed and will continue to do so in the future. However, it is unknown whether the lakes in this region of southwestern Greenland have been affected by warmer temperatures (Hanna et al. Citation2008) and an increase in precipitation in coastal localities and a decrease inland, closer to the ice margin, during the past approximately forty years (Mernild et al. Citation2014). This article aims to assess, for the first time in this region, whether lake surface area has changed during a twenty-two-year period (1995–2017) coincident with higher temperatures and increased precipitation at the coast and decreased precipitation inland. Landsat aerial imagery from 1995, 2002, 2015, 2016, and 2017 was used to calculate lake surface-area changes for lakes greater than 40 ha in southwestern Greenland.
Study sites
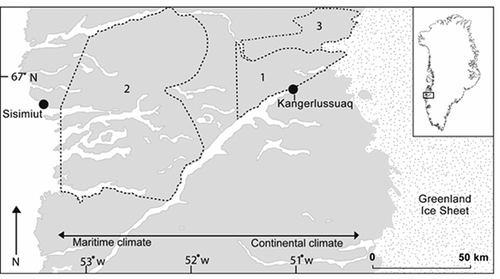
The approximately 150 km-wide region stretching from the ice margin to the coast near the town of Sisimiut is the largest ice-free expanse of land in southwestern Greenland (). This region has approximately 20,000 lakes (Anderson et al. Citation2001), which have formed in former glacial scour basins as the ice-sheet margin retreated from the coast at the end of the Holocene (~11,000 ka yr BP) to its present-day position (van Tatenhove, van der Meer, and Koster Citation1996; Wagner and Bennike Citation2012). The majority of the lakes are small and less than 40 ha in size. With the exception of some lakes in area 1, which demonstrate elevated conductivities, and the closed-basin (no outflow) lakes at the head of the fjord close to Kangerlussuaq, which are oligosaline (Böcher Citation1949; Williams Citation1991), most lakes in the region have open basins (inflow and outflow) and are oligotrophic (Anderson et al. Citation2001). The geology of this region is characterized by Archaean gneiss and Quaternary till deposits (Jensen et al. Citation2002).
Figure 1. Map of the three study areas (marked as 1, 2, and 3) located in southwestern Greenland in relation to the Greenland Ice Sheet, the coast near Sisimiut, and the climatic gradient (maritime at the coast and continental inland), which is present in this region
This region is underlain by continuous permafrost, although evidence for discontinuous permafrost has been identified in the Umimmalissuaq Valley (Henkner, Scholten, and Kühn Citation2016) close to the ice margin, and through-taliks have been identified under some of the larger lakes in the region (Harper et al. Citation2011; Johansson Citation2015a). Temperature measurements from deep bedrock boreholes suggest that permafrost extends to 350–400 m depth (Liljedahl et al. Citation2015). Although, around Kangerlussuaq permafrost is estimated to be 127 ±31 m deep, and at the coast near Sisimiut, where the maritime influence warms soils, permafrost is 33 ±9 m deep (van Tatenhove and Olesen Citation1994). Active-layer depth varies between 0.15 cm and 5 m in the region between the airport at Kangerlussaq and the ice margin, depending on soil and vegetation cover (van Tatenhove and Olesen Citation1994). Near the ice margin, peat-bog borehole measurements at 430 m a.s.l. indicate that active-layer depth is 30 cm (Ingeman-Nielsen et al. Citation2012), while in glaciomarine silts close to Kangerlussuaq Airport (Christiansen et al. Citation2010) the active layer is at least 1.8 m deep and is 2.3 m deep in Sisimiut (van Tatenhove and Olesen Citation1994).
A low-arctic climate characterizes the region with a maritime, cool, and wet coast and a continental, arid, and warmer interior (). Inland at Kangerlussuaq, the mean air annual temperature (MAAT) is −6°C with an annual temperature range of 29°C (−18°C–10.5°C). A smaller temperature range of 19°C (−12°C–7°C) is experienced at the coast where average precipitation is greater than 300 mm yr−1, double that received (~150 mm yr−1) inland (Hasholt and Søgaard Citation1978). However, data collected from Kangerlussuaq Airport indicate that the climate has become warmer since 1974; MAAT between 1974 and 2012 was −5°C, and between 2001 and 2012 it was −3.9°C (Mernild et al. Citation2014). Warming temperatures have also been observed in coastal regions around Greenland (Hanna et al. Citation2012). Mean annual precipitation (MAP) data collected from Kangerlussuaq Airport also demonstrate an insignificant increase; MAP was 242 mm from 1981 to 2012 and 258 mm from 2001 to 2012 (Mernild et al. Citation2015). Inland, as a result of the warm, arid, and continental climate, August evaporation totals can range between 0.83 and 1.62 mm day−1 (Johansson et al. Citation2015b).
The hydrological budgets of the lakes in southwestern Greenland are controlled by regional climate and, in particular, snow cover (Anderson and Stedmon 2007), evaporation, soil temperature, and active-layer inflow (Johansson et al. Citation2015a). The lakes in this study do not receive any water from the GIS and are precipitation driven. The lakes located east of 52°W, at the head of the fjord and toward the ice sheet (; area 1), receive most of their inputs from the surface active layer during the spring melt. Despite maximum precipitation occurring in the summer months (peaks in August) in the inland region (Cappelen Citation2017), the warm, arid, continental climate results in an effective negative precipitation-evaporation ratio, because most water is evaporated or sublimated before it reaches the lakes (Anderson et al. Citation2001; Anderson and Stedmon Citation2007; Böcher Citation1949; Leng and Anderson Citation2003). As a result of the cooler, wetter climate of the coast and the presence of fog banks, which reduce radiative outputs (Hasholt and Søgaard Citation1978), these lakes experience net precipitation gains, receiving water from both precipitation events and large thawing snowpacks throughout the summer months.
Methods
Landsat data covering the study region, occupying the ice-free region of southwestern Greenland between Sisimiut, Kangerlussuaq, and the ice margin (), were used to identify trends in lake surface area during the twenty-two-year period (1995–2017). The Landsat satellite program provides the longest-running available imagery of the study area (Woodcock et al. Citation2008). Additionally, an Advanced Spaceborne Thermal Emission and Reflection Radiometer (ASTER) Global Digital Elevation Model (GDEM), 25 m resolution, from 2011 was used to study the relationship between the development of lakes and their shapes according to their surrounding slope (ASTER Global Digital Elevation Model (Version 2)).
Only Landsat images corresponding with Path 08 and Row 13, which had low cloud cover (less than 20%) and were obtained during the summer months (June, July, and August), were used to minimize seasonal changes in the lakes’ water levels. This is because lake levels in this region generally decline from June to September and remain low until the spring thaw (Johansson et al. Citation2015b). However, these constraints meant that, because of the usual cloudiness of the area (Griggs and Bamber Citation2008), only a limited amount of imagery was suitable for the study. Therefore, although Landsat imagery is available from 1972 (Woodcock et al. Citation2008), only five snapshots for the years 1995, 2002, 2015, 2016, and 2017 were used, because they contained all the necessary requirements for analysis ().
Table 1. Technical details of the imagery used, including date obtained, satellite, spatial resolution and image code. Also listed are the sensor types including Thematic Mapper (TM), Enhanced Thematic Mapper (ETM), Operational Land Imager (OLI), and Advanced Spaceborne Thermal Emission and Reflection Radiometer (ASTER)
To obtain good accuracy delimiting the boundaries of the lakes, Landsat missions with Thematic Mapper sensors were used to compare images from newer satellite data. The Landsat Thematic Mapper introduced three new spectral bands (seven in total), increased spatial resolution from 60 m to 30 m, and improved the spectral and radiometric resolution sensitivity (Schowengerdt Citation2006).
The ASTER is one of the sensors onboard the Terra satellite. The main objective of the mission was to give a holistic approach to the Earth system, providing full coverage. One of the goals, among different conditions such as measuring temperature or reflectance, was the production of a GDEM (Version 2) of one arc-second, being the largest coverage of the earth’s surface (Lillesand, Kiefer, and Chipman Citation2014). The ASTER official GDEM has proved to be suitable for a range of environmental mapping tasks, such as landform studies, at greater than 1:50,000 scales (Hirano, Welch, and Lang Citation2003).
In line with the work of Smith et al. (Citation2005), and because of the spatial resolution of the imagery, only those lakes that were larger than 40 ha in 1995 were considered for analysis. Out of the different bands that Landsat Thematic Mapper provides (Price, Guo, and Stiles Citation2002), the image composite was created by using the Green, Infrared, and SWIR 2 bands, because they highlight deep water (Ji, Zhang, and Wylie Citation2009) following the Modified Normalised Difference Water Index (Xu Citation2006). This approach allows for the differentiation between lakes that receive a high sediment yield because they are hydrologically connected to the ice margin, not included as part of the research, and those that are isolated from the ice margin and receive no glacial input (water or sediment). It is also important to note that only Level-2 Landsat data have been used, which support land-surface change studies as they are atmospherically corrected and ease the comparison between different images and years (USGS Citation2017).
All images were clipped to avoid those areas that had clouds, which could lead to chromatic distortion (Huang et al. Citation2010), and were posteriorly processed using two land-cover pixel classification methods. Lakes from images captured in 2002, 2015, 2016, and 2017 were initially processed using an Iso Cluster Unsupervised Classification (Manjula et al. Citation2011), as the image quality was good enough to automate the process while, because of the 1995 image characteristics, it was deemed that a manual approach via a supervised signature classification method was more suitable (Bahadur Citation2009). However, due to the presence of atmospheric distortions caused by dust and water vapor, and because of the existence of shadows cast by topographic relief in certain areas due to the sun’s position (Ji et al. Citation2015; Knight, Tindall, and Wilson Citation2009), lake limits were more precisely mapped through hand digitization as well.
The study area was divided into three subareas to take into consideration the different climatic and topographical characteristics of the region (; see study sites): areas 1 and 3 have a dry, arid continental climate and a low-lying, undulating topography; area 2 has a cool, wet, maritime climate with a higher mountainous relief. By comparing the surface area of the lakes in 1995, 2002, 2015, 2016, and 2017, it has been possible to identify the trends in the size of the studied lakes. The results are presented as absolute changes in surface area (m2/km2) and percentage changes by area and of the entire region. However, it should be noted that the morphology of lake shores and surrounding areas has an impact on how lake-size change is noticed in an aerial image (Gupta and Banerji Citation1985; Lu et al. Citation2004). Consequently, the results of this study are an indication of the direction of change rather than an accurate quantification of change in this region. Additionally, the average slope of the areas surrounding the lakes has been calculated to check that changes in water content would be observable using satellite imagery. Because all studied lakes have slopes of less than 31°, and 85 percent of them have average inclinations of less than 20°, it can be accepted that the use of orthogonal aerial imagery to represent the directionality of the water-quantity change provides adequate results.
Results
The surface area of the 186 lakes has decreased by approximately 855,450 m2 between 1995 and 2017 (, , , and , ), representing a −0.28 percent decrease in total lake surface area during this period (). Only a small proportion of lakes contributed to this decreasing trend in lake surface area, and just more than half of the lakes experienced no net change in lake surface area: 47 (25.3%) of the 186 lakes increased, 70 (37.6%) decreased, and 69 (37.1%) stayed the same ().
Table 2. Table displaying the change in the surface area of lakes (>40 ha) from the study region by area (1, 2, and 3) in 1995, 2002, 2015, 2016, and 2017, and the net surface-area change (km2, m2, and %) between 1995 and 2017
Figure 2. Map showing the lakes that have not changed in surface area (yellow), have increased in surface area (green), and have decreased in surface area (red) in area 1 between 1995 and 2017. The black square highlights the four closed-basin lakes that increased in lake surface area
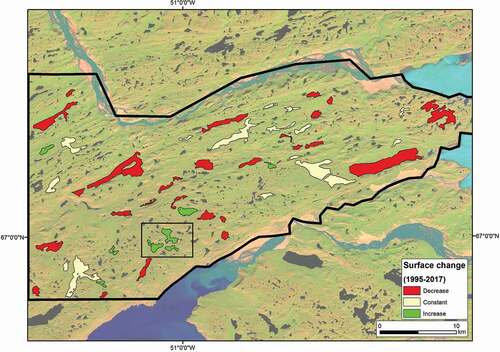
Figure 3. Map showing the lakes that have not changed in surface area (yellow), have increased in surface area (green), and have decreased in surface area (red) in area 2 between 1995 and 2017
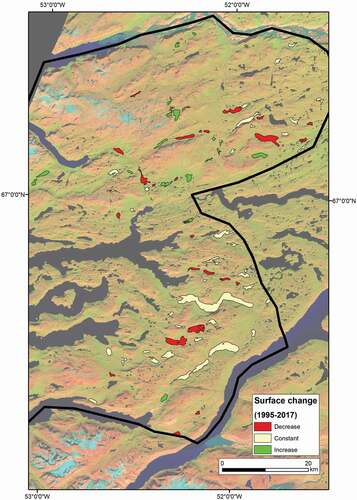
Figure 4. Map showing the lakes that have not changed in surface area (yellow), have increased in surface area (green), and have decreased in surface area (red) in area 3 between 1995 and 2017
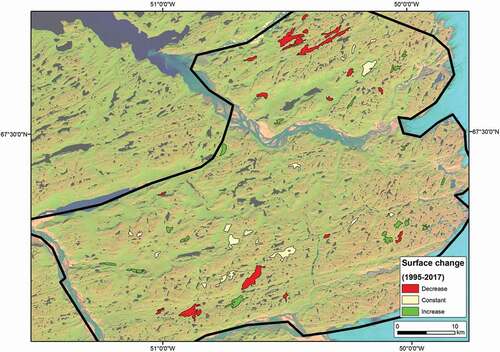
Figure 5. Net changes in lake surface area in m2 for areas 1, 2, 3, and the entire region between 1995 and 2017 (total)
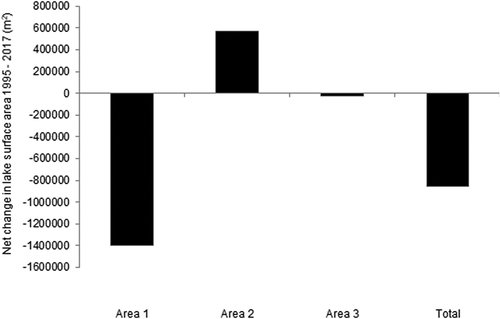
Figure 6. Number of lakes that demonstrated an increase (black), decrease (grey), and no change (white) in lake surface area between 1995 and 2017 for areas 1, 2, and 3. Also displayed above each bar are the change as a percent of the total area and change in m2
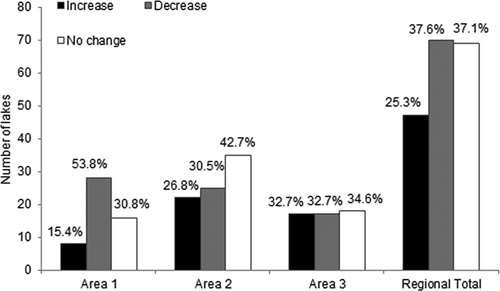
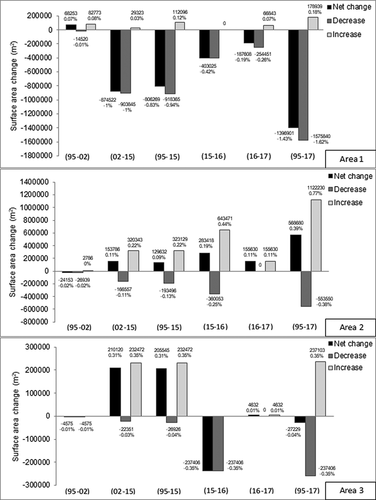
The three study areas exhibit unique overall trends in the direction of net change in lake surface area (, , and ): lakes in area 1 experienced the greatest change in surface area, with a 1,396,900 m2 decline in lake surface area, and the surface area of the lakes in areas 2 and 3 increased and decreased by 568,680 m2 and 27,228 m2, respectively (, ). These values correspond to percentage changes in overall lake surface area of −1.43, 0.39, and −0.04 for study areas 1, 2, and 3 (), respectively, between 1995 and 2017 of the total cumulative change (−0.28%). Net changes in lake surface area were not experienced in a uniform manner across all lakes within the region and individual study areas (, , and ). In area 1 most lakes (twenty-eight) have decreased in lake surface area, whereas the majority of lakes in area 2 (thirty-five) have not changed in surface area. In area 3, approximately a third (eighteen) of the lakes demonstrate no net change in lake surface area (). The largest changes in lake surface area in all three study regions occurred between 1995–2002 and 2015–2016, and only minimal changes in lake surface area occurred during the period 1995–2002 ().
Figure 7. The direction of change in lake surface area in m2 and percent for each area (1, 2, and 3) for 1995–2002 (95–02), 2002–2015 (02–15), 1995–2015 (95–15), 2015–2016 (15–16), 2016–2017 (16–17), and 1995–2017 (95–17). Black represents net change, dark grey represents the decrease, and light grey represents the increase
Discussion
Regional climate intensification and climate change
Changes in lake surface area have been spatially and temporally heterogeneous during the twenty-two-year study period between 1995 and 2017. However, the lakes in area 1 are characterized by a net decrease in lake surface area and the lakes in area 2 by a net increase (, , , and ). Although the net cumulative percentage change of the lakes is small overall (−0.28%), it equates to a loss in lake surface area of 0.86 km2 during the twenty-two-year period (, ). However, only seventy (37.6%) of the lakes are responsible for this net loss in lake surface area in this region, despite some lakes increasing or showing no change in lake surface area (, , , and ).
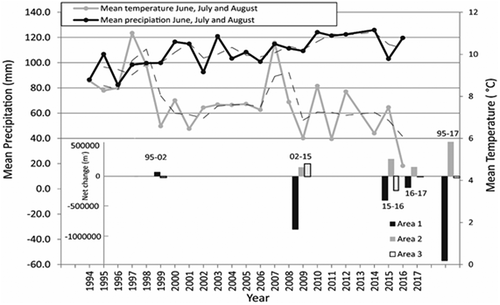
The greatest change in lake surface area is exhibited by area 1 (, , , and , ). Here, despite some lakes increasing in surface area (0.18 km2), the area has experienced a net lake surface-area decrease of 1.4 km2 for the period 1995–2017 (). Conversely, area 2 exhibits a net increase in lake surface area during the twenty-two-year study period of 0.57km2. The contrasting trends in lake surface-area development between area 1 and 2 (, , and ) could reflect changing precipitation and temperature patterns in the region, which have intensified the climatic gradient () present in this region of Greenland (Mernild et al. Citation2015). The hydrological budget of lakes in area 1 is controlled by inputs from the spring snowmelt in early April and May and summer precipitation events. However, net evaporation (including sublimation) is often greater than net precipitation, and most snowmelt and summer precipitation are evaporated before reaching the lakes (Anderson et al. Citation2001; Willemse et al. Citation2004). Area 2, where the greatest increases in lake surface area were displayed (0.57 km2; and ), experiences lower temperatures and evaporation totals relative to area 1, but also greater mean annual precipitation totals (Mernild et al. Citation2014). Between 2001 and 2012 the climatic gradient between Sisimiut (area 2) and Kangerlussuaq (area 1) intensified; Sisimiut experienced an increase in annual precipitation of 48.5 mm w.e. yr−1, while inland at Kangerlussuaq, precipitation decreased by −2.8 mm w.e. yr−1 (Mernild et al. Citation2015). Additionally, meteorological data from Kangerlussauq suggest that mean summer temperatures increased by approximately 2°C between 1995 and 2017 (). The increase in temperature in area 1 may have also raised evaporation rates from lakes and their catchments, which combined with low precipitation totals has contributed to a large decrease in lake surface area relative to area 2, where precipitation increased between 2001 and 2012 (Mernild et al. Citation2015). Higher summer temperatures are also likely to increase the duration of the ice-free period in area 1, allowing higher evaporative losses to take place relative to cooler years when ice cover remains on the lakes longer into the summer months.
Figure 8. The net change in lake surface area of lakes in area 1 (black circle), area 2 (grey circle), and area 1 (white circle) by lake location (longitude) in the regional study area between 1995 and 2017
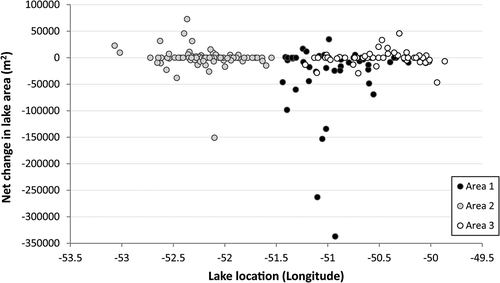
Figure 9. The mean summer (June, July, and August) temperature (T°C) and precipitation (mm) for Kangerlussuaq from 1994 to 2016. Also presented are the net changes in surface area (m2) for the three areas used in the study (area 1 as black, area 2 as grey, and area 3 as white bars) for the time periods 1995–2002 (95–02), 2002−2015 (02–15), 2015–2016 (15–16), 2016–2017 (16–17), and 1995–2017 (95–17). Temperature and precipitation data are taken from Cappelen (Citation2017)
Area 3 displays the smallest net changes in lake surface area and exhibits trends comparable to area 1 between 1995 and 2015; large decreases in lake surface area between 2015 and 2016 resulted in a small net decrease of 0.03 km2 (, ). Meteorological data directly associated with area 3 are not available, making it difficult to suggest why these trends are apparent. However, precipitation trends demonstrate complex spatial and temporal patterns in Greenland (Mernild et al. Citation2015), and microclimate can vary across short distances and between lake catchments (Henkner, Scholten, and Kühn Citation2016; Johansson et al. Citation2015a). Furthermore, these results may suggest that other catchment scale factors interact with climate to produce variable trends in lake surface area.
The largest changes in lake surface area across the region occurred between 2002 and 2015 (), suggesting that a significant change in precipitation, temperature, evaporation, and catchment conditions (e.g., change in active-layer depth) may have occurred at most of the lakes during this time period. This period is associated with the warmest summers (June, July, and August) on record (1965–2006) during 2003, 2005, and 2006 (Hanna et al. Citation2008) and 2010 and 2012 (Cappelen Citation2017), and could account for these temporal trends in lake surface-area change through increased evaporation from the lake and catchment combined with a longer ice-free period. During the same time interval (2002–2015) the largest increases in lake surface area in area 2 were also recorded (, ), possibly reflecting increased precipitation, and the intensification of the regional climatic gradient in this region was most pronounced during this time period (Mernild et al. Citation2015).
Lake catchment characteristics
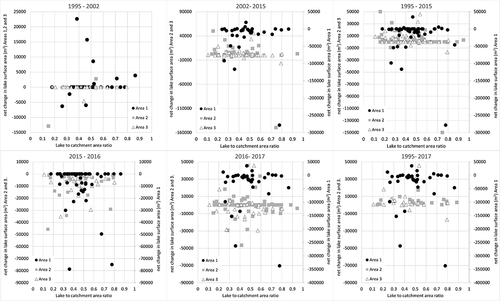
Lake catchment geomorphology plays an important role in producing heterogeneous changes in lake surface area in response to changes in precipitation and temperature. Lakes that occupy steep, high-sided catchments will not likely display a change in lake surface area that can be detected by the methodology used. Lake catchments with large flat catchments and shallow bathymetries are more sensitive to increases and decreases in lake surface area through changes in precipitation, temperature, and evaporation and increased active-layer depth or through-talik recharge. Additionally, the altitude of the outflow limits how much the lake level can increase before water flows out of the catchment. Compared to the larger lakes, the smaller study lakes (< ~3000000m2) demonstrate greater net changes in lake surface area (). The smaller lakes (< ~3000000m2) from areas 1 and 2 show the greatest net change. These results highlight further the possible connections between the lakes and the intensification of the regional climate in areas 1 and 2. Although lakes with a higher surface area lose more water through evaporation, they are not as sensitive to evaporation increases as smaller lakes (; area 1), which lose a higher proportion of their water compared to large lakes. Similarly, smaller lakes (; area 2) are more sensitive to precipitation increases or hydrological input from other sources in the catchment (e.g., the active layer). Furthermore, lakes with a large lake:catchment area ratio are likely buffered against large-scale changes in the hydrological budget compared to lakes with a small catchment area:lake ratio. To test whether lake:catchment area ratios ratios contributed to the heterogeneity of lake-level response in the study lakes, catchment lake areas were plotted against net surface-area change (). The results highlight that catchment:lake ratios are not a reliable indicator of determining lake surface-area response to increases or decreases in water content (). Geomorphological differences could allow lakes with the same lake:catchment area ratio, which receive the same hydrological inputs and outputs, to respond differently. Two lakes with the same catchment:lake area ratio could have contrasting geomorphologies: one could have a really high, steep catchment and be sensitive to change whereas the other could have a flatter catchment and be more sensitive to change. This is demonstrated by a number of lakes as highlighted in .
Figure 10. Net change in lake surface area (m2) plotted against lake surface area (m2) for area 1 (black circle), area 2 (grey circle), and area 3 (white circle) for the study region
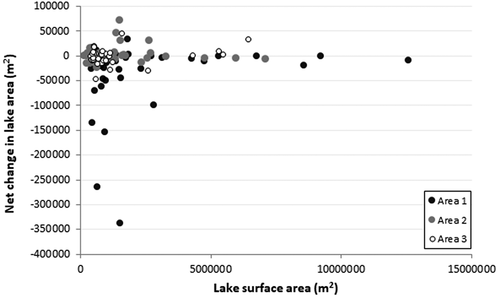
Figure 11. The net change in lake surface area (m2) plotted against lake:catchment area ratio for area 1 (black circle), area 2 (grey square), and area 3 (triangle) for the time periods 1995–2002, 2002–2015, 2015–2016, 2016–2017, and 1995–2017
The lakes have not evolved in a uniform way, with approximately 37.1 percent of lakes demonstrating no net change in lake surface area, and 25.3 percent and 37.6 percent displaying an increase and a decrease, respectively (). Regional climatic differences and catchment geomorphology may account for some of this variability. Lake catchments have unique geomorphological and biotic characteristics, which can interact with climate to produce variable lake responses (Law, Anderson, and McGowan Citation2015). Vegetation type and density could, at some lakes (e.g., area 1), cause elevated rates of evapotranspiration and accelerate lake surface-area loss. Within a lake catchment, ground surface and air temperatures can vary depending on slope, aspect, vegetation cover, soil type, and thickness and duration of snow cover. Therefore, permafrost and active-layer depth and the hydrology of catchments may also vary considerably within and between lake catchments. For example, south-facing slopes generate deeper active-layer melting (Lewis, Lafrenière, and Lamoureux Citation2012) and lakes also experience their own microclimate (Henkner, Scholten, and Kühn Citation2016; Johansson et al. Citation2015a). For example, in area 1 high evaporation rates cannot account for the increase in lake level of ten lakes between 1995 and 2017, four of which are closed basins (). This evidence suggests that an alternative mechanism could be responsible for the increase in the surface area of these lakes. One possible mechanism is that temperature increases and precipitation decreases in area 1 are increasing active-layer depth, causing water to infiltrate through to the lower areas of the catchment and to accumulate in the closed basins. Another possible mechanism is that some of the lakes may be underlain by a through-talik, which is causing groundwater to recharge the lakes. Deep permafrost in this region (up to 300 m) is assumed to limit any lake recharge from the groundwater store. However, the permafrost is less deep in some areas and may not be continuous in extent (Henkner et al. Citation2016: Johansson et al. Citation2015b). Additionally, warmer air temperatures may promote increased lake temperatures for longer periods of time, which can facilitate increased talik depths under lakes (Romanovsky, Smith, and Christiansen Citation2010; Vaughan et al. Citation2013). It is unknown whether through-taliks (the area under a lake where permafrost is thawed and connects the lake with the groundwater) exist under any of the study lakes; however, a through-talik has been identified under Two Boat Lake in southwestern Greenland, which provides small contributions to lake recharge (Harper et al. Citation2011; Johansson et al. Citation2015b). Furthermore, it is proposed that through-taliks may exist under large lakes (> 400 m in diameter) in southwestern Greenland, equivalent to 20 percent of lakes (Liljedahl et al. Citation2015). Consequently, despite the presence of continuous permafrost in this region, through-taliks could become more widespread because of recent increases in air, soil, and lake temperatures (Romanovsky, Smith, and Christiansen Citation2010; Vaughan et al. Citation2013) acting as possible recharge and discharge pathways between lakes and the groundwater store (Bosson et al. Citation2013; Kane, Yoshikawa, and McNamara Citation2013).
Conclusion and wider implications
Trends in the lake surface-area evolution of 186 lakes in the continuous permafrost area of southwestern Greenland during a twenty-two-year period (1995–2017) are heterogeneous. However, it is important to consider the effect of local climatic differences on trends in lake surface-area evolution. When lake surface-area trends were examined based on their location under the climatic gradient (e.g., area 1 and area 2), directional trends in lake surface-area development become apparent (e.g., net decrease in area 1 and net increase in area 2). Although not all lakes demonstrate any variation in lake surface area, the trends identified in this study suggest that changes in the regional climatic gradient in southwestern Greenland combined with lake catchment geomorphology (e.g., catchment:lake ratio, lake surface area, aspect, microclimate, etc.) could account for heterogeneous lake-surface development in this region. Heterogeneous trends in lake number, size, and evolution have been reported in other continuous and discontinuous permafrost regions, including arctic Alaska (Hinkel et al. Citation2007; Riordan, Verbyla, and McGuire Citation2006), Canada (Carroll et al. Citation2011), Siberia (Karlsson, Lyon, and Destouni Citation2014; Smith et al. Citation2005), and Norway (Sannel and Kuhry Citation2011). However, only one Canadian study has attributed these heterogeneous trends to the interaction of landscape and climatic drivers (Carroll et al. Citation2011).
In response to climate change in the Arctic (i.e., increased temperatures and precipitation), permafrost is predicted to become less extensive, and the active layer is expected to increase in thickness (Serreze et al. Citation2000). Furthermore, permafrost simulations suggest a decrease in near-surface permafrost in the next decade (Lawrence, Slater, and Swenson Citation2012). There are limited data available for permafrost degradation and the extent of the active layer in southwestern Greenland. However, increasing lake surface area at some sites where temperature increases have caused a net decrease in lake level (area 1) highlight the need to determine active-layer changes. Although the lakes in this region are not thermokarst lakes, increases in the lake surface area of some of the closed lakes may suggest the onset of permafrost degradation in some lake catchments. Additionally, lake altitude may account for some of the variability in lake surface area; lakes with a higher elevation may not warm as much as lower-altitude lakes.
The lakes of southwestern Greenland cover a large surface area in this region of the Arctic and are important ecosystems and sediment and carbon sinks and sites for biogeochemical cycling in the landscape. This region is already undergoing changes in response to climate change (Anderson et al. Citation2017), and this study has highlighted that regional climate changes and catchment geomorphology may be important controls on lake development in these lake systems. However, much more data are needed to understand how climate will interact with lakes and their catchments in this region and to determine whether the active layer is increasing in depth. In particular, long-term regional and catchment-scale trends in climate need to be used in conjunction with lake catchment Digital Elevation Models to determine regional-scale lake response to precipitation and temperature changes in the future.
Acknowledgments
The authors gratefully acknowledge funding from the School of Geography, Geology and the Environment, Keele University, to support this project. We would also like to thank two anonymous reviewers, whose comments have improved the manuscript, and the helpful comments from a third anonymous individual who also provided suggestions as to how to improve this manuscript.
Disclosure statement
No potential conflict of interest was reported by the authors.
References
- Abnizova, A., J. Siemens, M. Langer, and J. Boike. 2012. Small ponds with major impact: The relevance of ponds and lakes in permafrost landscapes to carbon dioxide emissions. Global Biogeochemical Cycles 26(2). doi:https://doi.org/10.1029/2011GB004237.
- Anderson, N. J., and C.A. Stedmon. 2007. The effect of evapoconcentration on dissolved organic carbon concentration and quality in lakes of SW Greenland. Freshwater Biology 52(2):1–16.
- Anderson, N. J., R. Harriman, D. B. Ryves, and S. T. Patrick. 2001. Dominant factors controlling variability in the ionic composition of West Greenland lakes. Arctic, Antarctic, and Alpine Research 33(4):418–25.
- Anderson, N. J., J. E. Saros, J. E. Bullard, S. M. Cahoon, S. McGowan, E. A. Bagshaw, C. D. Barry, R. Bindler, B. T. Burpee, J. L. Carrivick, et al. 2017. The Arctic in the Twenty-First Century: Changing Biogeochemical Linkages across a Paraglacial Landscape of Greenland. BioScience 67(2):118–33.
- ASTER Global Digital Elevation Model (Version 2) https://lpdaac.usgs.gov/dataset_discovery/aster/aster_products_table/astgtm
- Bahadur, K. C., . K. 2009. Improving Landsat and IRS Image Classification: Evaluation of Unsupervised and Supervised Classification through Band Ratios and DEM in a Mountainous Landscape in Nepal. Remote Sensing 1(4):1257.
- Böcher, T. W. 1949. Climate, Soil, and Lakes in Continental West Greenland in Relation to Plant Life: Den Botaniske Ekspedition Til Vestgrønland 1946. Copenhagen: Reitzel.
- Bosson, E., J. O. Selroos, M. Stigsson, L. G. Gustafsson, and G. Destouni. 2013. Exchange and pathways of deep and shallow groundwater in different climate and permafrost conditions using the Forsmark site, Sweden, as an example catchment. Hydrogeology Journal 21(1):225–37.
- Cappelen, J. ed. 2017. Weather observations from Greenland 1958-2016, 17–18. Copenhagen, Denmark: Danish Meteorological Institute, DMI Rep.
- Carroll, M. L., J. R. G. Townshend, C. M. DimicelI, T. Loboda, and R. A. Sohlberg. 2011. Shrinking lakes of the Arctic: Spatial relationships and trajectory of change. Geophysical Research Letters 38(20). doi:https://doi.org/10.1029/2011GL049427.
- Christiansen, H. H., B. Etzelmüller, K. Isaksen, H. Juliussen, H. Farbrot, O. Humlum, M. Johansson, T. Ingeman‐Nielsen, L. Kristensen, J. Hjort, et al. 2010. The thermal state of permafrost in the Nordic area during the International Polar Year 2007–2009. Permafrost and Periglacial Processes 21(2):156–81.
- Fitzpatrick, A. A. W., A. L. Hubbard, J. E. Box, D. J. Quincey, D. van As, A. P. B. Mikkelsen, S. H. Doyle, C. F. Dow, B. Hasholt, and G. A. Jones. 2014. A decade (2002-2012) of supraglacial lake volume estimates across Russell Glacier, West Greenland. Cryosphere 8(1):107–21.
- Francis, J. A., D. M. White, J. J. Cassano, W. J. Gutowski, L. D. Hinzman, M. M. Holland, M. A. Steele, and C. J. Vörösmarty. 2009. An arctic hydrologic system in transition: Feedbacks and impacts on terrestrial, marine, and human life. Journal of Geophysical Research: Biogeosciences 114(G4). doi:https://doi.org/10.1029/2008JG000902.
- Griggs, J. A., and J. L. Bamber. 2008. Assessment of cloud cover characteristics in satellite datasets and reanalysis products for Greenland. Journal of Climate 21(9):1837–49.
- Gupta, R. P., and S. Banerji. 1985. Monitoring of reservoir volume using LANDSAT data. Journal of Hydrology 77(1):159.
- Hanna, E., P. Huybrechts, K. Steffen, J. Cappelen, R. Huff, C. Shuman, T. Irvine-Fynn, S. Wise, and M. Griffiths. 2008. Increased runoff from melt from the Greenland Ice Sheet: A response to global warming. Journal of Climate 21(2):331–41.
- Hanna, E., S. H. Mernild, J. Cappelen, and K. Steffen. 2012. Recent warming in Greenland in a long-term instrumental (1881–2012) climatic context: I. Evaluation of surface air temperature records. Environmental Research Letters 7(4):045404.
- Harper, J., A. Hubbard, T. Ruskeeniemi, L. Claesson Liljedahl, A. Lehtinen, A. Booth, D. Brinkerhoff, H. Drake, C. Dow, S. Doyle, et al. 2011. The Greenland Analogue Project Yearly Report 2010. Swedish Nuclear Fuel and Waste Management Co., Report SKB R- 11–23.
- Hasholt, B., and H. Søgaard. 1978. Et forsøg på en klimatisk-hydrologisk regionsinddeling af Holsteinsborg Kommune (Sisimiut). Geografisk Tidsskrift-Danish Journal of Geography 77(1):72–92.
- Henkner, J., T. Scholten, and P. Kühn. 2016. Soil organic carbon stocks in permafrost-affected soils in West Greenland. Geoderma 282:147–59.
- Hinkel, K. M., B. M. Jones, W. R. Eisner, C. J. Cuomo, R. A. Beck, and R. Frohn. 2007. Methods to assess natural and anthropogenic thaw lake drainage on the western Arctic coastal plain of northern Alaska. Journal of Geophysical Research: Earth Surface 112(F2). doi:https://doi.org/10.1029/2006JF000584.
- Hirano, A., R. Welch, and H. Lang. 2003. Mapping from ASTER stereo image data: DEM validation and accuracy assessment. ISPRS Journal of Photogrammetry and Remote Sensing 57(5):356–70.
- Hobbs, W. O., R. J. Telford, H. J. B. Birks, J. E. Saros, R. R. Hazewinkel, B. B. Perren, É. Saulnier-Talbot, and A. P. Wolfe. 2010. Quantifying recent ecological changes in remote lakes of North America and Greenland using sediment diatom assemblages. PloS One 5(4):e10026
- Huang, C., S. N. Goward, J. G. Masek, N. Thomas, Z. Zhu, and J. E. Vogelmann. 2010. An automated approach for reconstructing recent forest disturbance history using dense Landsat time series stacks. Remote Sensing of Environment 114(1):183–98.
- Ingeman-Nielsen, T., S. Tomaškovičo Vá, S. H. Larsen, S. F. Aparício, and P. Gori. 2012. Surface geophysical measurements for locating and mapping ice-wedges. Cold Regions Engineering 2012: Sustainable infrastructure development in a changing cold environment, 634–43.
- Jensen, S. M., H. Hansen, K. Secher, A. Steenfelt, F. Schjøth, and T. M. Rasmussen. 2002. Kimberlites and other ultramafic alkaline rocks in the Sisimiut–Kangerlussuaq region, southern West Greenland. Geology of Greenland Survey Bulletin 191:57–66.
- Ji, L., P. Gong, X. Geng, and Y. Zhao. 2015. Improving the accuracy of the water surface cover type in the 30 m FROM-GLC product. Remote Sensing 7(10):13507–27.
- Ji, L., L. Zhang, and B. Wylie. 2009. Analysis of dynamic thresholds for the normalized difference water index. Photogrammetric Engineering & Remote Sensing 75(11):1307–17.
- Johansson, E., S. Berglund, T. Lindborg, J. Petrone, D. van As, L. G. Gustafsson, J. O. Näslund, and H. Laudon. 2015a. Hydrological and meteorological investigations in a periglacial lake catchment near Kangerlussuaq, west Greenland–Presentation of a new multi-parameter data set. Earth System Science Data 7(1):93–108.
- Johansson, E., L. G. Gustafsson, S. Berglund, T. Lindborg, J. O. Selroos, L. C. Liljedahl, and G. Destouni. 2015b. Data evaluation and numerical modeling of hydrological interactions between active layer, lake and talik in a permafrost catchment, Western Greenland. Journal of Hydrology 527:688–703.
- Jones, B. M., G. D. A. C. Grosse, C. D. Arp, M. C. Jones, K. M. Walter Anthony, and V. E. Romanovsky. 2011. Modern thermokarst lake dynamics in the continuous permafrost zone, northern Seward Peninsula, Alaska. Journal of Geophysical Research: Biogeosciences 116(G2). doi: https://doi.org/10.1029/2011JG001666.
- Kane, D. L., K. Yoshikawa, and J. P. McNamara. 2013. Regional groundwater flow in an area mapped as continuous permafrost, NE Alaska (USA). Hydrogeology Journal 21(1):41–52.
- Karlsson, J. M., S. W. Lyon, and G. Destouni. 2014. Temporal behavior of lake size-distribution in a thawing permafrost landscape in northwestern Siberia. Remote Sensing 6(1):621–36.
- Kattsov, V. M., E. Källén, H. P. Cattle, J. Christensen, H. Drange, I. Hanssen-Bauer, T. Jóhannesen, I. Karol, J. Räisänen, G. Svensson, et al. 2005. Future climate change: Modeling and scenarios for the Arctic. Cambridge: Cambridge University Press, pp. 99–150.
- Kaufman, D. S., D. P. Schneider, N. P. McKay, C. M. Ammann, R. S. Bradley, K. R. Briffa, G. H. Miller, B. L. Otto-Bliesner, J. T. Overpeck, B. M. Vinther, et al. 2009. Recent warming reverses long-term Arctic cooling. Science 325(5945):1236–39.
- Knight, A. W., D. R. Tindall, and B. A. Wilson. 2009. A multitemporal multiple density slice method for wetland mapping across the state of Queensland, Australia. International Journal of Remote Sensing 30(13):3365–92.
- Knight, P. G., C. E. Jennings, R. I. Waller, and Z. P. Robinson. 2007. Changes in ice‐margin processes and sediment routing during ice‐sheet advance across a marginal moraine. Geografiska Annaler: Series A, Physical Geography 89(3):203–15.
- Law, A. C., N. J. Anderson, and S. McGowan. 2015. Spatial and temporal variability of lake ontogeny in south-western Greenland. Quaternary Science Reviews 126:1–16.
- Lawrence, D. M., A. G. Slater, and S. C. Swenson. 2012. Simulation of present-day and future permafrost and seasonally frozen ground conditions in CCSM4. Journal of Climate 25(7):2207–25.
- Leng, M. J., and N. J. Anderson. 2003. Isotopic variation in modern lake waters from western Greenland. The Holocene 13(4):605–11.
- Lewis, T., M. J. Lafrenière, and S. F. Lamoureux. 2012. Hydrochemical and sedimentary responses of paired High Arctic watersheds to unusual climate and permafrost disturbance, Cape Bounty, Melville Island, Canada. Hydrological Processes 26(13):2003–18.
- Liljedahl, L. C., A. Lehtinen, J. Harper, J. O. Näslund, J. O. Selroos, P. Pitkänen, and P. Vidstrand, 2015: The Greenland Analogue Project: Final Report. Swedish Nuclear. Fuel Waste Managment. Company.
- Lillesand, T., R. W. Kiefer, and J. Chipman. 2014. Remote sensing and image interpretation. New York: John Wiley & Sons.
- Lu, D., P. Mausel, E. Brondizio, and E. Moran. 2004. Change detection techniques. International Journal of Remote Sensing 25(12):2365–401.
- Manjula, K. R., S. Jyothi, S. A. K. Varma, and S. V. Kumar. 2011. Construction of Spatial Dataset from Remote Sensing using GIS for Deforestation Study. International Journal of Computer Applications 31(10):26–32.
- Mayewski, P. A., S. B. Sneed, S. D. Birkel, A. V. Kurbatov, and K. A. Maasch. 2014. Holocene warming marked by abrupt onset of longer summers and reduced storm frequency around Greenland. Journal of Quaternary Science 29(1):99–104.
- Mernild, S. H., E. Hanna, J. R. McConnell, M. Sigl, A. P. Beckerman, J. C. Yde, J. Cappelen, J. K. Malmros, and K. Steffen. 2015. Greenland precipitation trends in a long‐term instrumental climate context (1890–2012): Evaluation of coastal and ice core records. International Journal of Climatology 35(2):303–20.
- Mernild, S. H., E. Hanna, J. C. Yde, J. Cappelen, and J. K. Malmros. 2014. Coastal Greenland air temperature extremes and trends 1890–2010: Annual and monthly analysis. International Journal of Climatology 34(5):1472–87.
- Perren, B. B., R. S. Bradley, and P. Francus. 2003. Rapid lacustrine response to recent High Arctic warming: A diatom record from Sawtooth Lake, Ellesmere Island, Nunavut. Arctic, Antarctic, and Alpine Research 35(3):271–78.
- Post, E., M. C. Forchhammer, M. S. Bret-Harte, T. V. Callaghan, T. R. Christensen, B. Elberling, A. D. Fox, O. Gilg, D. S. Hik, T. T. Høye, et al. 2009. Ecological dynamics across the Arctic associated with recent climate change. Science 325(5946):1355–58.
- Price, K. P., X. Guo, and J. M. Stiles. 2002. Optimal Landsat TM band combinations and vegetation indices for discrimination of six grassland types in eastern Kansas. International Journal of Remote Sensing 23(23):5031–42.
- Pritchard, H. D., R. J. Arthern, D. G. Vaughan, and L. A. Edwards. 2009. Extensive dynamic thinning on the margins of the Greenland and Antarctic ice sheets. Nature 461(7266):971–75.
- Riordan, B., D. Verbyla, and A. D. McGuire. 2006. Shrinking ponds in subarctic Alaska based on 1950–2002 remotely sensed images. Journal of Geophysical Research: Biogeosciences 111(G4). doi: https://doi.org/10.1029/2005JG000150.
- Romanovsky, V. E., S. L. Smith, and H. H. Christiansen. 2010. Permafrost thermal state in the polar Northern Hemisphere during the international polar year 2007–2009: A synthesis. Permafrost and Periglacial Processes 21(2):106–16.
- Rühland, K. M., A. M. Paterson, and J. P. Smol. 2015. Lake diatom responses to warming: Reviewing the evidence. Journal of Paleolimnology 54(1):1–35.
- Sannel, A. B. K., and P. Kuhry. 2011. Warming‐induced destabilization of peat plateau/thermokarst lake complexes. Journal of Geophysical Research: Biogeosciences 116(G3). doi: https://doi.org/10.1029/2010jg001635.
- Schowengerdt, R. A. 2006. Remote sensing: Models and methods for image processing. London: Elsevier.
- Serreze, M. C., J. E. Walsh, F. S. Chapin, T. Osterkamp, M. Dyurgerov, V. Romanovsky, W. C. Oechel, J. Morison, T. Zhang, and R. G. Barry. 2000. Observational evidence of recent change in the northern high-latitude environment. Climatic Change 46(1–2):159–207.
- Smith, L. C., Y. Sheng, G. M. Macdonald, and L. D. Hinzman. 2005. Disappearing Arctic Lakes. Science 308(5727):1429–1429.
- Stocker, T. ed. 2014: The physical science basis: Working Group I contribution to the fifth assessment report of the Intergovernmental Panel on Climate Change. Cambridge: Cambridge University Press.
- Tranvik, L. J., J. A. Downing, J. B. Cotner, S. A. Loiselle, R. G. Striegl, T. J. Ballatore, P. Dillon, K. Finlay, K. Fortino, L. B. Knoll, et al. 2009. Lakes and reservoirs as regulators of carbon cycling and climate. Limnology and Oceanography 54(6part2):2298–314.
- USGS, 2017: Landsat surface reflectance level-2 science products, https://landsat.usgs.gov/landsat-surface-reflectance-data-products
- van Tatenhove, F. G., and O. B. Olesen. 1994. Ground temperature and related permafrost characteristics in West Greenland. Permafrost and Periglacial Processes 5(4):199–215.
- van Tatenhove, F. G., J. J. van der Meer, and E. A. Koster. 1996. Implications for deglaciation chronology from new AMS age determinations in central West Greenland. Quaternary Research 45(3):245–53.
- Vaughan, D. G., J. C. Comiso, I. Allison, J. Carrasco, G. Kaser, R. Kwok, P. Mote, T. Murray, F. Paul, J. Ren, et al. 2013. Observations: Cryosphere. In The physical science basis: Working Group I contribution to the fifth assessment report of the Intergovernmental Panel on Climate Change. Cambridge: Cambridge University Press.
- Wagner, B., and O. Bennike. 2012. Chronology of the last deglaciation and Holocene environmental changes in the Sisimiut area, SW Greenland based on lacustrine records. Boreas 41(3):481–93.
- Willemse, N. W., O. van Dam, P. J. van Helvoort, R. Dankers, M. Brommer, J. Schokker, T. E. Valstar, and H. de Wolf. 2004. Physical and chemical limnology of a subsaline athalassic lake in West Greenland. Hydrobiologia 524(1):167–92.
- Williams, W. D. 1991. Comments on the so-called salt lakes of Greenland. Hydrobiologia 210(1):67–74.
- Woodcock, C. E., R. Allen, M. Anderson, A. Belward, R. Bindschadler, W. Cohen, F. Gao, S. N. Goward, D. Helder, E. Helmer, et al. 2008. Free access to landsat imagery. Science 320(5879):1011–1011.
- Xu, H. 2006. Modification of normalised difference water index (NDWI) to enhance open water features in remotely sensed imagery. International Journal of Remote Sensing 27(14):3025–33.
- Zwally, J., and M. Giovinetto. 2001. Balance mass flux and ice velocity across the equilibrium line in drainage systems of Greenland. Journal of Geophysical Research. D. Atmospheres 106:33.