
ABSTRACT
During recent decades, lake levels in the Yukon Flats region of interior Alaska have fluctuated dramatically. However, prior to recorded observations, no data are available to indicate if similar or more extreme variations occurred during past centuries and millennia. This study explores the history of Yukon Flats lake origins and lake levels for the past approximately 5,500 years from sediment analyses guided by previous work on permafrost extent, thermokarst, and modern isotope hydrology. Sediments dated by 210Pb and AMS radiocarbon indicate stable chronologies following initial lake initiation. Subsequent lithology is autochthonous, and oxygen isotope ratios of endogenic carbonate reflect lake level change at multiple time scales. Sediment results indicate high lake levels between approximately 4000 and 1850 cal yr BP, which is interpreted to reflect wetter-than-modern conditions. Lower lake levels with short-lived high stands during the past approximately 800 years reflect generally arid conditions with brief wet intervals similar to the region’s moisture regime today. The millennial trend is one of increasing aridity and corresponds closely with fire reconstructions and regional paleoclimatic trends. We conclude that high-magnitude lake-level fluctuations and decadal scale trends occurred before the observational period and are persistent hydroclimatic features of the Yukon Flats region.
Introduction
Observations of lake-level declines between the late 1980s and 2014 in interior and northern Alaska subsequently generated efforts to identify spatial distributions, causes and mechanisms, and ecological impacts (Riordan, Verbyla, and McGuire Citation2006; Smith et al. Citation2005). Early studies focused on continuous permafrost regions and implicated warmer summer temperatures with an emphasis on the role of permafrost degradation and thermokarst draining (Hinzman et al. Citation2005). Subsequent assessments were broadened to include Subarctic boreal regions with discontinuous permafrost distributions, such as the Yukon Flats (YF) of interior Alaska (). In addition to permafrost change, they highlighted the significance of surface–groundwater connections and direct climatic influences on lake hydrology and water budgets (Anderson et al. Citation2013; Jepsen et al. Citation2012; Lewis et al. Citation2014; Roach et al. Citation2011; Rover, Wylie, and Tieszen Citation2012).
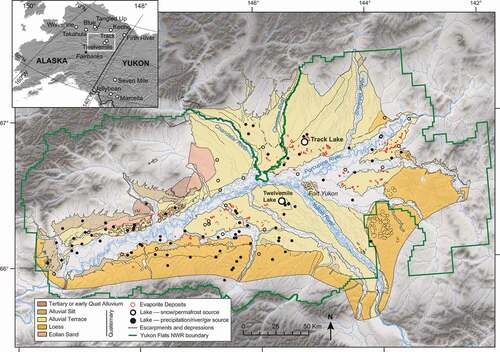
Figure 1. Location of the Yukon Flats (inset) is shown on a digital elevation model (30 m), with surficial geology by Williams (Citation1962) and the locations of Twelvemile and Track Lakes (large white circle symbols) and the locations of evaporite deposits (red-filled circle symbols) from Clautice and Mowatt (Citation1981). Lakes from Anderson et al. (Citation2013) are indicated as small open circle symbols for those with 18O-depleted water sources, such as snow and permafrost. Black-filled circle symbols indicate lakes sourced by precipitation, rivers, and groundwater (gw). The inset shows the locations of additional sites discussed in the text
The YF landscape and its Holocene history of thermokarst evolution appears to differ from other thermokarst-affected regions of Alaska (Edwards et al. Citation2016). Most notably, current lake-expansion rates are relatively low and thermokarst does not show broadly distributed evidence for extensive lake draining (e.g., Jones and Arp Citation2015) or multiple lake generations within one basin, such as observed in the northern Yukon Territory (Lauriol et al. Citation2009). Evidence suggests that following widespread early Holocene permafrost degradation and thermokarst initiation, the YF landscape has since been relatively stable, most likely because of the establishment of dense boreal forest cover and the insulating effect it has on permafrost.
Discontinuous permafrost distributions and widespread surface–groundwater connectivity are known to occur throughout the YF region (Hawkins Citation1995; Minsley et al. Citation2012; Williams Citation1970). To date, changes in YF permafrost have only been detected at shallow depths, and the subsequent influence by changes in groundwater-surface interactions on recent lake declines appears to be relatively minor (Jepsen et al. Citation2012, Citation2013; Riordan, Verbyla, and McGuire Citation2006).
Climate controls on YF lake levels are clearly indicated by substantial lake evaporation, as reflected by high dissolved ion concentrations and the wide occurrence of evaporite deposits (; Clautice and Mowatt Citation1981; Heglund and Jones Citation2003). Changes in lake hydrologic balance in response to climate are also reflected by lake-water oxygen and hydrogen isotope ratios (δ18O and δ2H) as they evolve in response to changing hydrologic fluxes (Gibson, Birks, and Yi Citation2016), including lakes of thermokarst origin (MacDonald et al. Citation2017). Lake-water evaporation leads to enrichment in heavy isotopes (18O for oxygen and 2H for hydrogen) and is also promoted by restricted or closed-lake hydrology with lower lake levels.
Extensive YF lake-water isotope sampling () between 2007 and 2011 by Anderson et al. (Citation2013) revealed that lake isotopic enrichment is closely associated with long-term lake-level declines, low relative humidity, increased temperatures, and reduced precipitation. Remote sensing inventories for 1985 through 2011 also indicate that hydrologically closed YF lakes are more vulnerable to declining levels. A higher proportion of closed-basin lakes have declined (15%, Chen et al. Citation2014) compared with the proportion of all lakes (open and closed) that have declined (3.4%, Rover, Wylie, and Tieszen Citation2012).
To develop a long-term context and better understanding of the significance of recent YF lake fluctuations, this study examines sediment records from two sites that have recently changed dramatically in response to climate: Twelvemile and Track Lakes (). Both lakes underwent sustained water losses during the past two decades, with approximately 80 percent volume declines and subsequent enrichment in heavy oxygen and hydrogen isotopes in their lake water. Both lakes have also undergone full recovery to maximum lake levels within a thirteen-month period between 2014 and 2015 in response to higher than average precipitation. The lakes are located in similar settings in terms of surficial geology, vegetation, permafrost distributions, and surface–groundwater connectivity. Evidence presented here for stable radiocarbon chronologies and autochthonous lithology further indicates that following initial lake formation, minimal permafrost-induced changes in shorelines or basin morphometry has occurred.
Twelvemile and Track Lakes are alkaline and undergo endogenic carbonate (CaCO3) precipitation and sedimentation. The sediment records therefore provide continuous calcium carbonate oxygen isotope ratios (δ18OCaCO3). The δ18OCaCO3 values reflect the values for past lake water (δ18OH2O), which in turn reflects lake hydrology, lake levels, and climate (Anderson et al. Citation2016; Leng et al. Citation2005). Additional sediment measurements, lake-water δ18OH2O observations, climate records, lake-level histories, and isotope mass balance model sensitivity experiments further inform the paleoclimatic interpretation of the Track and Twelvemile lakes δ18OCaCO3 records. The combined data sets indicate that they accurately reflect lake-level fluctuations during the observational period and thereby provide a record of lake-level change in response to hydroclimate over long timescales beyond the period of monitoring. Our results show that recent YF lake-level dynamics are within the variation experienced during the past approximately 4,000 years and suggest that these lake systems are strongly resilient to climate-induced perturbations.
Study area
Track and Twelvemile lakes are located on alluvial lowlands within the Yukon Flats National Wildlife Refuge (YFNWR), which encompasses the confluence of the Yukon, Chandalar, Sheenjek, and Porcupine Rivers (). Surrounding highlands include a dissected southern marginal upland 30–150 m higher than the lowlands. The YF basin is bounded by the Brooks Range to the north, Hodzana Highlands, White and Crazy Mountains, and Porcupine Plateau to the south, and Porcupine Plateau to the east. Alluvial lowland YF vegetation is characterized by a dynamic mosaic of open meadow, spruce forest (Picea glauca and P. mariana), birch forest (Betula neoalaskana and Populus tremuloides), and tall shrubs (salix and alnus; e.g., Jorgenson et al. Citation2010). Fire is the principal large-scale disturbance (Drury and Grissom Citation2008). Continuous and discontinuous permafrost distribution leads to abundant surface water such as bogs, fens, wetlands, and lakes. Lakes are principally of thermokarst, eolian, and fluvial origin because the area was unglaciated during the Pleistocene (Williams Citation1970).
The YFNWR is one of the most productive waterfowl breeding areas in North America, and lake levels are relevant to management. Preliminary YFNWR ground-based assessments by Rose and Guldager (Citation2012) in the fall of 2010 explored relationships between lake levels, soils, groundwater, and permafrost and found a general lack of permafrost around two drying lakes. In contrast, permafrost was more frequently encountered around two expanding lakes and one lake with stable levels. In general, water-table depths during the growing season did not significantly differ among lake types.
Twelvemile Lake (official name, 66.44966°N, −145.54564°W, 115 m a.s.l.) is located approximately 12 miles (7 km) southeast of Fort Yukon on gently sloped Quaternary alluvium trending from the southeast to northwest (). The lake is the terminus of a chain of lakes connected by surface and subsurface flow that are oriented parallel to the modern Yukon River floodplain. During high stands, streamflow is observed into and out of the basin. During low stands, the inflow and outflow stream channels are dry, and nearby spruce-covered permafrost plateaus with 5–20 m of relief define the watershed (). Surface flows into the lake basin were observed and photographed by YFNWR pilots in April 2013 during an upstream ice jam flood event on the Yukon River. Distinct groundwater recharge localities were not observed, although permafrost surveys have identified that groundwater flow paths above and below permafrost are related to fluvial and lacustrine taliks, soils, and vegetation (Jepsen et al. Citation2013; Jorgenson et al. Citation2010; Minsley et al. Citation2012).
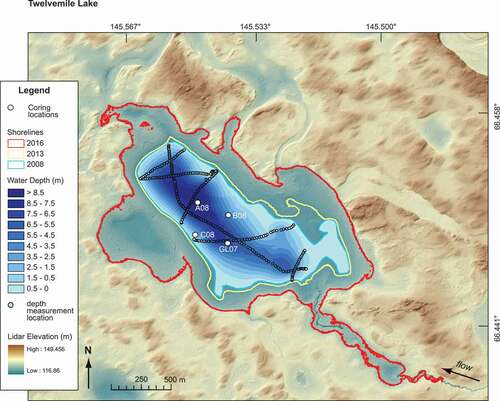
Figure 2. Twelvemile Lake is shown on a bare-earth digital terrain model derived from LIDAR (2 m) with locations for depth measurements (blue circle symbols) and modeled bathymetry (blue shading), core locations (white circle symbols), and shorelines from 2008 (light blue), 2013 (yellow), and 2016 (red)
Track Lake (unofficial name, 66.855°N, 145.170°W, 145 m a.s.l.) is located approximately 32 km north of Fort Yukon, between the Sheenjek and Christian rivers on gently sloped Quaternary alluvium trending from northeast to southwest (). During high stands, stream flow is observed out of the basin but not in. During low stands, nearby spruce-covered permafrost plateaus with 5–20 m of relief define the watershed (). Ice-jam floods of the Yukon River do not affect the Track Lake area. A prominent focal point of groundwater discharge is in the northeast basin. Groundwater paths are likely associated with fluvial taliks, soils, and vegetation similar to those documented at Twelvemile Lake.
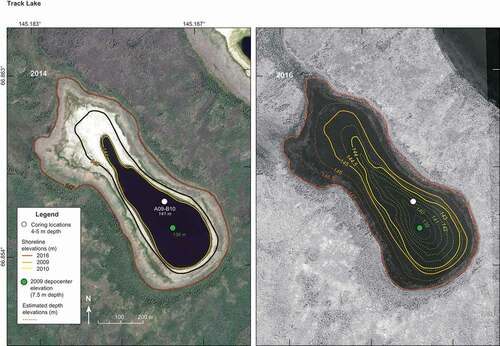
Figure 3. Track Lake is shown on imagery for April 2014 and July 2016 (Digital Globe WV02), with coring location (white circle symbols), estimated bathymetry (dashed colored lines), and shorelines (solid lines) from 2009 (orange), 2014 (yellow), and 2016 (red)
The climate of the Yukon Flats is characterized as cold continental with large seasonal temperature contrasts, low humidity, and low precipitation. Mean annual temperature is approximately −6°C with recorded maxima of approximately 35°C and minima of −57°C. Subfreezing temperatures can occur in any month. The broad low-lying valley is strongly affected by cold-air drainage and winter temperature inversions. Mean annual total precipitation is approximately 250 mm with approximately 80 mm as snow (U.S. National Centers for Environmental Information, www.ncdc.noaa.gov). In general, precipitation is light and irregular with summer rainfall accounting for approximately 68 percent of annual totals (; Shulski and Wendler Citation2007). Lakes are ice covered from seven to eight months of each year (September/October–April/May).
Figure 4. Fort Yukon SNOTEL monthly precipitation and rain/snow ratio (1997–2016) plotted against Yukon Flats (YF) relative humidity (NCEP/NCAR reanalysis percent anomaly from 1948 to 2013 mean for average of YF grid cells), Twelvemile and Track Lake surface areas (percent of maximum, diamond symbol), and sediment δ18OCaCO3 (‰ VDPB, small circle symbol), living Chara δ18O (‰ VDPB, large filled circle symbol), and lake water δ18OH2O (‰ VSMOW, open circle symbol) from approximately 1950 to 2016. MAP = mean annual precipitation
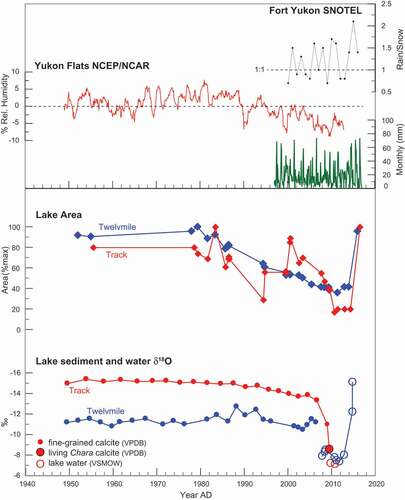
Anderson et al. (Citation2013) obtained meteorological data from 1948 to 2011 from the U.S. National Centers for Environmental Prediction and National Center for Atmospheric Research (NCEP-NCAR) for an average of grid cells that encompass the YFNWR. The relative humidity record indicates that it was relatively dry between 1948 and the early 1970s, wetter between the 1980s and 1995, and dry again between 1995 and 2011 (). For the period of record, wet periods with high relative humidity are associated with more snowfall and lower potential evaporation, whereas dry periods are associated with less snowfall and higher rates of potential evaporation (shown in Anderson et al. Citation2013).
Local precipitation measurements from 1997 to the present are available from the U.S. Department of Agriculture National Resource Conservation (USDA NRCS) snowpack telemetry network (SNOTEL) site at Fort Yukon. The twenty-year record shows anomalously high rainfall during July through September in 2014 (). August 2015 had high rainfall, and September had two large snowfall events. Although mean annual 2016 precipitation was average, June and July were drier than normal and August was wetter than normal.
Methods
Bathymetry was determined in 2008 at Twelvemile Lake from 255 GPS-located sonar-measured water depths and 142 shoreline locations (). The data were mapped on a 2 m grid cell bare earth digital terrain model derived from airborne light detection and ranging (lidar) data acquired between July 14 and September 3, 2009, by the U.S. Geological Survey and using a kriging method of interpolation with GIS. The bathymetry of Track Lake was estimated by assuming roughly evenly spaced contours between the GPS elevation measured of the lake’s surface in 2009 (145 m a.s.l.) and the location of the maximum measured depth (7.5 m, 138 m a.s.l) (). Additional elevations were then estimated for the highest and lowest observed shorelines (144 m in 2011 and 147 m in 1985). Lake volumes and surface areas were calculated for both lakes at 0.5 m depth increments using a kriging interpolation method within ArcGIS 3D Analyst and are shown in and .
Table 1. Twelvemile Lake hypsometry estimates
Table 2. Track Lake hypsometry estimates
In July 2007, surface and water-column measurements were collected with a calibrated Eureka Amphibian™ and Manta sonde. Lake-water chemistry is presented by Halm and Guldager (Citation2012). Near-surface water samples for isotope analyses were taken in 30 ml HDLP Nalgene bottles and sealed with no headspace. Water samples were prepared for isotope ratio analyses of oxygen and hydrogen by automated constant temperature equilibration with CO2 and automated H/D preparation by chromium reduction coupled to an isotope ratio mass spectrometer. Water oxygen and hydrogen isotope results are reported in per mil (‰) as the relative difference of isotope ratios (δ) from the international measurement standard Vienna Standard Mean Ocean Water (VSMOW) defined by δ18OH2O = ([18O/16O] H2O/[18O/16O]SMOW) − 1 and δ2HH2O = ([2H/1H] H2O/[2H/1H]SMOW) − 1. Analytical uncertainties are within ± 0.5‰ and ± 0.05‰ for hydrogen and oxygen, respectively. Analyses of random replicate samples fell within the range of analytical error.
Sediment cores with an undisturbed sediment water interface were obtained from an anchored floatplane at Twelvemile Lake (core GL07, 36 cm length, 7.5 m water depth) and Track Lake (core A09, 38 cm length, 5 m water depth) using Glew (Glew, Smol, and Last Citation2001) and Aquatics Research™ gravity coring devices in July 2007 and 2009, respectively. Following vertical storage during the return flight to Fairbanks, cores were extruded at 0.5 cm increments. Additional modified Livingstone cores were obtained at Twelvemile Lake in September 2008 from a securely anchored floating platform in water depths of 10 m (core A08), 8 m (core B08), and 2.8 m (core C08). Black organic rich sediments in core A08 were disturbed after recovery by degassing and were not further analyzed.
At Track Lake, additional modified Livingstone “Bolivia” cores were obtained in July 2010 near the 2009 coring location from an anchored floatplane in 4–5 m water depth (core B10). Cores were stabilized with Zorbitrol Plus™ and were capped before transportation. Windy conditions in 2010 obstructed precise measurements of water and drive depths so that although every effort was made to begin coring just below the sediment–water interface, the dating of the core, discussed in detail further on, indicates that the uppermost depth was in fact between 40 cm and 50 cm below the sediment–water interface. We estimate that this left a gap of approximately 8–10 cm unattained sediment between the base of gravity core A09 to the top of Livingstone core B10.
Following whole-core magnetic susceptibility measurements at 1 cm increments with a Bartington susceptibility meter, the Livingstone cores were split, photographed, and visually logged for biogenic features, sedimentary structures, composition, and Munsell color. Dry bulk density was obtained from contiguous 0.5 cm or 1.0 cm increments. Percent organic and inorganic carbon was determined from dry, pulverized subsamples using total carbon (TC) and total inorganic carbon (TIC) measurements by a UIC Inc.™ carbon dioxide coulometer (Engleman, Jackson, and Norton Citation1985). Percent organic carbon was calculated as the difference between TC and TIC. The accuracy and precision for both TC and TIC is 0.1 percent.
Subsamples for organic carbon (OC) and nitrogen percentage and isotope analyses were acidified with 1 N HCl, rinsed to neutral, freeze dried, and pulverized for combustion to CO2 and NO2 by a Carlo Erba™ CN elemental analyzer coupled with a Finnigan Delta™ Advantage isotope ratio mass spectrometer. Organic carbon isotope ratios are reported in per mil as the relative isotope-ratio difference from the international standard Vienna Pee Dee Belemnite (VPDB), defined by δ13COrg = ([13C/12C]Org/[13C/12C]PDB) − 1. Analytical uncertainties are ±0.2‰ and analyses of random replicate samples fell within the range of analytical error.
Subsamples for carbonate isotope analyses were obtained at 0.5 cm increments. Sediment carbonate particles include macroscopic Chara stem encrustations, ostracodes, gastropods, mollusks, and their shell fragments. Scanning electron microscopy and energy dispersive X-ray spectroscopy (SEM-EDS) indicated that the 32–63 µm sediment matrix contained mineral grains with endogenic carbonate growth structures. However, to remove as much of the larger biological carbonate shell fragments as possible, bulk sediments were wet sieved through nested screens (250, 125, 63, 32 µm), collected separately, and freeze dried. The finest fractions, either the less than 32 µm size or combined with the 32–64 µm sizes if the less than 32 µm sample was of insufficient mass, were visually examined for purity and powdered before subsampling for CO2 extraction by a Kiel automated device coupled with a Finnigan Delta 252 isotope ratio mass spectrometer. Calcite oxygen and carbon isotope ratios are reported in per mil as the relative isotope-ratio difference from VPDB defined by δ18OCaCO3 = ([18O/16O]CaCO3/[18O/16O]PDB) − 1 and δ13CCaCO3 = ([13C/12C]CaCO3/[13C/12C]PDB) − 1. Analytical uncertainties are ±0.05‰ and 0.1‰ for oxygen and carbon, respectively, and analyses of random replicate samples fell within the range of analytical error.
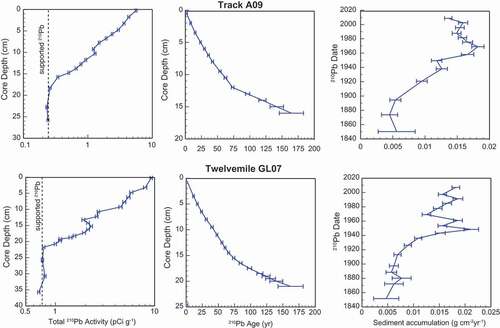
The sediment core chronologies are based on 210Pb analyses of bulk sediment and AMS radiocarbon measurements on identifiable terrestrial macrofossils, including charcoal. Terrestrial macrofossils were not present in sufficient quantities for radiocarbon measurements at most stratigraphic levels, and in some cases purified pollen samples were used. Both measured and calibrated radiocarbon ages (Calib 7.0.1; Stuiver and Reimer Citation1993) are reported, but only calibrated ages (cal yr BP) are used for discussion ( and ). 210Pb was measured on 0.5 cm sediment slices at 1.5 cm intervals to 26 cm and 36 cm depth for Track and Twelvemile lakes, respectively (). 210Pb activities are low yet typical for high-latitude regions, with maxima of 9.2 pCi/g at Twelvemile Lake and 5.26 pCi/g at Track Lake. Down-core decreases are relatively smooth, and the break between sediments containing unsupported 210Pb is well defined. A constant rate of supply model (CRS) was used to determine 210Pb ages (Appleby Citation2001).
Table 3. Twelvemile Lake chronostratigraphic data
Table 4. Track Lake chronostratigraphic data
Figure 5. Twelvemile core GL07 and Track core A09 210Pb total activity, CRS model ages, and sediment accumulation rates with error ranges
Age models were generated with 210Pb and radiocarbon measurements using the Bayesian software Bacon (v2.2; Blaauw and Christen Citation2011 and Citation2013), which uses the most recent calibration curve, IntCal 13 (Reimer et al. Citation2013). Default prior assumptions were used, with the exception of thickness values that were set to 1. Bacon generated two equally plausible age models for Twelvemile Lake below the 210Pb-dated depths that differ by approximately 400 years, which is an uncertainty greater than 50 percent of the length of the 600-year record. The cause is large 2-sigma calibrated age ranges (~ 200–300 years) for the seed and plant samples at 25 cm and 34 cm depth. Therefore, the Twelvemile Lake data are only shown by age for depths dated by 210Pb, and interpretations of older data take the significant age uncertainty into consideration. The range of age errors for GL07 210Pb-dated depths (0.5–20.5 cm, 2008 to approximately AD 1870) is 1–10 yr (, ).
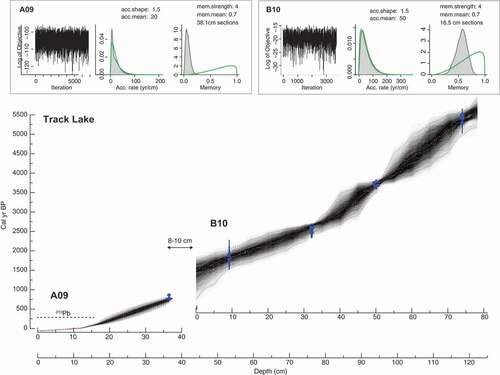
Individual age models for each Track Lake core, A09 and B10, avoid assumptions about the starting depth of core B10. Furthermore, core B10 data above the uppermost radiocarbon age at 9 cm depth of 1850 cal yr BP are not shown or interpreted. However, the age models indicate the strong likelihood of continuous sedimentation through the unattained sediments between the cores (). Extrapolation of estimated sedimentation rates between the A09 210Pb-horizon and the lowermost radiocarbon age suggest that B10 has an uppermost depth of 40–50 cm, or between approximately 8 cm and 10 cm below the 36.5 cm depth of A09. The range of 210Pb age uncertainties for A09-dated depths (0.5–16 cm, 2009 to approximately AD 1870) are 1–10 yr (, ). Below the 210Pb-horizon, radiocarbon age-model uncertainty increases from 130 to 200 years. The range of B10 radiocarbon age-model uncertainty is from 100 to 500 years.
Figure 6. Bayesian age-depth models constructed with the age-depth modeling software Bacon v2.2 (Blaauw and Christen Citation2011 and Citation2013) for Track cores A09 and B10 on individual depth scales. Transparent blue symbols show calibrated radiocarbon dates and age-depth models are gray scale, with darker grays indicating more likely calendar ages. Stippled lines show 95 percent confidence intervals and the red dashed curve shows the best model fit based on the weighted mean age for each depth. Upper panels depict the Markov Chain Monte Carlo (MCMC) iterations (right panel) and prior (green) and posterior (gray histograms) distributions for the accumulation rate (middle) and memory (right panel). Extrapolated sedimentation rates suggest that unattained sediment gap was approximately 8–10 cm thick and spans from approximately 1850 to 800 cal yr BP
Results
Limnology
In July 2007, Twelvemile Lake had a maximum water depth of 10 m, and water-column measurements indicated a thermocline depth of 5–6 m with a 10°C temperature decline, no change in pH, a slight decline in dissolved oxygen (DO), and slight increase in specific conductivity (Spc). The high pH and Spc are greater than average for the YFNWR (). Alkalinity was in excess of dissolved magnesium (Mg), which exceeded calcium (Ca) by a factor of approximately 2. Dissolved sodium (Na) was below average. Inorganic carbon (DIC) concentrations were relatively high, and carbon isotope ratios (δ13C-DIC) were relatively low. The ice-free lake was oversaturated in dissolved carbon dioxide (CO2) and methane (CH4). Exposed shorelines examined in 2008 around the northern edges of the basin were silty sands delineated by strands of willow and aspen saplings. Southern shorelines were exposed organic-rich lake muds, and in some locations had thin crusts of white evaporite deposits. Submerged and emergent aquatic vegetation is abundant throughout the lake, such as pond weed (Potamogetonaceae sp.) and water lilies (Nymphaeaceae sp.), but Chara sp. algae was not observed.
Table 5. Aqueous geochemistry of Track and Twelvemile lakes1
In July 2009, Track Lake had a maximum water depth of 7.5 m. Water-column measurements were not obtained, but temperature stratification is considered likely based on a similar maximum depth, pH, and Spc as Twelvemile Lake. Alkalinity was in excess of Mg, which was higher than Twelvemile and exceeded Ca by a factor of from 3 to 4. Dissolved sodium was also higher. DIC was similar to Twelvemile, although δ13C values were approximately 4.5‰ more 13C-enriched. CO2 was near equilibrium and CH4 was oversaturated. The exposed shorelines examined in 2009 were organic and carbonate-rich lake muds. No evaporite crusts were observed. Submerged mats of Chara algae are abundant in addition to various pond weeds (Potamogetonaceae) and sedge (Scirpus sp.).
Isotope hydrology
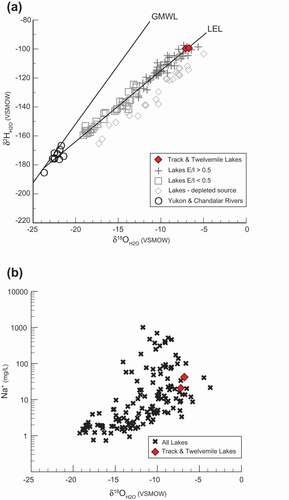
Lake-water oxygen and hydrogen isotope ratios of YF lakes from Anderson et al. (Citation2013) define a local evaporation line (LEL) with a slope of 4.89 (). The intersection between the LEL with the global meteoric water line (GMWL) provides an estimate for the δ18O of mean annual precipitation (δ18Op) between −23‰ and −24‰ that is similar to the δ18O values of the Yukon and Chandalar rivers and is also likely to reflect values for regional groundwater. A subset of YF lakes, which does not include Track and Twelvemile, plot below and parallel with the LEL. This group of lakes has a lower LEL-GMWL intersection value (less than −25‰) that reflects an isotopically depleted water source more dominated by snowmelt and/or permafrost thaw and active thermokarst.
Figure 7. Lake-water oxygen and hydrogen isotopes (a) from Twelvemile and Track Lakes (red diamond symbols) plotted with YF lake and river samples from Anderson et al. (Citation2013) and the Global Meteoric Water Line (GMWL). Lakes sourced by precipitation, rivers, and groundwater are shown as either open or closed hydrology based on E/I ratios. Open hydrology lakes have E/I < 0.5 (square symbols) and closed hydrology lakes have E/I > 0.5 (cross symbols). Lakes sourced by snow and permafrost thaw are shown as a third group (open diamond symbols). A regression for lakes sourced by precipitation, rivers, and groundwater form a local evaporation line (LEL) with a GMWL intercept δ18O value of from −23‰ to −24‰. (b) Lake-water δ18OH2O from Anderson et al. (Citation2013) are plotted against dissolved sodium (Na+) concentrations
Lake-water enrichment in 18O and 2H isotopes along the LEL trajectory originating at the GMWL-LEL intersection reflects water loss by evaporation. Track and Twelvemile isotopic compositions on the LEL indicate that both lakes are dominantly sourced by precipitation delivered to the lakes via surface flow and groundwater. Using the isotope mass balance methods discussed in detail by Gibson, Birks, and Yi (Citation2016), lake evaporation to inflow ratios (E/I) for Track and Twelvemile lakes during low stands are 1.29 and 1.12, respectively, indicating that the lakes had negative water budgets because of losses by evaporation (Anderson et al. Citation2013).
Thin crusts of white evaporite deposits surrounding lakes and within dry lake beds are observed throughout the YF, including the areas near Twelvemile and Track Lakes (; Clautice and Mowatt Citation1981). The efflorescent salt films are less than 1 cm deep and are dominantly composed of calcite and dolomite, with some occurrences of trona (sodium bicarbonate). Brackish Mg-Na-HCO3-Cl ponds in the YF form because evaporation exceeds inflow; notably, trona only occurs under extreme desiccation (Hawkins Citation1995; Heglund and Jones Citation2003). We note here a correspondence between elevated dissolved sodium with higher oxygen and hydrogen isotope compositions ().
Recent lake-level fluctuations
Using Landsat imagery, Rover, Wylie, and Tieszen (Citation2012) assessed YF lake-level trends between 1978 and 2012, including Twelvemile and Track Lakes, which we have supplemented here with additional aerial photography and Digital Globe WV02 imagery (, , and ; www.earthexplorer.usgs.gov). In 1953 and 1978, Twelvemile Lake’s levels were near overflow elevations. From 1985 to 2012, lake levels steadily declined by approximately 3 m, and the lake became hydrologically closed and occupied less than 25percent of its basin. Overbank flooding of the Yukon River caused by an ice jam in April 2013 renewed surface inflow, and by June 2013 lake levels had risen by approximately 1 m. The lake remained at this stage through April 2014. Between April 2014 and May 2016, lake levels steadily rose 2 m and reached overflow elevations.
Recent Track Lake trends were mostly similar to Twelvemile but with important differences. They were also near maximum between the 1950s and the early 1990s, but Track Lake’s levels subsequently fluctuated as Twelvemile’s steadily declined. Not until 2003 did Track steadily decline by approximately 3 m to occupy less than 25 percent of the basin by 2009. Both lakes remained near minima between 2009 and 2013, but Track’s levels did not rise in 2013. Between 2014 and 2016 both lakes rose, with Track’s levels rising by approximately 3 m to reach overflow elevations and representing a lake volume increase of approximately 75 percent.
As previously discussed by Anderson et al. (Citation2013), lake-level declines observed throughout the YF during the early twenty-first century broadly correspond with climate trends. Higher temperatures, reduced precipitation, lower snow-water equivalent, and greater potential evaporation appear to have influenced lakes vulnerable to evaporative water loss, such as Twelvemile and Track. The rises at Track Lake when Twelvemile was in decline during the early 2000s are unexplained but illustrate the spatial heterogeneity that characterizes the YF region during drought. In contrast, during wet periods, lakes throughout the YF respond synchronously. Since 2014, high lake levels at both sites and the region as a whole correspond with increased summer and fall precipitation amounts.
Lake sediments
Calcite as a major phase of YF lake sediments was proposed by Hawkins (Citation1995) because calcite precipitation drives water to reach the Mg-Na-CO3 compositions required for trona formation. The Yukon Flat’s rivers are dominated by Ca and bicarbonate (HCO3), and combined with bicarbonate formation in groundwater this leads to large alkalinity excess over calcite observed in YF’s lakes (Heglund and Jones Citation2003). In Track and Twelvemile, alkalinity is observed in excess over Ca and Mg, which suggests the possible occurrence of multiple authigenic carbonate phases, including calcite and aragonite. The small positive oxygen isotope fractionation between the polymorphs (+0.6‰) is relatively insignificant compared with the isotope variations and trends in the sediment records that are well over 2‰ (Shapley, Ito, and Donovan Citation2009 and references therein). Although dolomite was detected in evaporite crusts by Clautice and Mowatt (Citation1981), it was not observed in lake sediments by Hawkins (Citation1995) nor was it observed in Track and Twelvemile lakes.
Twelvemile Lake
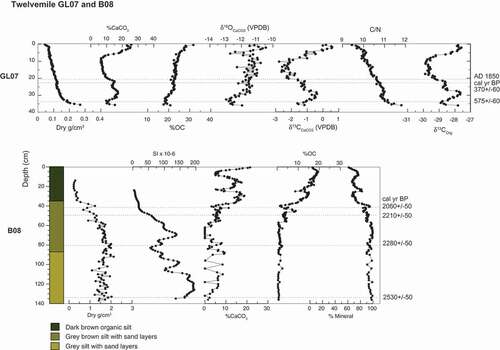
Twelvemile basal sediments in core B08 have high magnetic susceptibility and bulk density, low percentages of OC and carbonate, and high rates of sedimentation with a maximum age of approximately 2700 cal yr BP (). Sediments transition upcore to near equal parts OC (30–40%) and mineral matter (40–50%) with lower amounts of carbonate (5–25%). Basal sandy silts with similar ages were obtained from core C08 (). Magnetic susceptibility trends upcore to lower values as percentages of OC and carbonate trend to higher values. Nearshore core C08 has a similar but compressed sedimentary sequence as B10, with lower percentages of mineral material and higher percentages of OC and evidence for littoral sediment reworking (not shown). Oxygen isotope measurements from core B10 sediments produced prohibitively low CO2 yields. Successful measurements were obtained from core GL07 to provide the 35 cm long Twelvemile δ18OCaCO3 record that extends to approximately 600 cal yr BP, or approximately AD 1400 ().
Figure 8. Core physical properties and geochemical properties including dry bulk density, magnetic susceptibility, weight percentages of calcium carbonate and organic carbon and mineral sediment, δ18OCaCO3 and δ13CCaCO3, C/N ratio, and organic carbon δ13COrg of bulk sediment are plotted with the 210Pb-horizon at AD 1850 and median calibrated radiocarbon ages from Twelvemile Lake
Isotopic equilibrium in Twelvemile Lake between the core-top carbonate and lake water was assessed using the calcite-water equilibrium equations of Epstein et al. (Citation1953), Friedman and O’Niel (Citation1977), and Tarutani, Clayton, and Mayeda (Citation1969). Core-top δ18OCaCO3 values of −11.2‰ and −12.5‰ are greater than 2‰ lower than the predicted equilibrium calcite values of −8.70‰ for the contemporaneously measured lake-water temperatures of 16.9°C. It is possible that endogenic carbonate production occurs in warmer littoral lake-water temperatures, which, if applied to the equations, slightly reduces the offset. It seems more likely that the offset is related to the fact that core-top δ18OCaCO3 values integrate 2–7 years, which represent a wider range of lake-water temperatures and δ18OH2O values. Equations by Leng et al. (Citation2005) that use calcite-water isotope equilibria to predict a range of growing-season lake-water temperatures predict values between 15°C and 17°C, which are consistent with the measured lake-water temperature reported by Halm and Guldager (Citation2012).
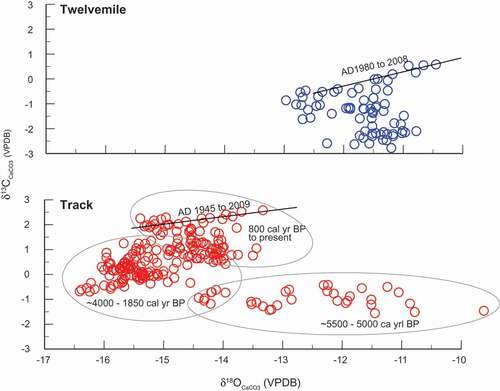
Twelvemile δ18OCaCO3 values range from −10.5‰ to −13‰, and generally increase and show greater variability upcore. The δ13CCaCO3 values range from −2.8‰ to 0.6‰, and generally decline before 600 cal yr BP until they rise within the uppermost 10 cm. The δ13COrg values range from −27.5‰ to −30‰ and trend similarly upcore as δ13CCaCO3. Higher δ13COrg and δ15NOrg (not shown) may reflect some degree of active degradation of OC (Gälman et al. Citation2008). Relatively low C/N between 9.4 and 11.8 suggests dominantly aquatic sources. The δ18OCaCO3 and δ13CCaCO3 do not systematically covary prior to 1980 (). After 1980, percentages of carbonate increased to 25 percent and percentages of OC declined to 40 percent as positive covariance between δ18OCaCO3 and δ13CCaCO3 strengthened (m = 0.87, R2 = 0.73).
Figure 9. Twelvemile and Track δ18OCaCO3 and δ13CCaCO3 shown with linear regressions for the late twentieth and early twenty-first centuries
Comparison between historic Twelvemile Lake levels, sediment δ18OCaCO3, and lake-water δ18OH2O measurements indicate some consistent trends (). Between 1978 and 2007, lake levels lowered and δ18OCaCO3 values increased. High lake levels prior to 1978 are reflected by generally lower δ18OCaCO3 values, although they are not the lowest values nor do they remain consistently low. Between 2007 and 2012, when lake levels were low, δ18OH2O values remained high. After 2013, as lake levels rose, δ18OH2O values declined by approximately 7.5‰.
Track Lake
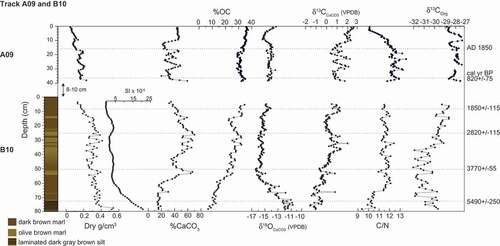
Track Lake basal sediments are laminated dark gray brown silts of high magnetic susceptibility and density and low percentages of OC and carbonate (). Sediments transition upcore to olive brown marl that is high in OC and carbonate (>70%), with lesser amounts of biogenic silica (10–20%) and mineral matter (<5%). Higher percentages of OC and carbonate occur as bulk density and magnetic susceptibility decline. Changes in the relative proportions between OC and carbonate are visually evident as centimeter-scale color banding. Darker shades of brown reflect higher OC, and lighter shades of olive reflect higher carbonate abundance. Aquatic macrofossils are abundant throughout the core, whereas terrestrial macrofossils were rarely found.
Figure 10. Core lithology, physical properties, and geochemical properties including dry bulk density, magnetic susceptibility, weight percentages of calcium carbonate and organic carbon, δ18OCaCO3 and δ13CCaCO3, C/N ratio, and organic carbon δ13COrg of bulk sediment are plotted with the 210Pb-horizon at AD 1850 and median calibrated radiocarbon ages from Track Lake
Living Chara is abundant in Track Lake, and isotopic equilibrium between living Chara calcite encrustation values δ18O (δ18OChara) and lake water at measured lake-water temperatures was assessed using the same equations that were described earlier and used for Twelvemile Lake. An estimated δ18OChara value of −7.92‰ at the lake’s measured water temperature of 19.47°C is similar to the measured δ18OChara value of −8.55‰. Track δ18OCaCO3 values for core-top fine-grained sediment were lower than living Chara, between −11‰ and −13‰, but reflect a time-integrated signal and fall within the range of calcite-water isotopic equilibrium values predicted by the equations of Leng et al. (Citation2005). Successful δ18OCaCO3 measurements for cores A09/B10 provide the approximately 120 cm long record that extends to approximately 5500 cal yr BP.
Track δ18OCaCO3 values vary between −10.5‰ and −15.5‰ and are shown with age-model uncertainty in as a proxy.ghost graph in Bacon. Following a decline of approximately 5‰ within basal sediments between approximately 5500 and 4000 cal yr BP, values gradually rose by approximately 2‰ between approximately 3500 and 1850 cal yr BP. Because of the gap in recovered sediment between the two cores, no data are available for the period between approximately 1850 and 800 cal yr BP. Values between approximately 800 cal yr BP and present were relatively high, between −13.5‰ and −15.5‰, with the lowest values of the period having occurred during the twentieth century. Comparison between lake-level fluctuations and the sediment δ18OCaCO3 record indicate consistent patterns (). From 1978 to the mid-1990s, δ18OCaCO3 values were relatively low when lake levels were high. After approximately 1998, δ18OCaCO3 values increased as lake levels declined.
Figure 11. Track δ18OCaCO3 data plotted as a grayscale with Bacon v2.2 to display chronological uncertainties: the darker the gray, the greater the age certainty
Track δ13CCaCO3 values range between 2‰ and −1.5‰. Values for δ13COrg range between −32‰ and −27‰, and with C/N, increase upcore until 10 cm depth. The recent decrease in C/N in the upper 10 cm may reflect active OC degradation and possibly the Seuss effect, and may explain the recent decline in δ13COrg. Covariance between δ18OCaCO3 and δ13CCaCO3 evolves upcore () from insignificance in basal sediments to a slightly negative relation between approximately 4000 and 1850 cal yr BP, and followed by strong positive covariance from AD 1945 to the core top (R2 = 0.6 and m = 0.3).
Modeling climate-driven changes in lake water isotopes
Modeling lake-water isotopes provides helpful constraints on sediment oxygen isotope records even when knowledge of the hydrologic system is incomplete and true model calibration is not possible (Anderson, Finney, and Shapley Citation2011; Shapley, Ito, and Donovan Citation2008; Steinman and Abbott Citation2013). In this case we developed a model of Track Lake δ18OH2O and conducted highly idealized experiments designed to explore plausible hydrologic controls that may explain prominent sediment δ18OCaCO3 variations. Model runs were designed to test two specific questions: Within the limits of twentieth-century climate variability, is it possible to simulate (1) a decadal scale −3‰ excursion in δ18OH2O and (2) the entire range of Track Lake δ18OH2O values of 6‰?
The model is adapted from that of Benson and Paillet (Citation2002) and is coded in Visual Basic in Microsoft ExcelTM, incorporating hypsometry, groundwater exchange, evaporation and precipitation fluxes, seasonal stratification, and precipitation seasonality, and is described in detail by Shapley, Ito, and Donovan (Citation2008). Refinements for this study included seasonal snowpack and melt to simulate the effect of precipitation storage and seasonally pulsed runoff. Input climatic data are from the National Weather Service COOP station and SNOTEL at Fort Yukon. The nearest available monthly oxygen isotope compositions of precipitation (δ18Op) are from Fairbanks, collected between 2007 and 2011 by B. Finney. Low δ18Op values range from −25‰ to −30‰ in December and high values range from −11‰ to 18‰ from May to July. Monthly potential evaporation input is based on Thornthwaite estimates derived from NCEP/NCAR reanalysis climate parameters from Anderson, Finney, and Shapley (Citation2011). Model performance was evaluated by comparison with modern lake volumes and measured δ18OH2O values following adjustments of the most weakly constrained fluxes, such as monthly groundwater and evaporation rates (). Modeled steady-state δ18OH2O are within less than 1 percent of observed, and modeled volumes are within the range observed.
Figure 12. Time series of modeled monthly water fluxes (a) for Track Lake at steady state and (b) lake volume and isotope response to a step-change in climate from dry to wet conditions by +25 percent precipitation and −25 percent evaporation
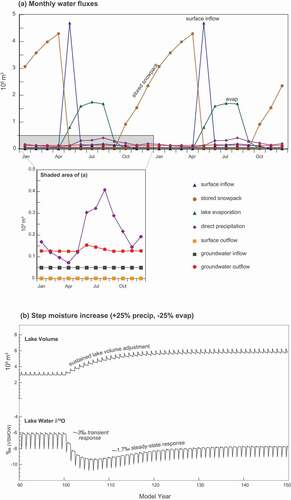
To address question 1, step changes in a variety of water-balance parameters within the range of multiannual variability observed during the twentieth century were imposed, and time series of modeled lake volume and δ18OH2O was evaluated. Results show that a 25 percent increase in precipitation and a 25 percent decrease in evaporation produce a sustained increase in lake volume over two decades (). The δ18OH2O response was twofold. First there was an approximately 3‰ decline within five years of the step shift in climate that was then followed by partial recovery over approximately thirty years to represent an overall 1.7‰ decline. This simulation suggests that the negative δ18OCaCO3 excursion reflected by the sediment record during the early twentieth century could plausibly reflect a similar transient isotope response.
To address question 2, six model runs were carried out with combinations of twentieth-century climate extremes in precipitation amount and seasonal balances (). Simulated lake volumes ranged from approximately 1.4 to 6.1 × 10⁵ m3 and δ18OH2O variations ranged from −3.7‰ to 10.7‰, which are similar to observed lake-volume variations of approximately 2.6 to 6.7 × 10⁵ m3 and sediment δ18OCalcite values of −7‰ to −14.5‰. The results indicate that the entire 6‰ range in δ18OH2O values recorded by the sediment data plausibly reflect steady-state responses to forcing by twentieth-century hydroclimate extremes.
Table 6. Model simulation experiments and lake volume and δ18O sensitivity
Discussion
The sediment cores from Track and Twelvemile lakes indicate that sedimentation following initial lake formation is low in lithic input and is dominated by endogenic carbonate and aquatic OC, which in turn reflects high levels of aquatic productivity and excess alkalinity. Bioinduced carbonate precipitation occurs within the water column as endogenic crystals and Chara encrustations. The data indicate that carbonate sediments are in isotopic equilibrium with lake water, which is consistent with a predominantly endogenic origin and insignificant contribution by detrital carbonate sources. Continuous sedimentation is indicated by the age models, which along with undisturbed sediment structures of aquatic origin, rules out the possibility of significant sediment reworking caused by active thermokarst. The simple lake bathymetries reflect stable taliks, which foster the groundwater–surface water connectivity indicated by the lake-water isotope compositions. The lakes evolve volumetrically and isotopically in response to evaporation and hydroclimate, which is unambiguously supported by ubiquitous lake-level lowering and rise in response to variations in aridity and precipitation. Although some changes in shallow-depth permafrost may have occurred at Twelvemile and Track lakes, the sediment core data indicate that this exerts a relatively minor influence on the hydrology compared to the rapid and readily detectable hydrologic response to changes in hydroclimate.
Oxygen isotope interpretation
The Track Lake isotope model illustrates that δ18OH2O of lake water is influenced by watershed hydrology and hydroclimatic conditions, and is controlled by both (1) the combined δ18O of input waters from catchment runoff, precipitation falling directly on the lake, and groundwater inflow and (2) 18O enrichment caused by preferential evaporation of the 16O isotopes in lighter water molecules. Open lake systems with large catchment areas have low E/I, and the values and variations of δ18OH2O reflect precipitation, δ18Op. For closed-lake systems with small catchment areas and higher E/I, the values of δ18OH2O are dominantly influenced by the isotopic effects caused by evaporation, which reflects effective moisture. Furthermore, for the closed systems presented here, the lake-water isotopic modification of approximately 10‰ in response to evaporation () far exceeds the ±0.5–1.5‰ variations that could potentially be attributed to changes in the relative proportions of calcite-aragonite mineralogy and/or lake-water temperatures.
When conditions are arid, high rates of evaporation lead to closed surface-water hydrology at Twelvemile and Track Lakes. High E/I and 18O-enriched lake water lead to high δ18OCaCO3 values. Variations in δ18OCaCO3 during arid periods when the lakes are closed to surface outflow are sensitive to changes in evaporation and effective moisture. When conditions are wet, or in the case of Twelvemile, the lake is affected by Yukon River floods, and the lakes are open to surface inflow they have lower E/I and more 18O-depleted lake water, which results in low δ18OCaCO3 values. If the lakes reach overflow elevations and become open to surface inflow and outflow, the lakes become less sensitive to evaporation and δ18OH2O values are more sensitive to changes in δ18Op. Recent observations and isotope modeling suggest that Track and Twelvemile lakes are most often closed to surface outflow. The isotope model indicates that transition from a closed to open hydrology at both lakes is reflected by relatively large and rapid negative δ18OH2O shifts of greater than 4–5‰.
Twelvemile Lake
Basal sediment ages indicate sand and silt deposition in the Twelvemile basin by fluvial processes at approximately 2500 cal yr BP, a result that is consistent with the northward lateral migration of the Yukon River across the Twelvemile basin to its present position, as suggested by three-dimensional geophysical models of permafrost (Minsley et al. Citation2012). Estimated downward freezing rates following northward migration suggest that the Twelvemile basin was isolated from the river by 900–1,800 years ago, which is broadly consistent with the onset of organic-rich lake sedimentation documented here by approximately 1500 cal yr BP.
Between approximately AD 1500 and 1700, the oxygen isotope record indicates a lake where δ18OCaCO3 values varied independently of δ13CCaCO3. Weak covariance between lake-water oxygen reflected by δ18OCaCO3 and dissolved inorganic carbon isotopes reflected by δ13CCaCO3 is typical when lake volumes remain stable (Li and Ku Citation1997). This is consistent with more frequent phases or events when Twelevemile hydrology is open to surface inflow in response to wetter climate and more frequent incursions of Yukon River floodwaters (). The transition to higher δ18OCaCO3 values by approximately AD 1800 would therefore reflect more frequent closure to surface inflow and outflow and indicate that conditions were drier. Since approximately AD 1800, higher and more variable δ18OCaCO3 values reflect either a generally more arid climate with periodic wet periods or less frequent river incursions (). High-frequency declines in δ18OCaCO3 values during the 1950s and 1980s reflects observed wet periods. Therefore, we infer that high δ18OCaCO3 values during the late 1800s and early 1900s reflect more arid conditions than during the observational period from the mid-twentieth century to the present.
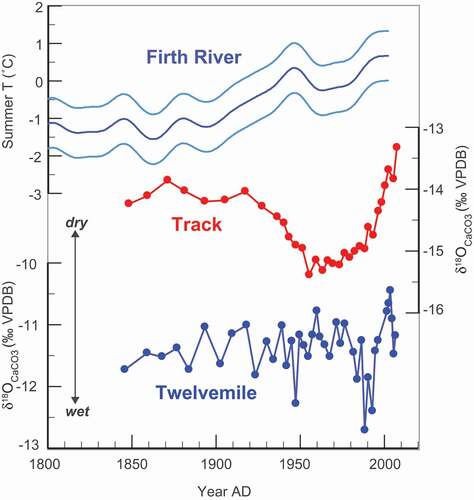
Figure 13. Comparison between Track and Twevelmile δ18OCaCO3 from AD 1850 to the present, with the summer temperature anomaly reconstruction at Firth River, northeast Alaska, from Picea glauca maximum latewood density, with uncertainty (Anchukaitis, D’Arrigo, and Andreu-Hayles Citation2013)
Track Lake
High δ18OCaCO3 values that steadily declined between approximately 5500 and 4000 cal yr BP may reflect a period of significantly greater aridity relative to the present that trended toward wetter conditions (). Basal sediments have high mineral silt, low OC, and relatively low OC δ13C values (δ13Corg) between −32‰ and −30‰ (Bade and Carpenter Citation2004). Our core may not have penetrated the full record, and the basal sediments, which are not structurally characteristic of thermokarst, may reflect a shallow lake with higher silt input from exposed shoreline erosion and eolian processes that are consistent with an arid climate. Low dissolved carbon δ13C values as reflected by organic carbon δ13C values (δ13Corg) can reflect respiration in groundwater sources and high rates of sediment organic matter decomposition (Finney et al. Citation2012). However, we note that declines in δ18OCaCO3, if interpreted to reflect rising lake levels and an increase in moisture, appear to be in conflict with oxygen isotope records from non-thermokarst lakes in the Brooks Range, which indicates a region-wide dry period between 5 ka and 4 ka (Clegg and Hu Citation2010; Mann, Heiser, and Finney Citation2002).
Alternatively, the carbonate isotope evidence raises the possibility that basal Track sediments may reflect thermokarst processes in addition to hydroclimate. The relatively low carbonate δ13C values (δ13CCaCO3) that were decoupled from high δ18OCaCO3 values () suggest that a smaller and shallower lake developed with 13C-depleted dissolved carbon sources, which could have also been a product of methanogenic microorganisms (Bastiviken et al. Citation2003). In thermokarst settings, relatively low dissolved carbon δ13C values are associated with CO2 contributions by higher rates of respiration and methanogenesis from degradation of permafrost carbon (Heslop et al. Citation2015; Sepulvida-Jauregui et al. Citation2015; Walter Anthony et al. Citation2014; Wooller et al. Citation2012). The highly elevated δ18OCaCO3 values are most consistent with an early lake that was a small, highly evaporated water body, and if thermokarst was active the δ18OCaCO3 declines between approximately 5.5 ka and 4 ka could reflect an increasing supply of 18O-depleted water that was potentially sourced from thawed permafrost during talik expansion (). Unraveling the respective contributions by thermokarst and hydroclimate during the initiation of the Track Lake basin with more certainty will require additional investigation.
The development of endogenic marl sedimentation in Track Lake by approximately 4000 cal yr BP supports hydroclimate as the subsequent primary control on lake-water balance, which is further supported by the isotope model simulations ( and ). Low δ18OCaCO3 values between approximately 4000 and 1850 cal yr BP indicate wetter conditions as relatively high lake levels and more frequently open hydrology. The subsequent δ18OCaCO3 trend to gradually higher values suggests a multicentury trend to lower lake levels, which are inferred to reflect more frequent or more sustained arid periods. Persistently high δ18OCaCO3 values since 800 cal yr BP indicate frequently closed hydrology in response to lower lake levels and even greater aridity. The prominently low δ18OCaCO3 values during the 1950s through the 1980s reflect the observed multidecadal wet period, which the isotope modeling suggests may be an ongoing transient isotope response. The wet early twentieth century and wet conditions from 2014 to the present appear wetter than during the previous approximately 800 years. Below the gap in our record, similarly low δ18OCaCO3 values were not previously recorded until approximately 2000 cal yr BP.
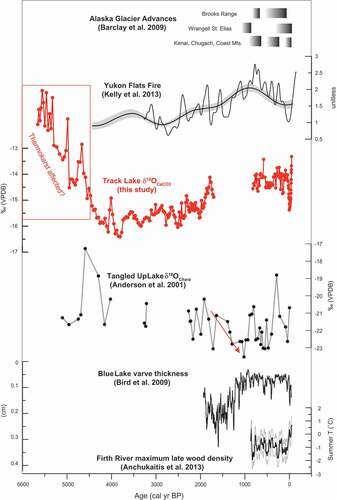
Figure 14. Comparison between the Track δ18OCaCO3 with records of YF fire (Kelly et al. Citation2013), Alaska glacier activity (Barclay, Wiles, and Calkin Citation2009), Tangled Up Lake δ18OChara (Anderson, Abbott, and Finney Citation2001), Blue Lake varve thickness (Bird et al. Citation2009), and Firth River maximum late wood density summer temperature reconstruction (Anchukaitis, D’Arrigo, and Andreu-Hayles Citation2013). The normalized YF charcoal accumulation rate (CHAR) compilation shows trends on millennial (gray) and century (black) time scales. The red box around the Track Lake time series indicates the section of the sediment record that may have been influenced by thermokarst processes. The downward red arrow on the Tangled Up record indicates potential trends in regional δ18Op discussed in the text
The role of precipitation oxygen isotopes
Although evaporative evolution is the major influence on Track Lake δ18OH2O, the isotope model illustrates that isotopes in precipitation (δ18Op), as stored snow and surface runoff, are also important (). Variations in δ18Op values in southern Alaska during the Holocene are known to be strongly influenced by changes in vapor source region and atmospheric circulation over the North Pacific in addition to the effects of temperature on condensation, topography, and continentality (Anderson et al. Citation2016). In contrast, variations in δ18Op values in northern Alaska during the Holocene are currently unknown. Limited modern observations in Barrow, North Slope in situ vapor monitoring and surface water surveys, and measurements of glacier ice at McCall Glacier in the Brooks Range indicate the influence of Arctic Ocean vapor sources, which are in turn influenced by sea ice (Klein et al. Citation2015, Citation2016; Lachniet et al. Citation2016). Values of mean annual δ18Op currently appear to range from approximately −20‰ to −23‰, with lower values reflective of colder temperatures at the vapor source area and at the time of condensation, longer transport, and more winter precipitation. Higher values reflect warmer temperatures at the vapor source area and at the time of condensation, shorter transport, and more summer precipitation.
Similar lake-water δ18OH20 values were observed at Tangled Up Lake, located in the central Brooks Range, by Anderson, Abbott, and Finney (Citation2001; ). Tangled Up is hydrologically open to surface inflow and outflow, and it was recognized that changes in the values of lake-water δ18OH2O reflect changes in the values of δ18Op. Although Anderson, Abbott, and Finney (Citation2001) had suggested the temperature of condensation as a dominant control on δ18Op values, we now recognize that vapor source and seasonality are likely as important as temperature and that the data are better understood and utilized as a proxy for δ18Op.
The Tangled Up δ18Op record is relatively coarse, with large age uncertainties (~250 yr), but data are continuous between 2000 cal yr BP and AD 1997 (). Between 2000 and 1000 cal yr BP, values of δ18Op varied considerably but declined overall from −20‰ to −23‰. Values subsequently fluctuated on the order of 3‰ from 1000 cal yr BP to the present. The implication for this study is that if a 3‰ decline in δ18Op values between 2000 and 1000 cal yr BP also occurred in the Yukon Flats, then the trend of increasing δ18OCaCO3 beginning in the upper portion of core B10, which appears to continue across the gap in the sediment record into the lower portion of core A09, reflects the effects of evaporative enrichment and the decline in δ18Op and thus a relatively large Δδ18O decline. It is noteworthy that similar trends in Δδ18O during the late Holocene have also been observed for the interior Yukon Territory (Anderson et al. Citation2007). A better understanding of changes in precipitation isotope values across northern Alaska to further investigate this preliminary assessment will require the development of additional δ18Op proxy records.
Late Holocene hydroclimate
The YF lake-level reconstructions based on Track Lake and Twelvemile Lake oxygen isotope data show hydroclimatic variations at time scales that range from millennia to decades for the past approximately 4,000 years. Furthermore, the lake levels reflect a balance between precipitation and evaporation, which in the YF region are both summer dominated. The millennial-scale hydroclimate trend at Track Lake is notably consistent with relatively low YF charcoal accumulation rates (CHAR) between approximately 4000 and 2000 cal yr BP and fire frequency (not shown), which gradually rise to a peak by 800 cal yr BP, based on a composite of fourteen lakes across southern marginal uplands (Kelly et al. Citation2013). Although millennial-scale increase in fire has been previously associated with the expansion of P. mariana (Higuera et al. Citation2009) and temperature trends (Clegg et al. Citation2011), Track Lake’s level reconstruction suggests a prominent role for effective moisture.
Higher effective moisture indicated by Track Lake between approximately 4 ka and 1.5 ka is broadly consistent with proxy records throughout the region () that indicate wetter conditions for sustained intervals during the same period, although with some subregional differences. Similarities include thicker varves at Blue Lake in the central Brooks Range interpreted to reflect a wetter regime from the end of the record at approximately 2 ka to 1.2 ka (Bird et al. Citation2009; ). Relatively low δ18OCaCO3 values between approximately 4 ka and 2.5 ka at Takahula Lake in the south-central Brooks range are interpreted to reflect higher effective moisture (Clegg and Hu Citation2010). Farther west, relatively wet conditions between approximately 3.5 ka and 1.5 ka are indicated by reduced sand influx at Wolverine Lake in the Kobuk Sand Dunes (Mann, Heiser, and Finney Citation2002). Keche Lake, in the eastern Brooks Range, indicates more frequent periods of detrital carbonate between approximately 3.5 ka and 1.5 ka, which can be attributed to more surface runoff within the watershed due to wetter conditions (Chipman, Clegg, and Hu Citation2012). Marcella Lake, in the southwest Yukon, has relatively low δ18OCaCO3 values between approximately 3 ka and 1.5 ka, which indicate higher effective moisture (Anderson et al. Citation2007).
The increase in YF CHAR between approximately 2000 and 800 cal yr BP suggests that greater biomass burning was coincident with higher aridity indicated by lower Track Lake levels. Although Track Lake data are not available for the period between approximately 1850 and 800 cal yr BP, a regional transition to drier conditions between approximately 1000 and 800 cal yr BP is reflected by a reduction in Blue Lake varve thickness across the period () and increased δ18OCaCO3 values at Sevenmile and Marcella lakes (Anderson, Finney, and Shapley Citation2011). Anderson, Finney, and Shapley (Citation2011) discussed aridity and “early Little Ice Age” glacial advances across Alaska’s major mountain ranges between approximately AD 1050 and 1300 (; Barclay, Wiles, and Calkin Citation2009; Wiles et al. Citation2008). Track Lake levels were near modern with only minor variation between AD 1200 (800 cal yr BP) and 1850 and during the inception of the second major phase of Alaskan glacier advances, known as the “late Little Ice Age,” by approximately AD 1600.
Hydroclimatic trends during recent centuries indicate a cool-dry period between AD 1850 and 1900, as reflected by low Track Lake levels and relatively cool summer temperatures indicated by the maximum late wood density reconstruction from Firth River, located in the eastern Brooks Range (; Anchukaitis, D’Arrigo, and Andreu-Hayles Citation2013). The first half of the twentieth century was increasingly warmer and wetter as reflected by a rise in lake levels at Track and Twelvemile and higher summer temperatures. The long-term lake-level data indicate that the observational period since the mid-twentieth century was generally wetter than earlier decades and the previous 800 years. However, the past 800 years were generally drier than the preceding 3,000 years, with the qualification that we cannot assess the period between approximately 1850 and 800 cal yr BP. The most recent time prior to the 20th century when conditions were as wet as the late twentieth century may have been approximately 2000 cal yr BP.
Conclusions
Paleoclimate histories that include surface hydrologic response provide a means to better understand ecosystem change and better inform land management. The new Track and Twelvemile sediment records suggest that the magnitude and frequency of lake-level fluctuations observed during the late twentieth and early twenty-first centuries are a persistent feature of the YF region. With these records, we can now place recent YF lake-level changes of the past few decades within a number of longer term contexts, which indicate that these lakes have previously experienced similar and more extreme hydroclimatic states during the late Holocene. Furthermore, the isotope model suggests that lake-level extremes, based on the entire isotopic range of sediment data, are plausibly driven by the range of twentieth-century hydroclimatic variations and extremes. Thus, the long-term perspectives developed here serve to highlight the resilient capacities of aquatic ecosystems in response to fluctuating lake levels (e.g., Lewis et al. Citation2014; Roach et al. Citation2011) and reinforce the notion proposed by Kelly et al. (Citation2013) that the persistence of highly variable drought-induced fire regimes into the future is likely.
Future lake-level fluctuations will also continue to depend on permafrost stability, which reflects complex interactions among hydroclimate, topography, hydrology, soil, and vegetation (Jorgenson et al. Citation2010). However, while there is no evidence from this study to refute the proposition that future sustained lake-level declines are more likely to occur in response to permafrost loss, which boreal forest burning could promote (Jorgenson and Osterkamp Citation2005), consideration of a broad range of temporal perspectives is instructive. In this case, the longer perspectives on YF boreal forest, fire, and hydroclimate indicate that permafrost has remained relatively stable despite many centuries of high-severity fire and drought.
It is interesting to note the observation that shorter twentieth-century perspectives of YF fire frequency do not indicate clear relationships with climate (Drury and Grissom Citation2008), whereas millennial-scale reconstructions have a strong correspondence with the paleoclimatic data presented here. This conundrum is a consequence of persistent high-amplitude variations on multiannual to decadal time scales that will invariably plague the detection of long-term change based on short-term perspectives. As this study has shown, YF lake-level changes also show high-magnitude change and complex spatial responses on a range of timescales that should be assessed within a late twentieth- and early twenty-first-century context with caution. This study has shown that by framing recent lake-level fluctuations within a longer term context of multiple centuries to millennia, we can more confidently identify the occurrence of sustained trends, which will be essential to understand in terms of future impacts on wetland ecosystems, permafrost, and carbon.
Acknowledgments
This research is supported by the U.S. Geological Survey Land Change Science Research and Development program. Nikki Guldager and the Yukon Flats National Wildlife Refuge provided air transportation and field logistics. We thank David Dettman and Chris Eastoe at the University of Arizona, who provided carbonate isotope measurements, and Dan Engstrom of the Science Museum of Minnesota, who provided radiometric dating and age models. We thank Chad Wolack of the University of Colorado Institute for Arctic and Alpine Research, who provided macrofossil graphitization and AMS 14C ages, and Carl Jurkowski for his assistance. Paco VanSistine provided imagery and ARC-GIS; Colin Penn provided coulometry measurements. Jeremy Havens provided assistance with figures. We are grateful to Miriam Jones, Mary Edwards, and an anonymous reviewer for constructive criticisms and suggestions that served to significantly improve the manuscript. Any use of trade, firm, or product names is for descriptive purposes only and does not imply endorsement by the U.S. government.
Disclosure statement
No potential conflict of interest was reported by the authors.
Related Research Data
References
- Anchukaitis, K. J., R. D. D’Arrigo, and L. Andreu-Hayles. 2013. Tree-ring-reconstructed summer temperatures from northwestern North America during the last nine centuries. Journal of Climate 26:1–26.
- Anderson, L., M. B. Abbott, and B. P. Finney. 2001. Holocene climate inferred from oxygen isotope ratios in lake sediments, central Brooks Range, Alaska. Quaternary Research 55:313–21.
- Anderson, L., M. B. Abbott, B. P. Finney, and S. J. Burns. 2007. Late Holocene moisture balance variability in the southwest Yukon Territory, Canada. Quaternary Science Reviews 26:130–41.
- Anderson, L., M. Berkelhammer, J. A. Barron, B. A. Steinman, B. P. Finney, and M. B. Abbott. 2016. Lake oxygen isotopes as recorders of North American Rocky Mountain hydroclimate: Holocene patterns and variability at multi-decadal to millennial time scales. Global and Planetary Change 137:131–148.
- Anderson, L., J. Birks, J. Rover, and N. Guldager. 2013. Controls on recent Alaskan lake changes identified from water isotopes and remote sensing. Geophysical Research Letters 40:3413–18.
- Anderson, L., B. P. Finney, and M. D. Shapley. 2011. Lake carbonate-δ18O records from the Yukon Territory, Canada: Little Ice Age moisture variability and patterns. Quaternary Science Reviews 30:887–98.
- Appleby, P. G. 2001. Chronostratigraphic techniques in recent sediments. In Tracking environmental change using lake sediments. volume 1: basin analysis, coring, and chronological techniques, W. M. Last, and J. P. Smol eds., 171–203. Dordrecht, The Netherlands: Kluwer Academic Publishers.
- Bade, D. L., and S. R. Carpenter. 2004. Controls of δ13C-DIC in lakes: Geochemistry, lake metabolism, and morphometry. Limnology and Oceanography 49:1160–72.
- Barclay, D. J., G. C. Wiles, and P. E. Calkin. 2009. Holocene glacier fluctuations in Alaska. Quaternary Science Reviews 28:2034–48.
- Bastiviken, D., J. Ejlertsson, I. Sundh, and L. Tranvik. 2003. Methane as a source of carbon and energy for lake pelagic food webs. Ecology 84:969–81.
- Benson, L., and F. Paillet. 2002. HIBAL: A hydrologic-isotopic-balance model for application to paleolake systems. Quaternary Science Reviews 21:1521–39.
- Bird, B. W., M. B. Abbott, B. P. Finney, and B. Kutchko. 2009. A 2000 year varve-based climate record from the central Brooks Range, Alaska. Journal of Paleolimnology 41:25–41.
- Blaauw, M., and J. A. Christen. 2011. Flexible paleoclimate age-depth models using an autoregressive gamma process. Bayesian Analysis 6:457–74.
- Blaauw, M., and J. A. Christen, 2013. Bacon Manual v.2.2, p. 11 at: http://www.chronoqub.ac.uk/blaauw/bacon.html (last accessed 31.10.2017).
- Chen, M., J. C. Rowland, C. J. Wilson, G. L. Altmann, and S. P. Brumby. 2014. Temporal and spatial patterns of thermokarst lake area changes at Yukon Flats, Alaska. Hydrology Processing 28:837–52.
- Chipman, M. L., B. F. Clegg, and F. S. Hu. 2012. Variation in the moisture regime of northeastern interior Alaska and possible linkages to the Aleutian Low: Inferences from a late Holocene δ18O record. Journal of Paleolimnology 48:69–81.
- Clautice, K. H., and T. C. Mowatt. 1981. Trona occurrences within the Yukon Flats Basin, Alaska. U.S. Bureau of Mines Open File Report No. 69–81.
- Clegg, B. F., and F. S. Hu. 2010. An oxygen-isotope record of Holocene climate change in the south-central Brooks Range, Alaska. Quaternary Science Reviews 29:928–39.
- Clegg, B. F., R. Kelly, G. H. Clarke, I. R. Walker, F. S. Hu, and T. A. Brown. 2011. Nonlinear response of summer temperature to Holocene insolation forcing in Alaska. Proceedings of the National Academy of the Sciences USA 108:19299–304.
- Drury, S. A., and P. J. Grissom. 2008. Fire history and fire management implications in the Yukon Flats National Wildlife Refuge, interior Alaska. Forest Ecosystem Management 256:304–12.
- Edwards, M., G. Grosse, B. M. Jones, and P. McDowell. 2016. The evolution of a thermokarst-lake landscape: Late Quaternary permafrost degradation and stabilization in interior Alaska. Sedimentary Geology 340:3–14.
- Engleman, E. E., L. L. Jackson, and D. R. Norton. 1985. Determination of carbonate carbon in geologic materials by coulometric titration. Chemical Geology 53:125–28.
- Epstein, S., R. Buchsbaum, H. A. Lowestam, and H. C. Urey. 1953. Revised carbonate-water temperature scale. Geological Society of America Bulletin 64(11):1315–1326.
- Finney, B. P., N. H. Bigelow, V. A. Barber, and M. E. Edwards. 2012. Holocene climate change and carbon cycling in a groundwater-fed, boreal forest lake: Dune Lake, Alaska. Journal of Paleolimnology 48:43–54.
- Friedman, I., and J. R. O’Niel. 1977. Compilation of stable isotope fractionation factors of geochemical interest. In Data of Geochemistry. U.S. Geological Survey Professional Paper No. 440-KK.
- Gällman, V., J. Rydberg, S.S. de-Luna, R. Bindler, and I. Renberg. 2008. Carbon and nitrogen loss rates during aging of lake sediment: changes over 27 years studied in varved lake sediment. Limnology and Oceanography 53:1076–1082.
- Gibson, J. J., J. S. Birks, and Y. Yi. 2016. Stable isotope mass balance of lakes: A contemporary perspective. Quaternary Science Reviews 131:316–28.
- Glew, J. R., J. P. Smol, and W. M. Last. 2001. Sediment core collection and extrusion. In Tracking environmental change using lake sediments. volume 1: basin analysis, coring, and chronological techniques, W. M. Last, and J. P. Smol. eds, 73–105. The Netherlands: Kluwer Academic Publishers, Dordrecht.
- Halm, D. R., and N. Guldager. 2012. Water-quality data of lakes and wetlands in the Yukon Flats, Alaska 2007–2009. US Geological Survey Open File Report No. 2012–1208.
- Hawkins, D. B. 1995. Geochemistry of saline lakes of the northeastern Yukon Flats, east central Alaska. 1995, State of Alaska Department of Natural Resources Division of Geological and Geophysical Surveys Professional Report No. 116.
- Heglund, P. J., and J. R. Jones. 2003. Limnology of shallow lakes in the Yukon Flats National Wildlife Refuge, interior Alaska. Lake and Reservoir Management 19:133–40.
- Heslop, J. K., K. M. Walter Anthony, A. Sepulveda-Jauregui, K. Martinez-Cruz, A. Bondurant, G. Grosse, and M. C. Jones. 2015. Thermokarst lake methanogenesis along a complete talik profile. Biogeosciences 12:4317–31.
- Higuera, P. E., L. B. Brubaker, P. M. Anderson, F. S. Hu, and T. A. Brown. 2009. Vegetation mediated the impacts of postglacial climate change on fire regimes in the south-central Brooks Range, Alaska. Ecological Monographs 79:201–19.
- Hinzman, L. D., N. D. Bettez, W. R. Bolton, F. S. Chapin, M. B. Dyurgerov, C. L. Fastie, B. Griffith, R. D. Hollister, A. Hope, H. P. Huntington, et al. 2005. Evidence and implications of recent climate change in Northern Alaska and other Arctic regions. Climate Change 72:251–98.
- Jepsen, S. M., C. I. Voss, M. A. Walvoord, B. J. Minsley, and J. Rover. 2013. Linkages between lake shrinkage/expansion and sublacustrine permafrost distribution determined from remote sensing of interior Alaska, USA. Geophysical Research Letters 40:1–6.
- Jepsen, S. M., C. I. Voss, M. A. Walvoord, J. R. Rose, B. J. Minsley, and B. D. Smith. 2012. Sensitivity analysis of lake mass balance in discontinuous permafrost: The example of disappearing Twelvemile Lake, Yukon Flats, Alaska (USA). Hydrogeology Journal 21:185–200.
- Jones, B. M., and C. D. Arp. 2015. Observing a catastrophic thermokarst lake drainage in northern Alaska. Permafrost and Periglacial Processes 26:119–28.
- Jorgenson, M. T., and T. E. Osterkamp. 2005. Response of boreal ecosystems to varying modes of permafrost degradation. Canadian Journal of Forest Research 35:2100–11.
- Jorgenson, M. T., C. H. Racine, J. C. Walters, and T. E. Osterkamp. 2001. Permafrost degradation and ecological changes associated with a warming climate in central Alaska. Climatic Change 48:551–79.
- Jorgenson, M. T., V. Romanovsky, J. Harden, Y. Shur, J. O’Donnell, E. A. G. Schuur, M. Kanevskly, and S. Marchenko. 2010. Resilience and vulnerability of permafrost to climate change. Canadian Journal of Forest Research 40:1219–36.
- Kelly, R., M. L. Chipman, P. E. Higuera, I. Stefanova, L. B. Brubaker, and F. S. Hu. 2013. Recent burning of boreal forests exceeds fire regime limits of the past 10,000 years. Proceedings of the National Academy of Sciences of the United States of America 110:13055–60.
- Klein, E. S., J. E. Cherry, J. Young, D. Noone, A. J. Leffler, and J. M. Welker. 2015. Arctic cyclone water vapor isotopes support past sea ice retreat recorded in Greenland ice. Scientific Reports 5. doi:https://doi.org/10.1038/srep10295.
- Klein, E. S., M. Nolan, J. McConnell, M. Sigl, M. Cherry, J. Young, and J. M. Welker. 2016. McCall Glacier record of Arctic climate change: interpreting a northern Alaska ice core with regional water isotopes. Quaternary Science Reviews 131:274–84.
- Lachniet, M. S., D. E. Lawson, S. Haroon, A. R. Sloat, and W. P. Patterson. 2016. Isoscapes of d18O and d2H reveal climatic forcings on Alaska and Yukon precipitation. Water Resources Research 52. doi:https://doi.org/10.1002/2016WR019436.
- Lauriol, B., D. Lacelle, S. Labreque, C. R. Duguay, and A. Telka. 2009. Holocene evolution of lakes in the Bluefish Basin, Northern Yukon, Canada. Arctic 62:212–24.
- Leng, M. J., A. L. Lamb, T. H. E. Heaton, J. D. Marshall, B. B. Wolfe, M. D. Jones, J. A. Holmes, and C. Arrowsmith. 2005. Isotopes in lake sediment. In Isotopes in Palaeoenvironmental Research, M. J. Leng. ed., 147–84. Dordrecht, The Netherlands: Springer.
- Lewis, T. L., M. S. Lindberg, J. A. Schmutz, P. J. Heglund, J. Rover, J. C. Koch, and M. R. Bertram. 2014. Pronounced chemical response of Subarctic lakes to climate-driven losses in surface area. Global Change Biology 21:1140–52.
- Li, H.-C., and T.-L. Ku. 1997. δ13C-δ18O covariance as a plaeohydrological indicator for closed-basin lakes. Palaeogeography, Palaeoclimatology, Palaeoecology 133:69–80.
- MacDonald, L. A., B. B. Wolfe, K. W. Turner, L. Anderson, C. D. Arp, J. Birks, F. Bouchard, T. W. D. Edwards, N. Farquharson, R. I. Hall, et al. 2017. A synthesis of thermokarst lake water balance in high latitude regions of North America from isotope tracers. Arctic Sciences 3:118–49.
- Mann, D., P. A. Heiser, and B. P. Finney. 2002. Holocene history of the Great Kobuk Sand Dunes, northwestern Alaska. Quaternary Science Reviews 21:709–31.
- Minsley, B. J., J. D. Abraham, B. D. Smith, J. C. Cannia, C. I. Voss, M. T. Jorgenson, M. A. Walvoord, B. K. Wylie, L. Anderson, L. B. Ball, et al. 2012. Airborne electromagnetic imaging of discontinuous permafrost. Geophysical Research Letters 39:L02503. doi:https://doi.org/10.1029/2011GL050079.
- Reimer, P. J., E. Bard, A. Bayliss, J. W. Beck, P. G. Blackwell, C. Bronk Ramsey, C. E. Buck, H. Cheng, R. L. Edwards, M. Friedrich, et al. 2013. IntCal13 and Marine13 radiocarbon age calibration curves 0-50,000 years cal BP. Radiocarbon 55:1869–87.
- Riordan, B., D. Verbyla, and D. A. McGuire. 2006. Shrinking ponds in Subarctic Alaska based on 1950–2002 remotely sensed images. Journal of Geophysical Research 111:G04002.
- Roach, J., B. Griffith, D. Verbyla, and J. Jones. 2011. Mechanisms influencing changes in lake area in Alaskan boreal forest. Global Change Biology 17:2567–83.
- Rose, J., and N. Guldager. 2012. Pilot Study of Permafrost, Groundwater, and Lake Dynamics Interim Progress Report. U.S. Fish and Wildlife Service Yukon Flats National Wildlife Refuge Interim Progress Report - 2012.
- Rover, J., B. K. Wylie, and L. L. Tieszen. 2012. Establishing water body areal extent trends in interior Alaska from multi-temporal Landsat data. Remote Sens Letters 3:595–604.
- Sepulvida-Jauregui, A., K. M. Walter Anthony, K. Martinez-Cruz, S. Greene, and F. Thalasso. 2015. Methane and carbon dioxide emissions from 40 lakes along a north south latitudinal transect in Alaska. Biogeosciences 12:3197–223.
- Shapley, M. D., E. Ito, and J. J. Donovan. 2008. Isotopic evolution and climate paleorecords: Modeling boundary effects in groundwater-dominated lakes. Journal of Paleolimnology 39:17–33.
- Shapley, M. D., E. Ito, and J. J. Donovan. 2009. Lateglacial and Holocene hydroclimate inferred from a groundwater flow-through lake, Northern Rocky Mountains, USA. Holocene 19:523–35.
- Shulski, M., and G. Wendler. 2007. The Climate of Alaska. Fairbanks: University of Alaska Press.
- Smith, L. C., Y. Sheng, G. M. MacDonald, and L. D. Hinzman. 2005. Disappearing Arctic lakes. Science 308:1429.
- Steinman, B. A., and M. B. Abbott. 2013. Isotopic and hydrologic responses of small, closed lakes to climate variability: Hydroclimate reconstructions from lake sediment oxygen isotope records and mass balance models. Geochimica et Cosmochimica Acta 105:342–59.
- Stuiver, M., and P. J. Reimer. 1993. Extended 14C data base and revised Calib 3.0 14C age calibration program. Radiocarbon 35:215–30.
- Tarutani, T., R. N. Clayton, and T. K. Mayeda. 1969. The effect of polymorphism and magnesium substitution on oxygen isotope fractionation between calcium carbonate and water. Geochimica et Cosmochimica Acta 33:987–96.
- Walter Anthony, K. M., S. A. Zimov, G. Grosse, M. C. Jones, P. M. Anthony, F. S. I. I. I. Chapin, J. C. Finlay, M. C. Mack, S. Davydov, P. Frenzel, et al. 2014. A shift of thermokarst lakes from carbon sources to sinks during the Holocene epoch. Nature 511:452–56.
- Wiles, G. C., D. J. Barclay, P. E. Calkin, and T. V. Lowell. 2008. Century to millennial-scale temperature variations for the last two thousand years indicated from glacial geologic records of southern Alaska. Global and Planetary Change 60:115–25.
- Williams, J. R. 1962. Geologic reconnaissance of the Yukon Flats district, Alaska, U.S. Geological Survey Bulletin No. 1111–H.
- Williams, J. R. 1970. Groundwater in the permafrost regions of Alaska. US Geological Survey Professional Paper No. 606.
- Wooller, M. J., J. W. Pohlman, B. V. Gaglioti, P. Langdon, M. C. Jones, K. M. Walter Anthony, K. W. Becker, K.-U. Hinrichs, and M. Elvert. 2012. Reconstruction of past methane availability in an Arctic Alaska wetland indicates climate influenced methane release during the past ~12,000 years. Journal of Paleolimnology 48:27–42.