?Mathematical formulae have been encoded as MathML and are displayed in this HTML version using MathJax in order to improve their display. Uncheck the box to turn MathJax off. This feature requires Javascript. Click on a formula to zoom.
ABSTRACT
The distributions of biomes worldwide are predicted to shift as vegetation tracks climate change. Ecologists often use coarse-scale climate models to predict these shifts along broad elevational and latitudinal gradients, but these assessments could fail to capture important dynamics by ignoring fine-scale heterogeneity. We ask how the elevational ranges of vegetation types have changed in a mountainous landscape, and investigate the influence of fine-scale topographic, snowpack, and soil properties on vegetation change. We manually classified vegetation from high-resolution repeat aerial photographs from 1972 and 2008 at Niwot Ridge, Colorado, USA, and generally found that trees and shrubs colonized tundra, while tundra colonized barren soils. Only shrubs expanded their elevational range. Several fine-scale topographic, soil and snow characteristics, including elevation, slope, solar radiation, soil bulk density, and interannual snowpack variability, modulated where plant establishment occurred. Each vegetation type had a unique suite of variables best predicting its establishment in new areas. We suggest that fine-scale heterogeneity may strongly control how plants in mountainous regions respond to climate change, and different vegetation types may be sensitive to different aspects of this heterogeneity. An improved understanding of the factors controlling vegetation change gives us a broader understanding of ecosystem response to climate change, nitrogen deposition, and release from grazing.
Introduction
Rising temperatures have dramatically altered growing conditions for plant species in many regions of the globe (IPCC Citation2014; Walther Citation2003). Global temperatures have increased by 0.6°C since 1951, and are expected to rise between 0.3°C and 4.8°C by the year 2100, depending on emissions scenarios (IPCC Citation2014). The effects of climate change are amplified in mountain ecosystems, where plants are generally more susceptible to habitat loss (Elsen and Tingley Citation2015; Engler et al. Citation2011). In addition to climate change, many sites are also experiencing higher levels of nitrogen (N) deposition, and in some cases, cessation from grazing (Dullinger et al. Citation2003; Galloway et al. Citation2008). Because mountain ecosystems have a high degree of topographic heterogeneity, which in turn leads to heterogeneity in microclimates, snowpack, and soil properties, plant responses to environmental change may not be uniform across the landscape (Ackerly et al. Citation2010; Ford et al. Citation2013; Geiger, Aron, and Todhunter Citation2012). For example, over the scale of tens of meters, there can be a shift from a dry, windswept knoll-top with little to no snowpack and shallow, rocky soil, to a leeward knoll-slope with a meters-deep snowpack, and deep, moist, organic soils (Bowman and Seastedt Citation2001; Bruun et al. Citation2006). Thus, to make accurate predictions about changes in species distributions, it is crucial to examine how these finer-scale factors mediate responses to environmental change (Austin and van Niel Citation2011; Barrows and Murphy-Mariscal Citation2012; Luoto and Heikkinen Citation2008; Randin et al. Citation2009; Trivedi et al. Citation2008).
One of the primary impacts of climate change on mountain ecosystems has been a shift in the distribution of herbaceous plants, shrubs, and trees. Several studies have reported dramatic upward shifts in herbaceous alpine plant species (Grabherr et al. Citation2010; Lenoir et al. Citation2008; Parmesan and Yohe Citation2003; Parolo and Rossi Citation2008; Peñuelas and Boada Citation2003; Pockley Citation2001; Walther, Beißner, and Burga Citation2005). Shrub encroachment into both arctic and alpine tundra has been widely reported as a response to warming (Elmendorf et al. Citation2012; Hallinger, Manthey, and Wilmking Citation2010; Myers-Smith et al. Citation2011; Sturm, Racine, and Tape Citation2001; Tape, Sturm, and Racine Citation2006), and a global manipulative warming experiment provides strong evidence that warming is the driver of this response (Walker et al. Citation2006). In addition, tree range expansion toward higher elevations has been associated with increases in air temperature (Beckage et al. Citation2008; Lenoir et al. Citation2008; Peñuelas and Boada Citation2003).
Despite these results, shifts in the distribution of vegetation have not been uniform in the context of warming, indicating that other factors are at play. Importantly, fine-scale variables such as topography, snowpack, and soil properties could play a role in modulating vegetation responses to warming, especially in mountainous regions (Bourgeron et al. Citation2015). It is well established that all of these factors influence plant growth, phenology, and community composition in alpine tundra (Bowman and Seastedt Citation2001; Dearborn and Danby Citation2017; Körner Citation2013; Malanson, Bengtson, and Fagre Citation2012; Rose and Malanson Citation2012; Suding et al. Citation2015; Theobald, Breckheimer, and HilleRisLambers Citation2017; Vonlanthen, Kammer, and Eugster Citation2006), subalpine meadows (Loneragan and del Moral Citation1984), treeline communities (Bader and Ruitjen Citation2008; Grafius, Malanson, and Weiss Citation2013; Holtmeier Citation2009; Weiss, Malanson, and Walsh Citation2015), and montane forests (McKenzie et al. Citation2003). Thus, they could also play a role in influencing vegetation change over time, but this has been less well studied.
For example, some studies have found that topographic factors such as the slope and aspect of a site play a greater role than atmospheric temperature in governing the distributional responses of low-growing vegetation (Bennie et al. Citation2006; Scherrer and Körner Citation2011). Others have identified plants shifting to lower elevations as a result of climate-based changes in plant water balance (Crimmins et al. Citation2011). For shrubs, both habitat conditions and biotic interactions make expansion into tundra meadows spatially heterogeneous (Dullinger, Dirnböck, and Grabherr Citation2013). Lastly, factors such as high wind speeds, which often occur in mountainous regions, can negate the warming effect and prevent shifting of the treeline (Holtmeier and Broll Citation2010). In other cases, upwards shifts in treelines have occurred, but only in certain aspects or slopes (Danby and Hik Citation2007; Treml and Chuman Citation2015). In a global review of treeline studies, which had an average length of 59 years, Harsch et al. (Citation2009) it was found that treelines had only shifted to higher latitudes or elevations in half of the studies examined, and krummholz treelines, typical of elevational gradients, were less likely to have shifted with warming. The non-uniformity of elevational vegetation responses to warming in mountain regions warrants further investigation into the factors that can influence these responses.
Central to the discussion of this variation in responses to climate change is the difference between microclimate and macroclimate. Weather stations do not capture the fine-scale climatic variations at the landscape scale (Ashcroft, Chisholm, and French Citation2009; Ashcroft and Gollan Citation2012; De Frenne et al. Citation2013; Scherrer and Körner Citation2010), which can be influenced by elevation, radiation, moisture, and exposure (Ashcroft, Chisholm, and French Citation2008; Lookingbill and Urban Citation2003). If plants are already confined to specific microclimates, then they will vacate microclimates at the trailing edge at the same rate as they would colonize new microclimates at the leading edge. However, the distribution of alpine microclimates and rates of warming are highly variable (MacLean et al. Citation2016), and therefore local vegetation responses to climate change differ significantly from predictions by macro-scale models.
In this study, we investigated the extent to which the distributions of high-elevation plant vegetation types (alpine tundra, subalpine forest, shrubs) have responded spatially to climate change over the past four decades. We utilized fine-scale topographic data, satellite-derived snow water equivalent estimates, and field-derived soil measurements to assess the influence of topography, snowpack, and edaphic properties on vegetation change. Because temperature and late melting snow are often thought to be limiting factors at the upper elevation ranges of all these vegetation types, we expected (i) all vegetation types to show movement uphill in response to observed warming over the last several decades. Additionally, we expected (ii) a suite of fine-scale characteristics to also influence vegetation establishment, with greater establishment in microsites with greater exposure to warming (greater solar radiation; MacLean et al. Citation2016), shallower snowpacks that lengthen the growing season (Franklin et al. Citation1971), flatter slopes (that experience less disturbance from rock slides and receive more soil moisture that drains from hillslopes; Suding et al. Citation2015; Walker et al. Citation1996) and on deeper and less dense soil (reflecting greater soil development, water holding capacity and nutrient concentrations; Aina and Periaswamy Citation1985; Chaudhari et al. Citation2013). Thus, we expect that vegetation can move upwards in elevation, but only given certain conditions of other fine-scale variables.
Materials and methods
Study site
Our study was conducted at the Niwot Ridge Long Term Ecological Research (LTER) site and the adjacent valleys to the north (Brainard Lakes) and south (Green Lakes Valley), in the Front Range of the Rocky Mountains, Colorado, USA (, 40° 3′ 20′ N, 105° 35′ 22′ W). The site borders the continental divide on its western end, and is about 25 km west of Boulder, CO (). There is evidence of human activity at this site, including game-wall systems for hunting, that ranges in age from 7650 to 500 years before present (Bowman and Seastedt Citation2001). The site was also heavily grazed by sheep in the 1940’s (Bowman and Seastedt Citation2001). Nitrogen (N) deposition has been increasing over the last few decades to current estimated rates of 6.2 kg N ha−1 yr−1 (Formica et al. Citation2014; Simkin et al. Citation2016). Average precipitation from 1952 to 2012 in the alpine at our site was 1090 ± 230 mm yr−1, with a 60 mm yr−1 increase over that time period, driven mostly by increases in winter precipitation (Kittel et al. Citation2015). Summer temperature data from 1972 to 2008 at our site show a warming trend, especially since 1980 (), and overall temperatures also increased between 1989 and 2008 (McGuire et al. Citation2012). This has led to increased positive degree days and earlier snow meltout times (Caine Citation2010; McGuire et al. Citation2012; Preston et al. Citation2016). Climate at our site is affected by larger scale oscillation patterns in the Pacific, and changes in climate in the 1980’s and 1990’s may be partly attributable to shifts in the Pacific Decadal Oscillation (Kittel et al. Citation2002). Treeline, or the upper limit of tree life including krummholz (stunted, windblown tree mats) (Tinner and Theurillat Citation2003), is mostly a gradual krummholz form, where the trees at their uppermost limit are stunted and windblown. Treeline species here are primarily Picea engelmanni (Parry ex Engelmann) (Engelmann Spruce), Abies lasiocarpa (Hook.) Nutt. (Subalpine Fir), and to a lesser extent, Pinus flexilis (James) (Limber Pine). Some P. engelmanni seedlings have been found 50 m above the main closed canopy timberline (Daly and Shankman Citation1985; Peet Citation1978). The most abundant shrub is the willow Salix glauca (Linnaeus). Alpine tundra on Niwot Ridge is representative of the region and includes wet, moist, and dry meadow communities, as well as fellfield and snowbed communities (Suding et al. Citation2015).
Figure 1. Map of the study area and 2000 randomly generated points showing where the three most common vegetation changes occurred as well as points that did not change vegetation type. The points are overlaid on the 2008 orthophoto with hill shading and 100 m contour lines. Bare to tundra n = 39, tundra to shrub n = 27, tundra to open forest n = 26
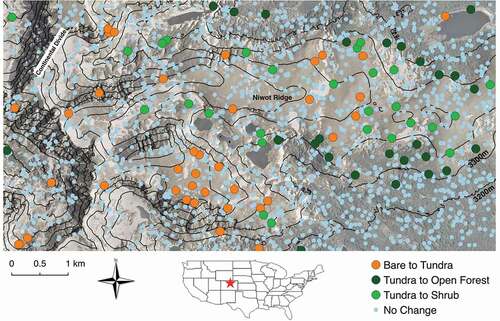
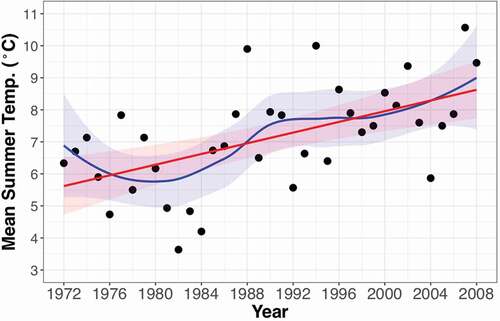
Figure 2. Mean summer (June, July, August) temperatures from the D1 Meteorological Station (3739 m.a.s.l.) on Niwot Ridge, CO, USA, showing a strong warming trend in the time between the orthophotos (1972, 2008). The linear regression line (red, p < 0.001, R2 = 0.31) as well as a loess function (blue), with 95% confidence intervals (shaded) are shown
Aerial images
High resolution (0.6 m) orthographic photographs (orthophotos) taken in 1972 (color-infrared) (DEM) and 2008 (true-color) included an approximately 38 km2 region that encompasses subalpine forest, alpine tundra, subnival talus areas, and high peaks, with an elevation range of approximately 3100–4100 m. The photos were topographically corrected and are available on the Niwot Ridge LTER website (niwot.colorado.edu). We characterized ground cover at 2000 randomly generated points across the extent of the orthophotos. These points became our dependent variable in logistic regression models (0 for no vegetation change, 1 for vegetation change). The cover class categories were bare ground, permanent snowpack/glacier, rock, water, alpine tundra, shrub, open forest, and closed canopy forest. Both supervised and unsupervised maximum likelihood classification did a poor job in classifying these particular images into these desired classes, so we classified points manually. We defined open forest as points touching tree vegetation that existed in patches or islands with less than 75% canopy cover within a 25-meter radius of the point. If the point landed on grassy vegetation within an open forest (i.e. a subalpine meadow), the point was classified as tundra vegetation, as these meadows still contain many alpine species. Of the 2000 points, 424 were water, snow, or rock in both years, leaving 1576 points with vegetation (). Our analyses focused on 1532 of these points, which overlapped with our snow water equivalent (SWE) dataset (Jepsen et al. Citation2012, see below).
Predictor variables
Elevation, slope, and solar radiation were derived from a 2 m LiDAR-based digital elevation model (DEM) and conferred to each point using QGIS (QGIS Development Team Citation2015). Solar radiation was calculated using the area solar radiation tool in Spatial Analyst in ArcGIS 10.2.2 (ESRI Citation2015). This tool calculates solar radiation based on slope, aspect, and shading from a DEM for a particular date and time. For consistency with our SWE data (see below), we calculated solar radiation at midday on June 1st, which is also representative of typical exposure to sun during the main part of the growing season in July. Solar radiation has a large impact on temperature and is commonly used to adjust temperature models of mountain landscapes (Daly et al. Citation2007; Dubayah Citation1994; Fridley Citation2009). Because it is based in part on topography, we consider it as a topographic variable.
The SWE data is from a 12-year distributed SWE reconstruction model, which integrates hydrometeorological observations, a distributed snowpack energy balance model, and Landsat-derived snow cover from 1996–2007 (Jepsen et al. Citation2012). The model back-calculates SWE wherever the snow is deposited, but still suffers errors due to distribution by wind (Jepsen et al. Citation2012). In general, the dataset adequately identifies parts of the landscape receiving more snow than others. We acknowledge that errors in the model could lead to false negative or false positive results, which should be interpreted cautiously. Snow water equivalent is a measure of the amount of water contained in the snowpack, expressed as a linear depth for each 30 m grid cell. Since late spring snow determines the length of the growing season, which affects plant growth and reproduction (Kirdyanov et al. Citation2003; Kudo, Nordenhall, and Molau Citation1999; Totland and Alatalo Citation2002), we focused on the 12-year mean, inter-annual variation, and 12-year trend (slope of linear regression model), of SWE on June 1st. Inter-annual variation was calculated as the coefficient of variation (CV, standard deviation/mean) for the 12 years. These variables were calculated for each pixel, and then conferred to our classified points.
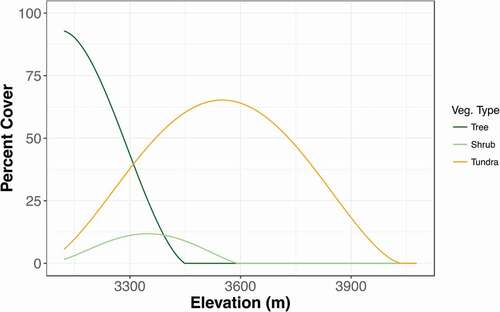
Finally, because colonization is most likely to occur near sources of propagules, we calculated a percent cover (of trees, shrubs, and tundra) variable. Cover (proportion of points) and elevation had strong but nonlinear relationships. Thus, we made polynomial models of the relationship between elevation and the percent cover of each vegetation type and then used the coefficients from the model to calculate an approximate percent cover of each vegetation type at each of the 1532 points (). This variable, however, can only be viewed as a rough approximation of the amount of viable seed produced by each vegetation type. Some herbaceous plant, shrub, and tree species show decreases in seed production at their range edges (Jump and Woodward Citation2003; Vaupel and Matthies Citation2012; HilleRisLambers et al. Citation2013; Myers-Smith et al. Citation2011; Kroiss and HilleRisLambers Citation2015; Buechling et al. Citation2016). Two years of monitoring seed traps at our site captured no seed production at treeline (Robert Andrus, personal communication). Thus, it is likely that we overpredicted the importance of cover on vegetation change. However, it is still important to include this variable as a basic representation of propagule sources.
In June–August 2015, we ground-truthed vegetation cover at a total of 187 points. Our overall classification accuracy of land cover identity was 92%, with respect to our 2008 classifications. Our sampling scheme involved surveying points in groups of three: a point at which the vegetation cover type had changed based on the orthophotos, a nearby (~ 20–200 m away) point where vegetation had not changed and was the same cover type as the first point in 1972, and a nearby point where vegetation had not changed and was the same cover type as the first point in 2008. In two instances, one point of the three was unable to be reached. At the locations we visited, we measured soil depth by hammering in rebar until it hit bedrock, and collected three soil cores to 10 cm depth to measure gravimetric water content, pH from a 1:2 soil to deionized water slurry, and bulk density. At points with shrubs and trees present, shrub and tree species were identified within a 2 m radius of the GPS point.
Analyses
We examined the minimum and maximum elevation values for each vegetation type in each year to determine if there were range expansions or contractions. Because this could be driven by outliers and not reflect any of the dynamics within the range, we also examined the 5th and 95th percentile elevation values for each vegetation type in each year (Zhu et al. 2012). Then, we conducted both univariate and multiple logistic regressions to test our hypotheses about the influence of certain topographic, snowpack, and soil properties on vegetation change. In these models, a value of zero signified any vegetation class in 1972 other than the focal vegetation class that did not change to the focal vegetation class by 2008, while a value of 1 signified any vegetation class in 1972 other than the focal vegetation class that did change to the focal vegetation class by 2008. To be realistic, we limited the forest analysis to points < 3600 m, given that the treeline occurs at ~ 3550 m (Peet Citation1978; personal observation). The shrub analysis was similarly restricted to points lower than < 3760 m because the highest shrub identified in 2008 was at 3710 m. We limited the tundra analysis to points higher than the 3550 m treeline elevation. The tree and shrub ranges incorporate a 50 m elevation buffer where it is reasonably possible that a tree or shrub could disperse to and establish. This number is reasonable based on previous work on willow seed morphology, spruce and fir dispersal, and the winds at our site (Alexander and Edminster Citation1983; Noble and Ronco Citation1978; Uchytil Citation1992). Models including topography and SWE variables utilized the entire dataset of 1532 points, whereas models including soil factors only included data from the 187 ground-truthed points where soils were sampled.
To test our hypothesis about fine-scale topographic and SWE variables, we ran logistic regressions using an exhaustive, all subsets, AIC selection method (runs all combinations of predictor variables and selects models with the lowest AIC) to identify the best combination of predictors of a vegetation transition (R package ‘bestglm’; McLeod and Xu Citation2014), which was then used to map predicted probabilities of change across the landscape. We excluded soil variables from this analysis, as we only sampled these variables at the ground-truthed points (12% of all the points). To make our analyses more robust and account for the spatial processes at play during vegetation change, as well as potentially complex distributional relationships and latent interactions, we also ran geographically weighted logistic regressions (GWLR, R package ‘GWmodel’; Gollini et al. Citation2015), which essentially adds a spatial term to the logistic regression model, and random forest classification models (RFC, R package ‘randomForest’; Liaw and Wiener Citation2002), which is a nonparametric approach involving decision trees that can take into account interactions and nonlinearity. We ran these models to see if they gave the same results as the logistic regressions.
To specifically test for effects of soil variables on vegetation transitions, we conducted univariate logistic regressions for each predictor variable (soil depth, soil pH, soil bulk density). We interpreted terms with a p-value < 0.05 to be significant predictors, and determined the relationship between the predictor and response variables by the sign of the coefficient from the model.
To help describe the data, rates of change per decade for each vegetation class were calculated using EquationEquation 1(1)
(1) , following Dial et al. (Citation2007).
where 3.6 represents the number of decades and N2008 and N1972 are the number of points of each vegetation class in that year. All analyses were performed with the statistical software R (version 3.4.0, R Core Team Citation2017).
Results
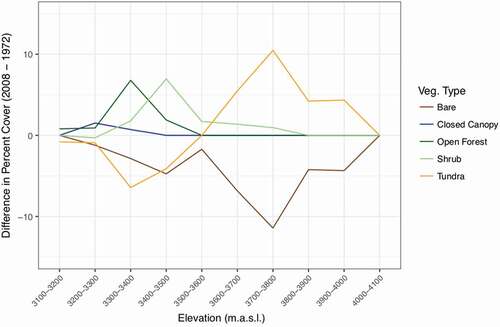
We found strong evidence of vegetation change across the landscape, especially encroachment by woody vegetation into areas previously characterized by other cover types (, , ). The largest increase in cover was by shrubs, which increased by nearly 8% per decade. This expansion was driven by colonization of tundra and barren soil by Salix glauca at elevations between 3400–3500 m (). For tree cover, open forest increased by 3.9% per decade while closed canopy forest cover increased by a mere 0.6% per decade. The increase in open forest was driven by infilling of tundra in the 3200–3400 m (subalpine tundra meadows) elevation range, mostly by Picea engelmanni and Abies lasiocarpa (). Bare ground cover decreased by 4.9% per decade, constituting the largest decrease. Alpine tundra vegetation decreased overall by 0.5% per decade, but increased at higher elevations (, ). Tundra vegetation colonized barren soils at higher elevations, with a 6.2% increase per decade at 3700–3800 m elevation (). Plant species richness at ground-truthed plots that switched from barren soil to tundra vegetation (n = 13) ranged from 5 to 11. The forb Geum rossii (R. Br.) Ser. most frequently colonized barren soils. Individuals representing vegetation that had established since 1972 were typically smaller in size and isolated, suggesting that new seedlings established during the time period rather than in situ growth.
Table 1. Land cover change matrix based on classification of orthophotos from 1972 and 2008. Numbers are the number of sample points out of 1576 within each category. Also shown are the rates of change per decade. Bolded numbers highlight the three most common types of vegetation change, which are the focus here
Figure 3. Difference in the percentage of points in each land cover class between 2008 and 1972. At 3700–3800 m, tundra increased from 41.9% of the points to 52.4% of the points, which is a difference in percent of 10.5
Elevation expansion or contraction
No vegetation type experienced a range contraction at the lower end of their elevational range. Tundra vegetation and open forests did not experience range expansion at the upper end of their elevation range, while shrubs moved uphill 14 meters. The distribution of points within the ranges tended to shift upwards in elevation, with all vegetation types showing increases in the 95th percentile ().
Table 2. Minimum, 5th percentile, 95th percentile, and maximum elevation (meters above sea level) values for each vegetation type in each year
Topography, SWE, and soil
There were no consistent effects of topographic, SWE, or soil variables on vegetation expansion across vegetation types. Solar radiation was the only predictor variable common to all three of the vegetation types, but the direction of the relationship ranged from positive (tree and shrub) to negative (tundra). Each vegetation transition had its own suite of important predictor variables ().
Table 3. Predictor variables included in the best-fit logistic regression model for expansion of each vegetationtype. Variables bolded and italicized were also present in both the best geographically weighted logistic regression model and random forest classification model. Italicized variables were only included in one of the other modeling techniques. The ∆AIC was calculated as AICnull model – AICbest model where the null model is an intercept only model. Lower AIC’s indicate better model fits. A decrease in AIC of more than 2 typically means significant model improvement. The R2 value is Nagelkerke’s pseudo R2 value for logistic regression. AUC is the area under the receiver operating characteristic curve and is a measure of model accuracy that ranges from 0 to 1 with 1 being a perfectly accurate model (no false positives or negatives). SWE = snow water equivalent. SWE trend is the slope of a linear regression model of SWE over 12 years (1996–2007); SWE CV is the coefficient of variation (standard deviation/mean) of SWE
For open forest expansion, tree cover (range = 0 – 93%, b = −0.26, p = 2.70e-05), elevation (range = 3121 – 3600m, b = −0.08, p = 5.71e-05), and solar radiation (range = 11 – 28 WH m−2, b = 0.27, p = 0.00842) was the best combination of predictor variables for both logistic regression and GWLR (n = 1004). Open forest expansion was more likely in lower elevation areas with less tree cover and higher solar radiation (). Random forest classification models suggest that mean SWE is also an important variable driving open forest expansion (). Soil characteristics did not appear to influence open forest expansion (n = 42, p > 0.10). However, when just analyzing Engelmann spruce (Logistic regression, n = 42), there was a significant effect of soil bulk density (range = 0.11–0.87g cm−3, b = 297.32, p = 0.03), with spruce colonizing areas with higher bulk density.
Figure 4. Predicted probabilities of transitions to tundra (> 3550m), shrub (< 3760m), and open forest (< 3600m) from 1972 to 2008. A 0.1 means there is a 10% chance of that point changing to the vegetation type of the map. Note the different ranges of probabilities. Values are calculated using the intercept and slope coefficients from the best-fit logistic regression model for each (). Blue areas are lakes
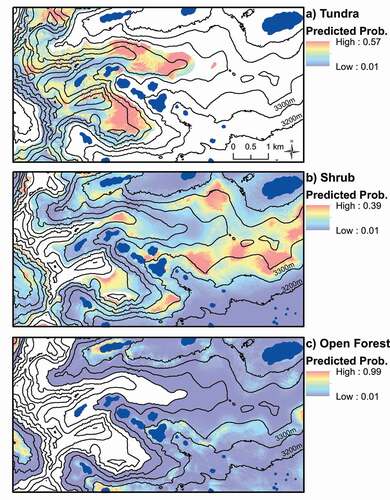
Shrub expansion was best predicted in logistic regression by a combination of shrub cover (range = 0–12%, b = 0.48, p = 3.62e-05), elevation (range = 3121-3760m, b = 0.02, p = 7.13e-05), solar radiation (range = 8–28 WH m−2, b = 0.14, p = 0.0614), and SWE trend (range = −0.13–0.02 m yr−1, b = 12.51, p = 0.1578) predictor variables (Logistic Regression, n = 1305, ). Shrub expansion was more likely in higher elevation areas with greater shrub cover, greater solar radiation, and increasing snowpack (). In GWLR and RFC models, mean SWE replaced solar radiation as an important predictor variable and slope was also an important variable in GWLR (). There were no significant effects of any of the soil variables (Logistic regression, n = 48, p > 0.05).
For tundra expansion (n = 215), the best-fit model included SWE CV (range = 0.25–2.59, b = 1.36, p = 0.00142), solar radiation (range = 8 – 28 WH m−2, b = −0.22, p = 0.01003), and slope (range = 1 – 65°, b = −0.07, p = 0.01648) predictor variables for both logistic regression and GWLR (). Tundra expansion was more likely in areas with greater interannual variation in snowpack, lower solar radiation, and flatter slopes (). Tundra cover and elevation replaced solar radiation and slope as important predictors in the RFC model (). There were no significant effects of any of the soil variables (Logistic regression, n = 36, p > 0.05).
Discussion
Over the past four decades, we observed changes in the distributions of several plant communities in conjunction with a directional increase in summer warming. Unlike early climate change predictions for the alpine tundra and treeline (IPCC Citation1990), we did not observe directional shifts in vegetation moving upslope, with the exception of shrubs. Consistent with other studies, our data suggest an upward expansion of shrubs into tundra vegetation. While tundra vegetation and open forests did not increase their maximum elevations, their distributions within the elevation range shifted uphill, as evidenced by increases in the 95th percentile of their elevation range. We observed vegetation-specific responses to suites of topographic, snowpack, and edaphic factors. These results suggest that in mountain ecosystems it is crucial to examine fine-scale factors to make accurate predictions about changes in species distributions.
Elevation expansion or contraction
Given that other studies have found uphill responses of vegetation to warming, and that plants are expected to track changing climates, we hypothesized that all vegetation types would show directional uphill shifts. Our results partially support this hypothesis, with all vegetation types increasing at the 95th percentile. Interestingly, shrubs were the only one of the three vegetation types to experience a true range expansion (uphill shift in its maximum elevation). While tundra plants and trees are establishing in areas in which they were formerly not present (), this is occurring at the upper end of, but not beyond, their 1972 elevation range, and can thus be considered infilling.
The lack of tree colonization into higher elevation tundra could be due to low winter temperatures, which have not increased over time (McGuire et al. Citation2012), high wind speeds, ice abrasion, or low soil moisture (Hadley and Smith Citation1986; Harsch et al. Citation2009; Holtmeier and Broll Citation2010; Moyes et al. Citation2013; Norton and Schoenberger Citation1984). In addition to these abiotic factors, biotic factors such as herbivory, granivory, and lack of seed production and dispersal can also inhibit treeline shifts (Brown and Vellend Citation2014; Herrero et al. Citation2012; Kroiss and HilleRisLambers Citation2015). Seed trap data from treeline at our site showed no seed rain into the tundra from treeline (Robert Andrus, personal communication). Our results are consistent with the 41 of 50 other alpine krummholz treelines that have not shifted uphill over time (Harsch et al. Citation2009).
The lack of tundra colonization into higher elevation barren soil could be due to the late melting of snow, poor soil development, nutrient limitation, or lack of microbial mutualists, and testing the effects of these factors on plant growth beyond their range is an important avenue for future research (Chapin et al. Citation1994; Darcy et al. Citation2018). The barren soils we collected had high bulk density and low water content, suggesting poor development and water holding capacity. The effects of nutrient limitation on alpine plant range expansion depend on site characteristics such as climate and age. Recent studies in the high alpine of Perú and Alaska suggest that plant colonization is limited by phosphorus, likely due to low weathering rates (Darcy et al. Citation2018). Sites with greater weathering rates and phosphorus availability could be limited by nitrogen (Raffl et al. Citation2006), while other sites with developed soils may not be limited by nutrients. Since phosphorus levels and microbial enzyme activity in unvegetated and sparsely vegetated soils at our site are similar to those reported in Perú and Alaska, plants at our site could also be limited by phosphorus in some areas (Bueno de Mesquita et al. Citation2017; King, Meyer, and Schmidt Citation2008). We have fertilization experiments in place to test this hypothesis.
Topography, SWE, and soil
We hypothesized that all vegetation types would benefit from the same advantageous topographic, soil, and snowpack conditions. On the contrary, trees, shrubs, and tundra plants each had their own suite of predictor variables that predicted their establishment in new areas.
Solar radiation appears to be an important determinant of the distributions of all three vegetation types. There was a positive relationship between radiation and both tree and shrub expansion, which is consistent with greater tree establishment and shrub growth on more sun exposed slopes (Liu et al. Citation2015; Stueve et al. Citation2011). This suggests that higher energy inputs from the sun and the resulting warmer microclimate are important factors for woody plant establishment and growth in the tundra. Solar radiation was also included in the best fit model for tundra expansion, but the direction of the relationship was negative. One potential explanation of this trend is that plant colonization in higher elevation areas beyond intact tundra meadows is more limited by soil moisture, and the higher soil water evaporation on sun exposed slopes (Isard Citation1986) is thus detrimental to plant establishment. This is consistent with findings on a glacial chronosequence in Austria, where early vegetation developed faster in shaded areas (Raffl et al. Citation2006).
For trees, negative relationships with both tree cover and elevation suggest that establishment was likely to occur in the lower part of their elevational range in this study, but where open meadows (lower tree cover) were present. This trend of infilling over a period of time with warming summers and increases in precipitation is consistent with trends in Yellowstone National Park (Jakubos and Romme Citation1993). The increases in winter precipitation at our site could be particularly important, as winter snowpacks are important for insulating tree seedlings over winter (Holtmeier Citation2009). We expected soil moisture to be beneficial for tree establishment, as low soil moisture has been shown to increase seedling mortality in subalpine fir (Cui and Smith Citation1991), Engelmann spruce (Hessl and Baker Citation1997), and limber pine (Moyes, Germino, and Kueppers Citation2015), in both lower and upper subalpine forests (Moyes et al. Citation2013). The lack of a relationship is likely due to limitations of our single time point measurement, which does not reflect the water stress that may become more apparent later in the growing season after our sampling. No relationship with SWE variables is in contrast to the suggestion by Franklin et al. (Citation1971) that the snow free period affects tree establishment in subalpine meadows, but is in line with the recent findings of Bader et al. (Citation2018), who found that early snowmelt by two weeks had minimum effects on tree seedling establishment. No effect of soil depth is consistent with other studies (Butler, Malanson, and Resler Citation2004) and suggests that these trees are able to colonize areas with shallow soil. We found that Engelmann spruce was more likely to colonize areas with higher soil bulk density. This is surprising, given that lower soil bulk density typically is associated with less soil moisture and organic matter and more sand, but may be explained by less competition with tundra plants. Other studies have reported conifer growth on thin, rocky soils as opposed to deeper, finer soils where a thick mat of herbs can inhibit tree establishment (Malanson and Butler Citation2013; Peet Citation1988). Another explanation is that the coarser soils facilitated seed trapping and moisture retention around seeds, which facilitated the establishment of subalpine fir in a glacial chronosequence (Jumpponen et al. Citation1999). Interestingly, we found no relationship between bulk density and subalpine fir establishment, but our results combined with those of Jumpponen et al. (Citation1999) suggest that coarse soils can be beneficial for both of these treeline species.
For shrubs, positive relationships with both shrub cover and elevation highlight their establishment at higher elevations and where there were shrubs to provide propagules. Importantly, we also report a positive relationship between shrub expansion and the trend in SWE. While other studies have reported shrub expansion, to our knowledge this is the first study to connect this expansion to a detailed snowpack dataset at the landscape scale. Areas with increasing snowpack over time appear to be beneficial for shrub establishment, likely because snowpack can insulate soil (Brooks, Williams, and Schmidt Citation1996; Myers-Smith and Hik Citation2013), and protect shoots from winter damage (Myers-Smith et al. Citation2011; Tape, Sturm, and Racine Citation2006), which has been shown to increase shrub survival (Formica et al. Citation2014). This result indicates that shrub expansion should be most rapid in areas undergoing simultaneous increases in temperature and snowfall, both of which are occurring at our site (Formica et al. Citation2014). Furthermore, the rates of N deposition at our site also likely promote shrub growth (Formica et al. Citation2014), and shrubs also likely started to increase following the cessation of grazing in 1949 (Bowman and Seastedt Citation2001). The lack of a significant relationship with slope suggests that shrubs are colonizing areas of tundra with both steep and flat slopes, as has been seen in other studies (Tremblay, Lévesque, and Boudreau Citation2012). Slope was not correlated with SWE in our dataset.
Tundra was more likely to expand on flatter slopes and in areas with greater interannual variation in snowpack. Many of the higher elevation sites in our study landscape are steeper than the main stretch of intact tundra on Niwot Ridge, which creates an unstable landscape with frequent rock slides and snow avalanches that can inhibit establishment (Walker et al. Citation1996). Our results show that there are areas of shallower slopes at these elevations that are more conducive to plant establishment. The relationship with greater variability in snowpack suggests that plant establishment over time benefits from a combination of years with deep snowpack and years with shallow snowpack. Germinating seeds, for example, may benefit from higher growing season moisture content (Sayers and Ward Citation1966) provided by later melting snow, while seedlings with established root networks may benefit from earlier melting snow and longer growing seasons by increasing their cover and reproductive output (Galen and Stanton Citation1993; Kudo Citation1991; Totland Citation1997). While we did not measure or include this in our analyses, the presence of larger rocks (> 20 cm diameter) can also create microhabitats suitable for plant establishment in these environments (Jumpponen et al. Citation1999).
Conclusion
We find that changes in vegetation distribution with time are affected by fine-scale variation, which suggests that fine-scale factors are important in mediating vegetation change in mountainous areas. In particular, the increase in cover and range expansion of shrubs was substantial and should be expected in areas experiencing both increases in temperature and precipitation. Although no one suite of variables was beneficial for all three vegetation types, the factors important for each specific vegetation type are likely to be important in other mountainous regions, but this warrants further study. The lack of a unified response across vegetation types demonstrates how environmental change can lead to a broader reorganization of vegetation. Contrary to our original predictions of similar advantageous microclimates for alpine plants, shrubs, and trees, our data show that each of these vegetation types establishes in different microhabitats as climate changes. One interesting contrast among the vegetation types is that woody species (both trees and shrubs) appear to perform better in warmer, higher energy microclimates (high solar radiation), while flat and cool microclimates are important for herbaceous species moving into unvegetated areas. This result may reflect differences among vegetation types in limitations by energy versus moisture. A key conclusion from our results is some form of heterogeneity matters for all vegetation types, but the importance of topography, versus soil, versus snow depends on type of vegetation. While we only presented findings from one site, our work supports the idea that some plant species may only need to migrate tens of meters to track climate instead of hundreds of meters uphill or hundreds of kilometers poleward (Ford et al. Citation2013). It is important to note, though, that our results pertain only to a limited number of plant species that we surveyed (i.e., 3 tree species, 1 shrub species, and alpine plant communities). There are certainly many other plant species in our landscape that have not expanded their range and could be experiencing range contractions (Pauli et al. Citation2007). Local models incorporating topographic heterogeneity lead to drastically different extinction predictions than continent-scale models (Randin et al. Citation2009). Important future research about the role of fine-scale heterogeneity in distribution modeling should address whether habitat loss has been overpredicted (Austin and van Niel Citation2011; Barrows and Murphy-Mariscal Citation2012; Luoto and Heikkinen Citation2008; Randin et al. Citation2009) or underpredicted (Trivedi et al. Citation2008). In any case, incorporating finer scale data will be crucial in shaping local biodiversity conservation planning and management in the face of climate change.
Acknowledgments
Logistical support was provided by the Niwot Ridge LTER program and the CU Mountain Research Station. We thank Dr. William D. Bowman and Dr. Jane G. Smith for helpful suggestions about our fieldwork, and Dr. Lauren M. Hallett for suggestions on the article.
Additional information
Funding
Related Research Data
References
- Ackerly, D. D., S. R. Loarie, W. K. Cornwell, S. B. Weiss, H. Hamilton, R. Branciforte, and N. J. B. Kraft. 2010. The geography of climate change: Implications for conservation biogeography. Diversity and Distributions 16:1–16.
- Aina, P. O., and S. P. Periaswamy. 1985. Estimating available water-holding capacity of western Nigerian soils from soil texture and bulk density, using core and sieved samples. Soil Science 140:55–58.
- Alexander, R. R., and C. B. Edminster, 1983: Engelmann spruce seed dispersal in the central Rocky Mountains. Research Note RM-424, USDA Forest Service, Rocky Mountain Forest and Range Experiment Station.
- Ashcroft, M. B., L. A. Chisholm, and K. O. French. 2008. The effect of exposure on landscape scale soil surface temperatures and species distribution models. Landscape Ecology 23:211–25.
- Ashcroft, M. B., L. A. Chisholm, and K. O. French. 2009. Climate change at the landscape scale: Predicting fine-grained spatial heterogeneity in warming and potential refugia for vegetation. Global Change Biology 15:656–67.
- Ashcroft, M. B., and J. R. Gollan. 2012. Fine-resolution (25 m) topoclimatic grids of near-surface (5 cm) extreme temperatures and humidities across various habitats in a large (200 x 300 km) and diverse region. International Journal of Climatology 32:2134–2148.
- Austin, M. P., and K. P. van Niel. 2011. Impact of landscape predictors on climate change modelling of species distributions: A case study with Eucalyptus fastigata in southern New South Wales, Australia. Journal of Biogeography 38:9–19.
- Bader, M. Y., H. Loranger, G. Zotz, and G. Mendieta-Leiva. 2018. Responses of tree seedlings near the alpine treeline to delayed snowmelt and reduced sky exposure. Forests 9:12. doi:https://doi.org/10.3390/f9010012.
- Bader, M. Y., and J. J. A. Ruitjen. 2008. A topography-based model of forest cover at the alpine tree line in the tropical Andes. Journal of Biogeography 35:711–23.
- Barrows, C. W., and M. L. Murphy-Mariscal. 2012. Modeling impacts of climate change on Joshua trees at their southern boundary: How scale impacts predictions. Biological Conservation 152:29–36.
- Beckage, B., B. Osborne, D. G. Gavin, C. Pucko, T. Siccama, and T. Perkins. 2008. A rapid upward shift of a forest ecotone during 40 years of warming in the Green Mountains of Vermont. PNAS 105 (11):4197–4202. doi:https://doi.org/10.1073/pnas.0708921105
- Bennie, J., M. O. Hill, R. Baxter, and B. Huntley. 2006. Influence of slope and aspect on long-term vegetation change in British chalk grasslands. Journal of Ecology 94:355–68.
- Bourgeron, P. S., H. C. Humphries, D. Liptzin, and T. R. Seastedt. 2015. The forest-alpine ecotone: A multi-scale approach to spatial and temporal dynamics of treeline change at Niwot Ridge. Plant Ecology and Diversity 8 (5–6):763–79. doi:https://doi.org/10.1080/17550874.2015.1126368.
- Bowman, W. D., and T. R. Seastedt (eds.). 2001. Structure and function of an alpine ecosystem: Niwot Ridge Colorado, 337. Oxford: Oxford University Press.
- Brooks, P. D., M. W. Williams, and S. K. Schmidt. 1996. Microbial activity under alpine snowpacks, Niwot Ridge, Colorado. Biogeochemistry 32:93–113.
- Brown, C. D., and M. Vellend. 2014. Non-climatic constraints on upper elevational plant range expansion under climate change. Proceedings of the Royal Society of London B 281:20141779. doi:https://doi.org/10.1098/rspb.2014.1779.
- Bruun, H. H., J. Moen, R. Virtanen, J. Grytnes, L. Oksanen, and A. Angerbjörn. 2006. Effects of altitude and topography on species richness of vascular plants, bryophytes, and lichens in alpine communities. Journal of Vegetation Science 17 (1):37–46.
- Buechling, A., P. H. Martin, C. D. Canham, W. D. Shepperd, and M. A. Battaglia. 2016. Climate drivers of seed production in Picea engelmanni and response to warming temperatures in the southern Rocky Mountains. Journal of Ecology 104:1051–62. doi:https://doi.org/10.1111/1365-2745.12572.
- Bueno de Mesquita, C. P., J. E. Knelman, A. J. King, E. C. Farrer, D. L. Porazinska, S. K. Schmidt, and K. N. Suding. 2017. Plant colonization of moss-dominated soils in the alpine: Microbial and biogeochemical implications. Soil Biology and Biochemistry 111:135–42. doi:https://doi.org/10.1016/j.soilbio.2017.04.008.
- Butler, D. R., G. P. Malanson, and L. M. Resler. 2004. Turf-banked terrace treads and rises, turf exfoliation and possible relationships with advancing treeline. Catena 58:259–74.
- Caine, N. 2010. Recent hydrologic change in a Colorado alpine basin: An indicator of permafrost thaw? Annals of Glaciology 51:130–34.
- Chapin, F. S., L. R. Walker, C. L. Fastie, and L. C. Sharman. 1994. Mechanisms of primary succession following deglaciation at Glacier Bay, Alaska. Ecological Monographs 64 (2):149–75.
- Chaudhari, P. R., D. V. Ahire, V. D. Ahire, M. Chkravarty, and S. Maity. 2013. Soil bulk density as related to soil texture, organic matter content, and available total nutrients of Coimbatore soil. International Journal of Scientific and Research Publications 3 (2):1–8.
- Crimmins, S. M., S. Z. Dobrowski, J. A. Greenberg, J. T. Abatzoglou, and A. R. Mynsberge. 2011. Changes in climatic water balance drive downhill shifts in plant species’ optimum elevations. Science 331:324–27.
- Cui, M., and W. K. Smith. 1991. Photosynthesis, water relations and mortality in Abies lasiocarpa seedling during natural establishment. Tree Physiology 8:37–46.
- Daly, C., and D. Shankman. 1985. Seedling establishment by conifers above tree limit on Niwot Ridge, Front Range, Colorado, U.S.A. Arctic, Antarctic, and Alpine Research 17:389–400.
- Daly, C., J. W. Smith, J. I. Smith, and R. B. McKane. 2007. High-resolution spatial modeling of daily weather elements for a catchment in the Oregon Cascade Mountains, United States. Journal of Applied Meteorology and Climatology 46:1565–86.
- Danby, R. K., and D. S. Hik. 2007. Variability, contingency, and rapid change in recent subarctic alpine tree line dynamics. Journal of Ecology 95:352–63. doi:https://doi.org/10.1111/j/1365-2745.2006.01200.x.
- Darcy, J. L., S. K. Schmidt, J. E. Knelman, C. C. Cleveland, S. C. Castle, and D. R. Nemergut. 2018. Phosphorus, not nitrogen, limits plants and microbial primary producers following glacial retreat. Science Advances 4 (5):eaaq0942. doi:https://doi.org/10.1126/sciadv.aaq0942
- De Frenne, P., F. Rodríguez-Sánchez, D. A. Coomes, L. Baeten, G. Verstraeten, M. Vellend, M. Bernhardt-Römermann, C. D. Brown, J. Brunet, J. Cornelis, et al., 2013: Microclimate moderates plant responses to macroclimate warming. Proceedings of the National Academy of Sciences of the United States of America, 110: 18561–65.
- Dearborn, K. D., and R. K. Danby. 2017. Aspect and slope influence plant community composition more than elevation across forest-tundra ecotones in subarctic Canada. Journal of Vegetation Science 28 (3):595–604. doi:https://doi.org/10.1111/jvs.12521.
- Dial, R. J., E. E. Berg, K. Timm, A. McMahon, and J. Geck. 2007. Changes in the alpine forest-tundra ecotone commensurate with recent warming in southcentral Alaska: Evidence from orthophotos and field plots. Journal of Geophysical Research 112:G04015. doi:https://doi.org/10.1029/2007JG000453.
- Dubayah, R. C. 1994. Modeling a solar radiation topoclimatology for the Rio Grande River Basin. Journal of Vegetation Science 5:627–40.
- Dullinger, S., T. Dirnböck, and G. Grabherr. 2013. Shrub invasion into high mountain grasslands of the Northern Calcareous Alps, Austria. Arctic, Antarctic, and Alpine Research 35:434–41.
- Dullinger, S., T. Dirnböck, J. Greimler, and G. Grabherr. 2003. A resampling approach for evaluating effects of pasture abandonment on subalpine plant species diversity. Journal of Vegetation Science 14 (2):243–52.
- Elmendorf, S. C., G. H. R. Henry, R. D. Hollister, R. G. Björk, N. Boulanger-Lapointe, E. J. Cooper, J. H. C. Cornelissen, T. A. Day, E. Dorrepaal, T. G. Elumeeva, et al. 2012. Plot-scale evidence of tundra vegetation change and links to recent summer warming. Nature Climate Change 2:453–57.
- Elsen, P. R., and M. W. Tingley. 2015. Global mountain topography and the fate of montane species under climate change. Nature Climate Change. doi:https://doi.org/10.1038/NCLIMATE2656.
- Engler, R., C. F. Randin, W. Thuiller, S. Dullinger, N. E. Zimmermann, M. B. Araújo, P. B. Pearman, G. Le Lay, C. Piedallu, C. H. Albert, et al. 2011. 21st century climate change threatens mountain flora unequally across Europe. Global Change Biology 17:2330–41.
- ESRI. 2015. ArcGIS Desktop. Release 10.2.2. Redlands, CA, USA: Environmental Systems Research Institute.
- Ford, K. R., A. K. Ettinger, J. D. Lundquist, M. S. Raleigh, and J. Hille Ris Lambers. 2013. Spatial heterogeneity in ecologically important climate variables at coarse and fine scales in a high-snow mountain landscape. PLoS ONE 8:e65008.
- Formica, A., E. C. Farrer, I. W. Ashton, and K. N. Suding. 2014. Shrub expansion over the past 62 years in Rocky Mountain alpine tundra: Possible causes and consequences. Arctic, Antarctic, and Alpine Research 46:616–31.
- Franklin, J. F., W. H. Moir, G. W. Douglas, and C. Wiberg. 1971. Invasion of subalpine meadows by trees in the Cascade Range, Washington and Oregon. Arctic and Alpine Research 3 (3):215–24.
- Fridley, J. D. 2009. Downscaling climate over complex terrain: High finescale < spatial variation of near-ground temperatures in a montane forested landscape Great Smoky Mountains. Journal of Applied Meteorology and Climatology 48:1033–49.
- Galen, C., and M. L. Stanton. 1993. Short-term responses of alpine buttercups to experimental manipulations of growing season length. Ecology 74:1052–58.
- Galloway, J. N., A. R. Townsend, J. W. Erisman, M. Bekunda, Z. Cai, J. R. Freney, L. A. Martinelli, S. P. Seitzinger, and M. A. Sutton. 2008. Transformation of the nitrogen cycle: Recent trends, questions, and potential solutions. Science 320:889–92. doi:https://doi.org/10.1126/science.1136674.
- Geiger, R., R. H. Aron, and P. Todhunter. 2012. The climate near the ground, 528. 5th ed. Lanham: Rowman and Littlefield Publishers.
- Gollini, I., B. Lu, M. Charlton, C. Brunsdon, and P. Harris. 2015. GWmodel: An R package for exploring spatial heterogeneity using geographically weighted models. Journal of Statistical Software 63 (17):1–50.
- Grabherr, G., M. Gottfried, and H. Pauli. 2010. Climate change impacts in alpine environments. Geography Compass 4:1133–1153.
- Grafius, D. R., G. P. Malanson, and D. Weiss. 2013. Secondary controls of alpine treeline elevations in the western USA. Physical Geography 33 (2):146–64.
- Hadley, J. L., and W. K. Smith. 1986. Wind effects on needles of timberline conifers – Seasonal influence on mortality. Ecology 67:12–19.
- Hallinger, M., M. Manthey, and M. Wilmking. 2010. Establishing a missing link: Warm summers and winter snow cover promote shrub expansion into alpine tundra in Scandinavia. New Phytologist 186:890–99.
- Harsch, M. A., P. E. Hulme, M. S. McGlone, and R. P. Duncan. 2009. Are treelines advancing? A global meta-analysis of treeline response to climate warming. Ecology Letters 12:1040–49.
- Herrero, A., R. Zamora, J. Castro, and J. A. Hódar. 2012. Limits of pine forest distribution at the treeline: Herbivory matters. Plant Ecology 213 (3):459–69.
- Hessl, A. E., and W. L. Baker. 1997. Spruce and fir regeneration and climate in the forest-tundra ecotone of Rocky Mountain National Park, Colorado, U.S.A. Arctic, Antarctic, and Alpine Research 29:173–83.
- HilleRisLambers, J., M. A. Harsch, A. K. Ettinger, K. R. Ford, and E. J. Theobald. 2013. How will biotic interactions influence climate change-induced range shifts? Annals of the New York Academy of Sciences 1297:112–25. doi:https://doi.org/10.1111/nyas.12182.
- Holtmeier, F. 2009. Mountain timberlines: Ecology patchiness, and dynamics, 436. New York: Springer Publishing.
- Holtmeier, F., and G. Broll. 2010. Wind as an ecological agent at treelines in North America, the Alps, and the European Subarctic. Physical Geography 31:203–33.
- IPCC. 1990. Climate change: The IPCC impacts assessment. Report prepared for intergovernmental panel on climate change by working group II, eds. W. J. M. Tegart, G. W. Sheldon, and D. C. Griffiths, 294. Canberra: Australian Government Publishing Service.
- IPCC. 2014. Climate Change 2014: Synthesis report. Contribution of working groups I, II and III to the fifth assessment report of the intergovernmental panel on climate change, eds. R. K. Pachauri, and L. A. Meyer, 169. Geneva: IPCC.
- Isard, S. A. 1986. Factors influencing soil moisture and plant community distribution on Niwot Ridge, Front Range, Colorado, U.S.A. Arctic, Antarctic, and Alpine Research 18:83–96.
- Jakubos, B., and W. H. Romme. 1993. Invasion of subalpine meadows by lodgepole pine in Yellowstone National Park, Wyoming, U.S.A. Arctic and Alpine Research 25 (4):382–90.
- Jepsen, S. M., N. P. Molotch, M. W. Williams, K. E. Rittger, and J. O. Sickman. 2012. Interannual variability of snowmelt in the Sierra Nevada and Rocky Mountains, United States: Examples from two alpine watersheds. Water Resources Research 48:W0259. doi:https://doi.org/10.1029/2011WR011006.
- Jump, A. S., and F. I. Woodward. 2003. Seed production and population density decline approaching the range-edge of Cirsium species. New Phytologist 160:349–58.
- Jumpponen, A., H. Väre, K. G. Mattson, R. Ohtonen, and J. M. Trappe. 1999. Characterization of ‘safe sites’ for pioneers in primary succession on recently deglaciated terrain. Journal of Ecology 87:98–105.
- King, A. J., A. F. Meyer, and S. K. Schmidt. 2008. High levels of microbial biomass and activity in unvegetated tropical and temperate alpine soils. Soil Biology and Biochemistry 40:2605–10.
- Kirdyanov, A., M. Hughes, E. Vaganov, F. Schweingruber, and P. Silkin. 2003. The importance of early summer temperature and date of snow melt for tree growth in the Siberian Subarctic. Trees 17:61–69.
- Kittel, T. G. F., P. E. Thornton, J. A. Royle, and T. N. Chase. 2002. Climates of the Rocky Mountains: Historical and future patterns. In Rocky Mountain futures: An ecological perspective, ed. J. S. Baron, 59–82, 325. Covelo, CA: Island Press.
- Kittel, T. G. F., M. W. Williams, K. Chowanski, M. Hartman, T. Ackerman, M. Losleben, and P. D. Blanken. 2015. Contrasting long-term alpine and subalpine precipitation trends in a North American mid-latitude mountain system, Colorado Front Range, USA. Plant Ecology and Diversity 8 (5–6):607–24. doi:https://doi.org/10.1080/17550874.2016.1143536.
- Körner, C. 2013. Alpine plant life: Functional plant ecology of high mountain ecosystems, 343. 4th ed. berlin: springer.
- Kroiss, S. J., and J. HilleRisLambers. 2015. Recruitment limitation of long-lived conifers: Implications for climate change responses. Ecology 96 (5):1286–97.
- Kudo, G. 1991. Effect of snow-free period on the phenology of alpine plants inhabiting snow patches. Arctic and Alpine Research 23:436–43.
- Kudo, G., U. Nordenhall, and U. Molau. 1999. Effects of snowmelt timing on leaf traits, leaf production, and shoot growth of alpine plants: Comparisons along a snowmelt gradient in northern Sweden. Ecoscience 6:439–50.
- Lenoir, J., J. Gegout, P. Marquet, P. De Ruffray, and H. Brisse. 2008. A significant upward shift in plant species optimum elevation during the 20th century. Science 320:1768–71.
- Liaw, A., and M. Wiener. 2002. Classification and Regression by randomForest. R News 2 (3):18–22.
- Liu, Z., R. Chen, Y. Song, and C. Han. 2015. Distribution and estimation of aboveground biomass of alpine shrubs along an altitudinal gradient in a small watershed of the Qilian Mountains, China. Journal of Mountain Science 12:961–71.
- Loneragan, W. A., and R. del Moral. 1984. The influence of microrelief on community structure of subalpine meadows. Bulletin of the Torrey Botanical Club 111 (2):209–16.
- Lookingbill, T. R., and D. L. Urban. 2003. Spatial estimation of air temperature differences for landscape-scale studies in montane environments. Agricultural and Forest Meteorology 114:141–51.
- Luoto, M., and R. K. Heikkinen. 2008. Disregarding topographical heterogeneity biases species turnover assessments based on bioclimatic models. Global Change Biology 14:483–94.
- MacLean, I. M. D., A. J. Suggitt, R. J. Wilson, J. P. Duffy, and J. J. Bennie. 2016. Fine-scale climate change: Modelling spatial variation in biologically meaningful rates of warming. Global Change Biology 23:256–68. doi:https://doi.org/10.1111/gcb.13343.
- Malanson, G. P., L. E. Bengtson, and D. B. Fagre. 2012. Geomorphic determinants of species composition of alpine tundra, Glacier National Park, U.S.A. Arctic, Antarctic, and Alpine Research 44 (2):197–209. doi:https://doi.org/10.1657/1938-4246-44.2.197.
- Malanson, G. P., and D. R. Butler. 2013. Tree-tundra competitive hierarchies, soil fertility gradients, and treeline elevation in Glacier National Park, Montana. Physical Geography 15:166–80.
- McGuire, C. R., C. R. Nufio, M. D. Bowers, and R. P. Guralnick. 2012. Elevation-dependent temperature trends in the Rocky Mountain Front Range: Changes over a 56-and 20-year record. PLoS ONE 7:e44370. doi:https://doi.org/10.1371/journal.pone0044370.
- McKenzie, D., D. W. Peterson, D. L. Peterson, and P. E. Thornton. 2003. Climatic and biophysical controls on conifer species distributions in mountain forests of Washington State, USA. Journal of Biogeography 30:1093–108.
- McLeod, A. I., and C. Xu, 2014. Bestglm: Best subset GLM. R package version 0.34. http://CRAN.R-project.org/package=bestglm.
- Moyes, A. B., C. Castanha, M. J. Germino, and L. M. Kueppers. 2013. Warming and the dependence of limber pine (Pinus flexilis) establishment on summer soil moisture within and above its current elevation range. Oecologia 171:271–82.
- Moyes, A. B., M. J. Germino, and L. M. Kueppers. 2015. Moisture rivals temperature in limiting photosynthesis by trees establishing beyond their cold-edge limit under ambient and warmed conditions. New Phytologist 207:1005–14.
- Myers-Smith, I. H., B. C. Forbes, M. Wilmking, M. Hallinger, T. Lantz, D. Blok, K. D. Tape, M. Macias-Fauria, U. Sass-Klaassen, E. Lévesque, et al. 2011. Shrub expansion in tundra ecosystems: Dynamics, impacts and research priorities. Environmental Research Letters 6:045509. doi:https://doi.org/10.1088/1748-9326/6/4/045509.
- Myers-Smith, I. H., and D. S. Hik. 2013. Shrub canopies influence soil temperatures but not nutrient dynamics: An experimental test of tundra snow-shrub interactions. Ecology and Evolution 3:3683–700.
- Noble, D. L., and F. Ronco Jr. 1978. Seedfall and establishment of Engelmann Spruce and Subalpine Fir in clearcut openings in Colorado. Research Paper RM-200. Rocky Mountain Forest and Range Experimental Station. Forest Service, U.S. Department of Agriculture.
- Norton, D. A., and W. Schoenberger. 1984. The growth forms and ecology of Nothofagus solandri at the alpine timberline, Craigieburn Range, New Zealand. Arctic, Antarctic, and Alpine Research 16:361–70.
- Parmesan, C., and G. Yohe. 2003. A globally coherent fingerprint of climate change impacts across natural systems. Nature 421:37–42.
- Parolo, G., and G. Rossi. 2008. Upward migration of vascular plants following a climate warming trend in the Alps. Basic and Applied Ecology 9:100–07.
- Pauli, H., M. Gottfried, K. Reiter, C. Klettner, and G. Grabherr. 2007. Signals of range expansions and contractions of vascular plants in the high Alps: Observations (1994-2004) at the GLORIA master site Schrankogel, Tyrol, Austria. Global Change Biology 13:147–56. doi:https://doi.org/10.1111/j.1365-2486.2006.01282.x.
- Peet, R. K. 1978. Latitudinal variation in southern Rocky Mountain forests. Journal of Biogeography 5:275–89.
- Peet, R. K. 1988. Forests of the Rocky Mountains. In North American terrestrial vegetation, eds. M. G. Barbour, and W. D. Billings, 63–101. Cambridge: Cambridge University Press.
- Peñuelas, J., and M. Boada. 2003. A global change-induced biome shift in the Montseny mountains (NE Spain). Global Change Biology 9:131–40.
- Pockley, P. 2001. Climate change transforms island ecosystem. Nature 410:616–616.
- Preston, D. R., N. Caine, D. M. McKnight, M. W. Williams, K. Hell, M. P. Miller, S. J. Hart, and P. T. J. Johnson. 2016. Climate regulates alpine lake ice cover phenology and aquatic ecosystem structure. Geophysical Research Letters 43. doi:https://doi.org/10.1002/2016/GL069036.
- QGIS Development Team, 2015: QGIS geographic information system. Open Source Geospatial Foundation Project. http://qgis.osgeo.org.
- R Core Team. 2017. R: A language and environment for statistical computing. Vienna, Austria: R Foundation for Statistical Computing. http://www.R-project.org/.
- Raffl, C., M. Mallaun, R. Mayer, and B. Erschbamer. 2006. Vegetation succession pattern and diversity changes in a glacier valley, Central Alps, Austria. Arctic, Antarctic, and Alpine Research 38 (3):421–28.
- Randin, C. F., R. Engler, S. Normand, M. Zappa, N. E. Zimmermann, P. B. Pearman, P. Vittoz, W. Thuiller, and A. Guisan. 2009. Climate change and plant distribution: Local models predict high-elevation persistence. Global Change Biology 15:1557–69.
- Rose, J. P., and G. P. Malanson. 2012. Microtopographic heterogeneity constrains alpine plant diversity, Glacier National Park, MT. Plant Ecology 231 (6):955–65. doi:https://doi.org/10.1007/s11258-012-0056-y.
- Sayers, R. L., and R. T. Ward. 1966. Germination responses in alpine species. Botanical Gazette 127:11–16.
- Scherrer, D., and C. Körner. 2010. Infra-red thermometry of alpine landscapes challenges climatic warming projections. Global Change Biology 16:2602–13.
- Scherrer, D., and C. Körner. 2011. Topographically controlled thermal-habitat differentiation buffers alpine plant diversity against climate warming. Journal of Biogeography 38:406–16.
- Simkin, S. M., E. B. Allen, W. D. Bowman, C. M. Clark, J. Belnap, M. L. Brooks, B. S. Cade, S. L. Collins, L. H. Geiser, F. S. Gilliam, et al., 2016: Conditional vulnerability of plant diversity to atmospheric nitrogen deposition across the USA. Proceedings of the National Academy of Sciences of the United States of America, 113: 4086–91.
- Stueve, K. M., R. E. Isaacs, L. E. Tyrrell, and R. V. Densmore. 2011. Spatial variability of biotic and abiotic tree establishment constraints across a treeline ecotone in the Alaska Range. Journal of Ecology 92:496–506.
- Sturm, M., C. Racine, and K. D. Tape. 2001. Climate change: Increasing shrub abundance in the Arctic. Nature 411:546–47.
- Suding, K. N., E. C. Farrer, A. J. King, L. Kueppers, and M. J. Spasojevic. 2015. Vegetation change at high elevation: Scale dependence and interactive effects on Niwot Ridge. Plant Ecology and Diversity. doi:https://doi.org/10.1080/17550874.2015.1010189.
- Tape, K. D., M. Sturm, and C. Racine. 2006. The evidence for shrub expansion in Northern Alaska and the Pan-Arctic. Global Change Biology 12:686–702.
- Theobald, E. I., I. Breckheimer, and J. HilleRisLambers. 2017. Climate drives phenological reassembly of a mountain wildflower meadow community. Ecology 98 (11):2799–812. doi:https://doi.org/10.1002/ecy.1996.
- Tinner, W., and J.-P. Theurillat. 2003. Uppermost limit, extent, and fluctuations of the timberline and treeline ecocline in the Swiss Central Alps during the past 11,500 years. Arctic, Antarctic, and Alpine Research 35 (2):158–69. doi:https://doi.org/10.1657/1523-0430(2003)035[0158:ULEAFO]2.0.CO;2.
- Totland, O. 1997. Effects of flowering time and temperature on growth and reproduction in Leontodon autumnalis var. taraxaci, a late-flowering alpine plant. Arctic and Alpine Research 29:285–90.
- Totland, O., and J. M. Alatalo. 2002. Effects of temperature and date of snowmelt on growth, reproduction, and flowering phenology in the arctic/alpine herb, Ranunculus glacialis. Population Ecology 133:168–75.
- Tremblay, B., E. Lévesque, and S. Boudreau. 2012. Recent expansion of erect shrubs in the Low Arctic: Evidence from Eastern Nunavik. Environmental Research Letters 7. doi:https://doi.org/10.1088/1748-9326/7/3/035501.
- Treml, V., and T. Chuman. 2015. Ecotonal dynamics of the altitudinal forest limit are affected by terrain and vegetation structure variables: An example from the Sudetes Mountains of Central Europe. Arctic, Antarctic, and Alpine Research 77 (1):133–46. doi:https://doi.org/10.1657/AAAR0013-108.
- Trivedi, M. R., P. M. Berry, M. D. Morecroft, and T. P. Dawson. 2008. Spatial scale affects bioclimate model projections of climate change impacts on mountain plants. Global Change Biology 14:1089–103.
- Uchytil, R. J. 1992. Salix glauca. In Fire effects information system. U.S. Department of Agriculture, Forest Service, Rocky Mountain Research Station, Fire Sciences Laboratory. http://www.fs.fed.us/database/feis/.
- Vaupel, A., and D. Matthies. 2012. Abundance, reproduction, and seed predation of an alpine plant decrease from the center toward the range limit. Ecology 93 (10):2253–62.
- Vonlanthen, C. M., P. M. Kammer, and W. Eugster. 2006. Alpine plant communities: A statistical assessment of their relation to microclimatological pedological, geomorphological, and other factors. Physical Geography 27 (2):137–54.
- Walker, L. W., D. J. Zarin, N. Fetcher, R. W. Myster, and A. H. Johnson. 1996. Ecosystem development and plant succession on landslides in the Caribbean. Biotropica 28:566–76.
- Walker, M. D., C. H. Wahren, R. D. Hollister, G. H. R. Henry, L. E. Ahlquist, J. H. Alatalo, M. S. Bret-Harte, M. P. Calef, T. V. Callaghan, A. B. Carroll, et al., 2006: Plant community responses to experimental warming across the tundra biome. Proceedings of the National Academy of Sciences of the United States of America, 103: 1342–46.
- Walther, G. 2003. Plants in a warmer world. Perspectives in Plant Ecology, Evolution, and Systematics 6:169–85.
- Walther, G., S. Beißner, and C. A. Burga. 2005. Trends in the upward shift of alpine plants. Journal of Vegetation Science 16:541–48.
- Weiss, D. J., G. P. Malanson, and S. J. Walsh. 2015. Multiscale relationships between alpine treeline elevation and hypothesized environmental controls in the western United States. Annals of the Association of American Geographers 105 (3):437–53. doi:https://doi.org/10.1080/00045608.2015.1015096.
- Zhu, K., C. W. Woodall, and J. S. Clark. 2012. Failure to migrate: lack of tree range expansion in response to climate change. Global Change Biology 18:1042–1052.
Appendix
Table A1. Predictor variables included (noted with an X) in the best models of three different techniques, logistic regression (LR), geographically weighted logistic regression (GWLR), and random forests classification (RFC). Variables for GWLR were forward selected following the procedures of the ‘gwr.model.selection’ function in the GWmodel R package and these were compared to the variables selected in the LR model. Variables for RFC were selected using the mean decrease accuracy metric from the ‘importance’ function in the randomForest R package. The top 3 (open forest and tundra expansion) and 4 (shrub expansion) important variables based on this metric were selected to compare to the LR and GWLR results
Figure A1. The relationship between elevation and percent cover of the three main vegetation types. Curves are from 3rd order (tree, R2 = 0.99), and 4th order (shrub, R2 = 0.84 and tundra, R2 = 0.95) polynomial functions