
ABSTRACT
Cushion plants are a key Arctic, Antarctic, and alpine growth form, with many cushion-forming species strongly affecting community structure in abiotically stressful environments. Despite their ecological importance, there is little information about what drives the distribution of species exhibiting this growth form. This study investigates the determinants of the distribution of a cushion plant species, Euphorbia clavarioides at (1) a fine scale, using field-collected predictors from an alpine landscape; and (2) a broad scale, using distribution records and climate data across the species’ distributional range. At the fine scale, the species was locally rare (occurring in about 4 percent of samples) and may be limited to specific microsites by interspecific competition with taller-growing species. Broad-scale species distribution modeling showed that both temperature and rainfall are important in predicting the distribution of E. clavarioides with a higher probability of occurrence in areas with higher annual precipitation and mean annual temperatures < 15°C. Given the species’ sensitivity to competition and abiotic conditions (high temperatures and low precipitation), E. clavarioides may be vulnerable to environmental changes. Therefore, assuming that other cushion plant species exhibit similar patterns, species of this growth form may be particularly useful indicators of change in alpine, Arctic, and Antarctic areas.
Introduction
The distribution of species, growth forms, biomes, and other biological units reflect their ecology, physiology, and evolutionary history (Rapoport Citation1982). For many plant growth forms, the factors determining their local and global distributions are well known. For example, the distribution of woody species is limited at both fine and broad scales by low temperatures, precipitation extremes, and the occurrence of disturbances (Körner Citation2007; Woodward, Lomas, and Kelly Citation2004). In contrast, annual plants are limited by dense vegetation and require sites where conditions are favorable for germination (Freas and Kemp Citation1983; Maron and Crone Citation2006; Turnbull et al. Citation2004). However, the factors driving the distribution of several other growth forms are still largely undocumented.
Cushion-forming plants are a key alpine, Arctic, and sub-Antarctic growth form (Aubert et al. Citation2014; Körner Citation2003), but the drivers of cushion plant species’ distributions are poorly understood. The cushion growth form is defined by compact, prostrate, herbaceous, perennial plants that form a smooth hemispherical shape (Billings and Mooney Citation1968; Cabrera, Rada, and Cavieres Citation1998; Ramsay Citation1992). Cushion plants strongly modify the local abiotic environment as their dome-shaped growth form and compact canopy slows heat loss and traps organic matter, which results in increased water-holding capacity (Aubert et al. Citation2014; Kleier and Rundel Citation2004; Ralph Citation1978; Ramsay Citation1992; Sklenář Citation2007), further enhancing cushion plants’ buffering of temperatures due to water’s high thermal inertia. Due to the impacts that cushion plants have on the abiotic environment, they often increase the local abundance, richness, and diversity of vascular plant and arthropod species (Badano et al. Citation2006; Barendse and Chown Citation2001; Cavieres et al. Citation2002; Molenda, Reid, and Lortie Citation2012; Sklenář Citation2009); they may enhance phylogenetic uniqueness of communities (Butterfield et al. Citation2013), and alter community structure by alleviating stress and providing resources for beneficiary species (Antonsson, Björk, and Molau Citation2009; Arredondo-Nuñez, Badano, and Bustamante Citation2009; Arroyo et al. Citation2003; Brancaleoni, Strelin, and Gerdol Citation2003). Indeed, in some systems they are considered keystone species (e.g. Lortie and Reid Citation2012; Phiri, McGeoch, and Chown Citation2009).
However, despite the importance of cushion plants for community structure in high-elevation and high-latitude systems, studies have not explicitly documented the environmental factors determining the distribution of plant species with cushion growth forms; reports on the drivers of cushion plant distributions have mainly been anecdotal (). The global distribution of cushion-forming species was recently reviewed (Aubert et al. Citation2014; see also Hauri and Schröter Citation1914), identifying regions with the highest richness of cushion plant species (e.g. South America and Europe; see also Boucher et al. Citation2016). However, this study did not identify the environmental drivers of these patterns. In a fairly coarse analysis, Boucher et al. (Citation2016) showed that cushion richness within large political land units was correlated positively with low temperature and aridity (see also Boucher et al. Citation2012), while at finer scales, occurrence patterns for some species have been reported and some generalities emerge (); but the influence of almost none of the purported drivers have been statistically verified (although see e.g. Kleier and Rundel Citation2004). These anecdotal observations suggest that cushion plants occur in harsh abiotic environments (both locally and globally), but quantitative analyses of the distribution of cushion plants across any environmental gradients are still lacking.
Table 1. Summary of published information on the determinants of the fine-scale distribution of cushion plant species. Most of these data are observational, and only studies indicated with an asterisk statistically quantified the purported patterns
Other aspects of the biology and ecology of cushion plants, in contrast to the drivers of cushion plant species distributions, have been studied in more detail. For example, recent research on cushion plants has focused on cushion plants as ecosystem engineers, facilitators, and foundation species (e.g. reviewed by Kikvidze et al. Citation2015; Molenda, Reid, and Lortie Citation2012; Reid, Lamarque, and Lortie Citation2010), while earlier reviews focused on convergent morphology and anatomy across cushion plant species (e.g. Hauri Citation1916; Rauh Citation1939; Weberbauer Citation1931). Despite this extensive research on cushion plants, succulent cushion-forming species have been relatively poorly studied and less is known about cushion plant species from African ecosystems than the rest of the world.
While cushion plants appear to be most common in abiotically extreme environments, they are often absent from lower elevations and lower latitudes (see e.g. Aubert et al. Citation2014). This likely reflects that cushion plants cannot tolerate high temperatures (see Buchner and Neuner Citation2003; Körner Citation2003). Additionally, cushion plants may be excluded from lower elevations and latitudes by interspecific competition (particularly for light), to which cushion plants are thought to be poorly adapted (Ramsay Citation1992; see also Armesto, Arroyo, and Villagran Citation1980). Therefore, cushion plants may be expected to occur in cool and wind-exposed microsites, with low and/or sparse vegetation (i.e. where conditions are abiotically unfavorable and productivity is low), and in regions of stressful climatic conditions (including high wind and low temperature).
The relative influence of biotic interactions and abiotic factors on species’ distributions are thought to vary with the spatial scale of investigation (McGill Citation2010). While it has been suggested that biotic factors will be more important in determining species occurrence patterns at fine scales, with abiotic factors being the dominant drivers of broad-scale species distributions (Brooker and Callaghan Citation1998; McGill Citation2010; Pearson and Dawson Citation2003), there is no consensus on the relative importance of abiotic and biotic factors for the distribution of species across different scales (Svenning et al. Citation2014). Therefore, both abiotic and biotic factors should be investigated when aiming to quantify the distribution of species and, where possible, studies should additionally examine species occurrence patterns at different scales to identify all of the key variables driving species distributions.
This study investigates the drivers of a cushion plant species’ distribution at broad and fine scales, using the succulent cushion plant, Euphorbia clavarioides Boiss. (Euphorbiaceae), as an exemplar species. Euphorbia clavarioides occurs in southern Africa (Aubert et al. Citation2014) and is widespread in the eastern parts of South Africa (Dyer Citation1947), but little else is known about its distribution. Therefore, the aims of this study were to document the distribution of E. clavarioides, at (1) a fine spatial scale, correlating occurrence patterns with field-quantified biotic and abiotic predictors; and (2) a broad scale, by modeling the species’ broad-scale distribution with climate and topography-related variables. This is the first study quantitatively assessing the drivers of distribution of a cushion plant species.
Methods
Local distribution
Study species and study area
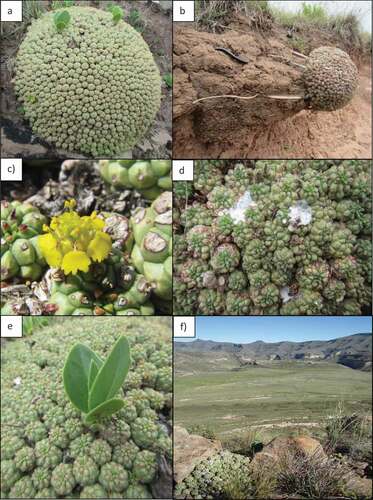
Euphorbia clavarioides () is a poorly studied succulent cushion plant species (see e.g. Archer, Victor, and von Staden Citation2014). Several other cushion-forming species occur in the genus, including E. acanthothamnos, E. aggregata and E. pulvinata (Aubert et al. Citation2014), but their ecology is also largely unstudied.
Figure A1. (a) A Euphorbia clavarioides cushion; (b) E. clavarioides growing on an eroded bank with parts of its root system exposed; (c) a flower of E. clavarioides; (d) milky latex exuding from damaged stems; (e) Senecio rhomboideus rooted within an E. clavarioides cushion; (f) E. clavarioides growing in a rocky crevice
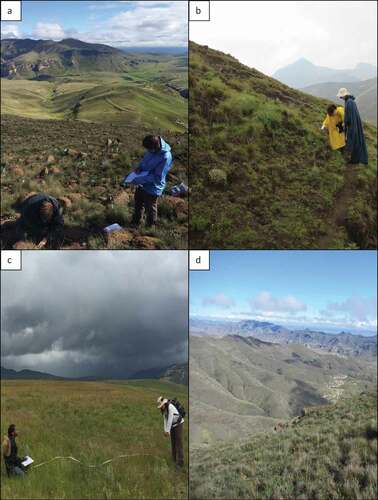
The study was conducted during January 2016 and January 2017 in the Golden Gate Highlands National Park (), which lies at the foothills of the Maluti Mountains, South Africa (28°31ʹS, 28°37ʹE). The mean daily minimum and maximum temperatures from the closest weather station (Bethlehem, elevation c. 1700 m, 45 km away) are 6.4°C (1980–2009; range: −6.1 to 14.3°) and 22.2°C (12.3 to 29.7°) respectively, with the hottest months generally being December and January, and the coldest June and July (1980–2009; unpublished data, South African Weather Service). Most of the rainfall occurs in spring and summer (between September and March), although precipitation does occur throughout the year, with an average annual precipitation of 700 mm per year (1980–2009; unpublished data, South African Weather Service). The Golden Gate Highlands National Park ranges in elevation from c. 1900 to 2800 m a.s.l. and is probably somewhat colder and wetter than Bethlehem. The national park is chiefly comprised of grassland, with isolated areas of shrubland and Afromontane forest (Daemane, van Wyk, and Moteetee Citation2010).
Figure A2. Examples of sites where Euphorbia clavarioides was present (a, b) and absent (c, d)
Field methods
To quantify the occurrence of Euphorbia clavarioides, 4 × 4 m quadrats were surveyed at 100-m intervals (or 250-m intervals in relatively flat or homogenous areas) along hiking trails, management tracks, and roads, spanning an elevational range and topographic variation representative of the Gladstone section of the reserve. Quadrats were located 10 m away from hiking paths, roads, access tracks and preplanned routes in inaccessible areas, positioned on alternating sides of the trail, road, track or route. Because of the localized distribution of E. clavarioides, this systematic sampling yielded few presence records and ad hoc presences for the species were thus additionally recorded in the areas where systematic sampling was conducted (similar to le Roux et al. Citation2013), with a 4 × 4 m quadrat centered over the first E. clavarioides individual observed during sampling. A minimum distance of 100 m was maintained between ad hoc quadrats.
The presence or absence of live E. clavarioides cushion plants within each quadrat was recorded. At each quadrat geographical coordinates (from a handheld GPS unit; Garmin Dakota 20, 3 to 5 m accuracy) and aspect were recorded, along with categorical estimates of quadrat slope (shallow, intermediate, steep), topography (convex, flat, concave) and wind exposure (low, medium, high; estimated visually based on the surrounding topography). Soil depth was measured at each corner of the quadrat using a soil depth probe with a maximum depth of 60 cm (deeper soils were assigned a value of 70 cm). Based on texture, soil type at each quadrat was classified as clay, loam, or sand. The vegetation type within the quadrat was classified as either grassland (less than 10 percent woody plant cover) or shrubland (which included forest). The percentages of rock cover, woody plant cover, and non-woody plant cover were visually estimated. The tallest woody and non-woody plants in each quadrat were measured (excluding reproductive structures). Any visible erosion within the quadrat was noted and the occurrence of mammalian disturbance was recorded based on evidence of trampling, burrowing, grazing, or the presence of dung.
After field sampling, a digital elevation model (DEM, at 30 m resolution, with vertical height accuracy < 16 m) from NASA’s Space Shuttle Radar Topography Mission was downloaded from the United States Geological Survey Earth Explorer (http://earthexplorer.usgs.gov/). A topographic wetness index (TWI) was calculated from the DEM as a proxy for soil moisture in SAGA-GIS version 2.2.7 (Conrad et al. Citation2015). The TWI combines the local slope angle and the upslope area to estimate the influence of topography on the hydrology of an area (Beven and Kirkby Citation1979; Sörensen, Zinko, and Seibert Citation2006).
Analyses
Local distribution
For fine-scale analyses, collinearity between predictor variables was assessed using the generalized variance inflation factor (GVIF), where GVIF values > 3 were considered to be strongly collinear (see e.g. Mizerek et al. Citation2016). Non-woody cover and rock cover were the only variables, with a GVIF > 3 (Pearson’s correlation coefficient = −0.730, P < .001), and rock cover was excluded from further analyses since non-woody cover better explained the occurrence of E. clavarioides in univariate analyses.
The relationship between the occurrence of E. clavarioides and each predictor variable was initially assessed using univariate generalized linear models (GLMs), assuming a binomial distribution. For continuous predictor variables, the GLMs were run as both linear and quadratic models to determine which model provided a better fit to the data (using a log-likelihood ratio test to test for significant differences between the linear and quadratic models). Model significance was determined using a log-likelihood ratio test to compare the performance of the best fit model (quadratic or linear) for each predictor variable against a null model. Quadrat aspect was converted to northness prior to analyses, where the cosine of aspect (0–360°) is calculated to produce values between 1 (north-facing slope) and −1 (south-facing slope; following e.g. Bader and Ruijten Citation2008).
The data were then analyzed following a best-subsets approach, modeling the occurrence of E. clavarioides as a function of all combinations of predictor variables, including polynomial terms for those variables that performed significantly better as a quadratic model during the univariate analyses. The best model was identified based on the lowest Akaike Information Criteria (AIC) value (Burnham and Anderson 2004). These statistical analyses were conducted in R statistical software (R Core Team Citation2016).
Regional distribution
For broad-scale distribution modeling, presence records for E. clavarioides (including its synonyms, see The Plant List 2013) were collected from the Global Biodiversity Information Facility, the South African National Biodiversity Institute, local and online herbaria (J, LYD, PRU), and iSpot nature (http://ispotnature.org, with identifications verified from photographs).
Climatic variables that were thought to be biologically important (annual mean temperature, maximum temperature of the warmest month, minimum temperature of the coldest month, annual precipitation, precipitation seasonality (coefficient of variation of weekly precipitation), and precipitation of the coldest quarter) were downloaded from WorldClim, version 1.4 at a resolution of 5 minutes (current data interpolated for 1960–1990; Hijmans et al. Citation2005). Some of these variables represent extremes (e.g. minimum temperature of the coldest month, maximum temperature of the warmest month), while others represent total resource availability (e.g. annual mean temperature, annual precipitation). Two additional predictor variables were calculated from the SRTM DEM, version 4.1 (Jarvis et al. Citation2008), which has a resolution of 90 m. The range and standard deviation of elevation were calculated for each 1 km2 grid cell, as measures of elevational range and ruggedness, respectively. All predictor variables were clipped to southern Africa south of 20° S, and all data were reprojected to the Albers equal area conic projection with a resolution of 1 km2.
Although repeating analyses of the species’ broad-scale distribution with the same predictor variables that were recorded in the fine-scale analyses would have been valuable, these data are not available at broader scales and the variables considered in the broad-scale analyses show very little variation at small scales. Additionally, since the dominant drivers of species distributions are expected to shift from biotic factors at fine scales to abiotic factors (predominantly climatic factors) at broad scales, we consider our choice of predictor variables appropriate (Brooker and Callaghan Citation1998; McGill Citation2010; Pearson and Dawson Citation2003). All map modifications were conducted in ArcMap v. 10.3.
Occurrence records were modeled using the climatic predictors and elevational range and standard deviation, following a maximum entropy approach in MaxEnt v. 3.3 (Phillips, Dudík, and Schapire Citation2004), using 5-fold cross-validation (an average of 10049.6 background points from across southern Africa was used for each of the five replicates, with an average of 88.8 training samples; see e.g. Speed and Austrheim Citation2017). The percentage contribution for each variable was calculated based on the order in which variables were added to the model, while permutation importance was also calculated to reflect the contribution of variables based only on the final model (irrespective of the order in which variables were added; Phillips Citation2005). A presence/absence map was created from the probability of occurrence map using the equal training sensitivity and specificity threshold (see Liu et al. Citation2005).
Results
Local distribution
A wide variety of habitat conditions were surveyed, with 367 quadrats surveyed across a broad range of elevations (1836 to 2637 m). Euphorbia clavarioides was recorded in about 4 percent (15 quadrats) of the systematically surveyed quadrats, but was also recorded in an additional 28 ad hoc quadrats.
Of the categorical predictor variables, wind exposure, soil type, and vegetation type significantly predicted the occurrence of E. clavarioides in univariate models, while slope was a marginally significant predictor (, ). The species only occurred at sites with medium or high wind exposure, and only in grassland sites. The probability of occurrence of E. clavarioides was lowest in loam soils, relative to clay and sandy soils. Other categorical predictors were not significant in univariate analyses.
Table 2. Best fit generalized linear model for the occurrence of Euphorbia clavarioides. Deviance explained = 60.53 percent, Likelihood ratio test = 160.5, P < .001. See for all models differing in AIC < 2 from the best model
Table A1. Results from the univariate analyses of the occurrence of E. clavarioides in response to each categorical predictor variable (n = 367)
Figure 1. Spineplots indicating the proportion of quadrats where Euphorbia clavarioides was present and absent, split by: (a) low (L), medium (M), and high (H) wind exposure; (b) soil type; (c) vegetation type; and (d) slope (Int = intermediate). The width of the bars corresponds to the number of samples in each category
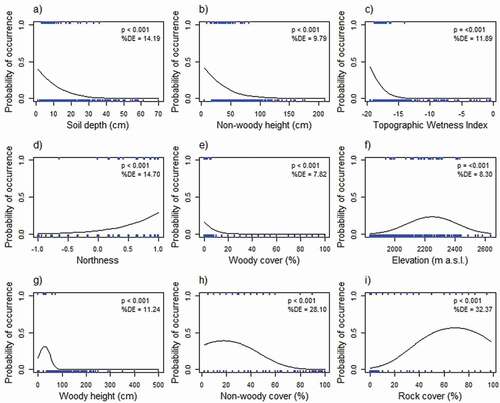
All of the continuous predictor variables were significantly related to the occurrence of E. clavarioides in univariate models (, ). Soil depth, non-woody plant height, and TWI were significantly negatively related to the probability of occurrence for E. clavarioides, while northness was significantly positively related (). Elevation, non-woody plant cover, rock cover, woody vegetation height, and woody vegetation cover all showed a significant hump-shaped relationship with the occurrence of E. clavarioides ().
Figure 2. The relationship between continuous predictor variables and the probability of occurrence of Euphorbia clavarioides, with the best fit regression line indicated. Quadratic models performed significantly better than linear models when explaining variation in the occurrence of E. clavarioides in response to elevation, woody plant height, non-woody plant cover, and rock cover. Ticks on the upper x-axis indicate the values for occurrence records, and on the lower x-axis the values for absence records. Percentage deviance explained (%DE; estimating the proportion of the variability in occurrence explained by the predictor variable) and the significance of each relationship is indicated
The best model of slope, wind exposure, woody plant height, woody plant cover, woody plant cover2, non-woody plant height, rock cover, rock cover2, elevation, and northness, identified by the best subsets modeling approach, performed well, explaining 61 percent of the deviance in the data (Likelihood ratio test = 160.5, P < .001, ). The direction of the effect for each predictor variable was consistent with their effects in the univariate models ( and ) and in all the other models with AIC differences < 2 ().
Table A3. Results for the top-ranked models (i.e. all models with AIC values that differ < 2 from the best model) predicting the fine-scale occurrence patterns of Euphorbia clavarioides. Log-likelihood ratio tests indicate that all 12 models perform significantly better than expected by chance (all P < .001). Slope: sh (shallow), i (intermediate), st (steep). Wind exposure: L (low), M (medium), H (high). Soil type: L (loam), C (clay), S (sandy). Vegetation type: O (other), G (grassland). Erosion: N (no), Y (yes)
Regional distribution
A total of 226 occurrence records for E. clavarioides were collected (with 43 records coming from this study’s fine-scale surveys), representing 111 grid cells at a 1 km2 resolution. The MaxEnt model for E. clavarioides performed well (mean AUC ± SD across fivefold cross-validation = 0.92 ± 0.01). The predicted species distribution is constrained to higher elevations inland of the Great Escarpment ()), and falls within the boundaries of the grassland biome ()).
Figure 3. The predicted distribution of Euphorbia clavarioides in southern Africa showing (a) probability of occurrence values, and (b) modeled distribution, with green indicating predicted presence (as calculated using the equal training sensitivity and specificity threshold). Provincial and national boundaries are indicated in (a), while the extent of the grassland biome is shown in (b). Black dots indicate occurrence records
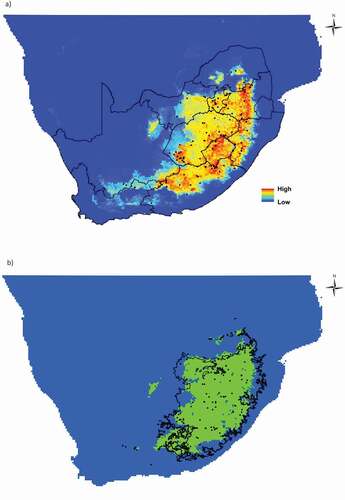
Annual mean temperature had the highest percentage contribution to the model, while minimum temperature of the coldest month had the highest permutation importance (, ).
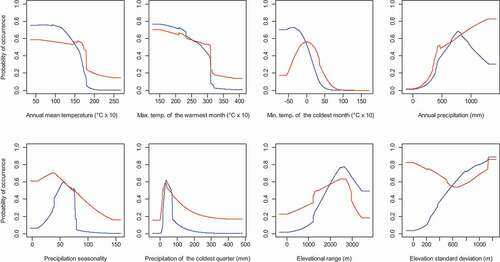
Figure A3. Response curves for the individual predictor variables included in the MaxEnt species distribution model for Euphorbia clavarioides. Blue lines indicate the effect of each predictor variable in isolation, while red lines indicate the effect of each predictor variable after accounting for all the other predictor variables included in the model. Max. Temp. and Min. Temp. refer to maximum and minimum temperature, respectively
Discussion
The distribution of Euphorbia clavarioides was explained well at the fine scale, along with a good prediction of the distribution at the broad scale, with multiple important drivers identified at both scales. E. clavarioides was locally scarce within the Golden Gate Highlands National Park (i.e. a small area of occupancy), but widespread across the grassland biome of southern Africa (i.e. it has a large extent of occurrence). Therefore, this species appears to be limited to specific microsites at fine scales (e.g. habitats with low vegetation cover) within regions with a moderately cool and wet macroclimate.
Our results suggest that, at fine scales, E. clavarioides appears to be intolerant of competition, but able to tolerate abiotic environmental extremes. The species was found in areas of low shading (i.e. areas with short woody plants and low vegetation cover, as seen for another cushion plant species, Androsace alpina, Schönswetter, Tribsch, and Niklfeld Citation2003), and thus one possibility is that its occurrence could be limited by taller vegetation (following e.g. Ramsay Citation1992). This is in agreement with our hypothesis that the distribution of E. clavarioides will be limited by interspecific competition due to its prostrate growth form (see also Armesto, Arroyo, and Villagran Citation1980, although noting that our data are not direct measures of competition). These results also highlight that E. clavarioides is able to tolerate a variety of abiotically stressful conditions. For example, E. clavarioides was more likely to occur in areas with lower soil moisture (in contrast to Cleef Citation1978; Dobson Citation1975), where competition with other plants that require higher soil moisture is likely to be lower. E. clavarioides has two attributes allowing it to survive drier conditions: an extensive root system (personal observation; ), which is a common attribute of cushion plants (e.g. Azorella selago, Frenot et al. Citation1998; Ternetz Citation1902), and succulent stems. Furthermore, E. clavarioides was also more common in shallower soils (although not included in the final model), probably reflecting that more competitive taller and/or faster-growing species are excluded from these less favorable areas (Bernard-Verdier et al. Citation2012). E. clavarioides’ disproportionate occurrence in areas with high wind exposure (see e.g. Grulke and Bliss Citation1985; Körner Citation1993; Molenda, Reid, and Lortie Citation2012), and its complete absence from wind-sheltered sites in the fine-scale study, are also consistent with Körner’s (Citation1993) observation that true cushion plants are absent from areas with low wind exposure. Therefore, low and sparse vegetation, driven potentially by various abiotic mechanisms (e.g. thin, dry soils), appears to be the key driver of fine-scale occurrence patterns for this cushion plant species.
At a broad scale, the species’ distribution was more strongly related to climate than to topographic variation, with E. clavarioides occurring disproportionately frequently under lower mean, maximum, and minimum temperatures. In contrast, annual precipitation was positively related to the occurrence of E. clavarioides. This result likely reflects that E. clavarioides is confined to mountainous regions, which tend to receive higher rainfall. Furthermore, the species’ distribution largely overlaps with that of the grassland biome in South Africa, which typically has relatively short vegetation with a low cover and richness of woody species (Mucina et al. Citation2006), corresponding to the sensitivity of E. clavarioides to vegetation height and cover at fine scales.
While there is little quantitative information about what drives the distribution of other cushion species, several variables show consistent impacts on the distribution of cushion plant species (e.g. comparing results within and between and ), suggesting that what has been observed in this and previous studies may be representative of other cushion plant species. Therefore, the variables most strongly correlated with the distribution of E. clavarioides are likely to be similar for other cushion-forming species due to the convergent evolution of the growth form (Boucher et al. Citation2016). Therefore, globally, cushion plants may be expected to be excluded from areas of tall and/or dense plant cover due to competition, and confined to less favorable (i.e. abiotically stressful) habitats, such as areas with high rock cover, shallow soils, low soil moisture, and high wind exposure. Because E. clavarioides occurs in relatively mild environments, other abiotic stresses and disturbances may additionally be important in colder areas. For example, periglacial processes (such as frost heave and freeze–thaw cycles) might be important processes influencing the distribution of cushion plants in colder areas (e.g. via frost heaving and increased substrate instability).
At broad spatial scales, the distribution of E. clavarioides is strongly linked with temperature and precipitation parameters, suggesting that habitat suitability will change directly for this species in response to shifting climatic conditions. At finer scales, while the direct effects of warming temperatures and lower rainfall for cushion plants have been demonstrated experimentally (Cranston et al. Citation2015; le Roux et al. Citation2005) and observed through long-term monitoring (Bergstrom et al. Citation2015; Doak and Morris Citation2010; see also Frenot, Gloaguen, and Tréhen Citation1997; Fowbert and Smith Citation1994), and the sensitivity of cushion plants to overheating has been suggested (due to slow rates of heat loss) (Buchner and Neuner Citation2003), the indirect effects of warmer conditions may also be very important. Indeed, cushion plants may be indirectly affected through the upslope range expansion of taller and faster-growing species (assuming these species are able to establish in sites with, e.g., thinner soils once thermal constraints are relaxed), leading to an increase in the intensity of interspecific competition (Hughes Citation2000; Thuiller Citation2007), which appears to be a strong determinant of cushion species occurrence patterns. Therefore, climate change may have important direct and indirect implications for cushion plants at both coarse and fine spatial scales, potentially having knock-on effects on the community of species that benefit from positive interactions with cushion plants (Molenda, Reid, and Lortie Citation2012). If cushion plant species generally follow these same trends, then species of this growth form may be particularly useful to monitor as indicators of environmental change in alpine areas.
Acknowledgments
We thank South African National Parks, and especially the management and rangers of the Golden Gate Highlands National Park, for allowing and supporting this research (Permit LEROP 1314 and LEROA 1319). We thank I. Buyens, D. Mogashoa, T. Strydom and J. Potgieter for field assistance. We thank Catherine Kleier and one anonymous reviewer for their valuable comments on the manuscript.
Additional information
Funding
Related Research Data
References
- Antonsson, H., R. G. Björk, and U. Molau. 2009. Nurse plant effect of the cushion plant Silene acaulis (L.) Jacq. in an alpine environment in the subarctic Scandes, Sweden. Plant Ecology & Diversity 2:1–16.
- Archer, R. H., J. E. Victor, and L. von Staden. 2014. Euphorbia clavarioides Boiss. National Assessment: Red List of South African Plants Version 2015 1. http://redlist.sanbi.org/species.php?species=574-4004
- Armesto, J., M. Arroyo, and C. Villagran. 1980. Altitudinal distribution, cover and size structure of umbelliferous cushion plants in the high Andes of central Chile. Acta Oecologica 1:327–32.
- Arredondo-Nuñez, A., E. I. Badano, and R. O. Bustamante. 2009. How beneficial are nurse plants? A meta-analysis of the effects of cushion plants on high-Andean plant communities. Community Ecology 10:1–6.
- Arroyo, M. T. K., L. A. Cavieres, A. Peñaloza, and M. A. Arroyo-Kalin. 2003. Positive associations between the cushion plant Azorella monantha (Apiaceae) and alpine plant species in the Chilean Patagonian Andes. Plant Ecology 169:121–29.
- Aubert, S., F. Boucher, S. Lavergne, J. Renaud, and P. Choler. 2014. 1914–2014: A revised worldwide catalogue of cushion plants 100 years after Hauri and Schröter. Alpine Botany 124:59–70.
- Badano, E., and P. Marquet. 2008. Ecosystem engineering affects ecosystem functioning in high-Andean landscapes. Oecologia 155:821–29.
- Badano, E. I., and L. A. Cavieres. 2006. Ecosystem engineering across ecosystems: Do engineer species sharing common features have generalized or idiosyncratic effects on species diversity? Journal of Biogeography 33:304–13.
- Badano, E. I., C. G. Jones, L. A. Cavieres, and J. P. Wright. 2006. Assessing impacts of ecosystem engineers on community organization: A general approach illustrated by effects of a high-Andean cushion plant. Oikos 115:369–85.
- Badano, E. I., and P. A. Marquet. 2009. Biogenic habitat creation affects biomass-diversity relationships in plant communities. Perspectives in Plant Ecology, Evolution and Systematics 11:191–201.
- Badano, E. I., P. A. Marquet, and L. A. Cavieres. 2010. Predicting effects of ecosystem engineering on species richness along primary productivity gradients. Acta Oecologica 36:46–54.
- Bader, M. Y., and J. J. Ruijten. 2008. A topography-based model of forest cover at the alpine tree line in the tropical Andes. Journal of Biogeography 35:711–23.
- Barendse, J., and S. L. Chown. 2001. Abundance and seasonality of mid-altitude fellfield arthropods from Marion Island. Polar Biology 24:73–82.
- Bergstrom, D. M., P. K. Bricher, B. Raymond, A. Terauds, D. Doley, M. A. Mcgeoch, J. Whinam, M. Glen, Z. Yuan, K. Kiefer, et al. 2015. Rapid collapse of a sub-Antarctic alpine ecosystem: The role of climate and pathogens. Journal of Applied Ecology 52 (3):774–83.
- Bernard-Verdier, M., M.-L. Navas, M. Vellend, C. Violle, A. Fayolle, and E. Garnier. 2012. Community assembly along a soil depth gradient: Contrasting patterns of plant trait convergence and divergence in a Mediterranean rangeland. Journal of Ecology 100:1422–33.
- Beven, K., and M. J. Kirkby. 1979. A physically based, variable contributing area model of basin hydrology. Hydrological Sciences Journal 24:43–69.
- Billings, W. D., and H. A. Mooney. 1968. The ecology of Arctic and alpine plants. Biological Reviews 43:481–529.
- Bliss, L. C., J. Svoboda, and D. I. Bliss. 1984. Polar deserts, their plant cover and plant production in the Canadian High Arctic. Holarctic Ecology 7:305–24.
- Bosman, A. F., P. C. van der Molen, R. Young, and A. M. Cleef. 1993. Ecology of a páramo cushion mire. Journal of Vegetation Science 4:633–40.
- Boucher, F. C., S. Lavergne, M. Basile, P. Choler, and S. Aubert. 2016. Evolution and biogeography of the cushion life form in angiosperms. Perspectives in Plant Ecology, Evolution and Systematics 20:22–31.
- Boucher, F. C., W. Thuiller, C. Roquet, R. Douzet, S. Aubert, N. Alvarez, and S. Lavergne. 2012. Reconstructing the origins of high-alpine niches and cushion life form in the genus Androsace s.l. (Primulaceae). Evolution 66:1255–68.
- Brancaleoni, L., J. Strelin, and R. Gerdol. 2003. Relationships between geomorphology and vegetation patterns in sub-Antarctic Andean tundra of Tierra Del Fuego. Polar Biology 26:404–10.
- Bricher, P. K., A. Lucieer, J. Shaw, A. Terauds, and D. M. Bergstrom. 2013. Mapping sub-Antarctic cushion plants using random forests to combine very high resolution satellite imagery and terrain modelling. PLoS ONE 8 (8):e72093. doi:https://doi.org/10.1371/journal.pone.0072093.
- Brooker, R. W., and T. V. Callaghan. 1998. The balance between positive and negative plant interactions and its relationship to environmental gradients: A model. Oikos 81:196–207.
- Buchner, O., and G. Neuner. 2003. Variability of heat tolerance in alpine plant species measured at different altitudes. Arctic, Antarctic, and Alpine Research 35:411–20.
- Burnham, K. P., and D. R. Anderson. 2004. Multimodel inference: understanding AIC and BIC in model selection. Sociological Methods and Research 33:261–304.
- Butterfield, B. J., L. A. Cavieres, R. M. Callaway, B. J. Cook, Z. Kikvidze, C. J. Lortie, R. Michalet, F. I. Pugnaire, C. Schöb, S. Xiao, et al. 2013. Alpine cushion plants inhibit the loss of phylogenetic diversity in severe environments. Ecology Letters 16:478–86.
- Cabrera, H. M., F. Rada, and L. Cavieres. 1998. Effects of temperature on photosynthesis of two morphologically contrasting plant species along an altitudinal gradient in the tropical high Andes. Oecologica 114:145–52.
- Cavieres, L. A., M. T. K. Arroyo, A. Peñaloza, M. Molina-Montenegro, and C. Torres. 2002. Nurse effect of Bolax gummifera cushion plants in the alpine vegetation of the Chilean Patagonian Andes. Journal of Vegetation Science 13:547–54.
- Cleef, A. M. 1978. Characteristics of neotropical páramo vegetation and its sub-Antarctic relations. Erdwissenschaftliche Forschung 11:365–90.
- Conrad, O., B. Bechtel, M. Bock, H. Dietrich, E. Fischer, L. Gerlitz, J. Wehberg, V. Wichmann, and J. Böhner. 2015. System for automated geoscientific analyses (SAGA) v. 2.1.4. Geoscientific Model Development 8:1991–2007.
- Cranston, B. H., A. Monks, P. A. Whigham, and K. J. Dickinson. 2015. Variation and response to experimental warming in a New Zealand cushion plant species. Austral Ecology 40:642–50.
- Daemane, M. E., B.-E. van Wyk, and A. Moteetee. 2010. Checklist of ferns and seed plants of the Golden Gate Highlands National Park, South Africa. Bothalia 40:205–18.
- Doak, D. F., and W. F. Morris. 2010. Demographic compensation and tipping points in climate-induced range shifts. Nature 467:959–62.
- Dobson, A. T. 1975. Vegetation of a Canterbury subalpine mire complex. Proceedings of the New Zealand Ecological Society 22:67–75.
- Dyer, R. A. 1947. A note on the distribution of succulent Euphorbia in South Africa in relation to climate. The National Cactus and Succulent Journal 2:28–30.
- Fowbert, J. A., and R. I. L. Smith. 1994. Rapid population increases in native vascular plants in the Argentine Islands, Antarctic Peninsula. Arctic and Alpine Research 26:290–96.
- Freas, K., and P. R. Kemp. 1983. Some relationships between environmental reliability and seed dormancy in desert annual plants. The Journal of Ecology 71:211–17.
- Frenot, Y., J.-C. Gloaguen, M. Cannavacciuolo, and A. Bellido. 1998. Primary succession on glacier forelands in the sub-Antarctic Kerguelen Islands. Journal of Vegetation Science 9:75–84.
- Frenot, Y., J.-C. Gloaguen, and P. Tréhen. 1997. Climate change in Kerguelen Islands and colonization of recently deglaciated areas by Poa kerguelensis and P. annua. In Antarctic communities: Species, structure and survival, eds. B. Battaglia, J. Valencia, and D. Walton, 358–66. Cambridge: Cambridge University Press.
- García-Camacho, R., and A. Escudero. 2008. Reproduction of an early-flowering Meditteranean mountain narrow endemic (Armeria caespitosa) in a contracting mountain island. Plant Biology 11:515–24.
- Grulke, N. E., and L. C. Bliss. 1985. Growth forms, carbon allocation, and reproductive patterns of high Arctic saxifrages. Arctic and Alpine Research 17:241–50.
- Hauri, H. 1912. Anabasis aretioïdes Moq. and Coss., eine polsterpflanze der algerischen sahara: Mit einem anhang, die kenntnis der angiospermen polsterpflanzen überhaupt betreffend. Beihefte Zum Botanischen Centralblatt 28:323–421. [In German].
- Hauri, H., and C. Schröter. 1914. Versuch einer übersicht der siphonogamen polsterpflanzen. Botanische JahrbüCher FüR Systematik, Pflanzengeschichte Und Pflanzengeographie 50:618–56. [In German].
- Hauri, N. 1916. Anatomische untersuchungen an polsterpflanzen nebel morphologischen und biologischen Nolizen. Beihefte Zum Botanischen Centralblatt 33:275–93. [In German].
- Hijmans, R. J., S. E. Cameron, J. L. Parra, P. G. Jones, and A. Jarvis. 2005. Very high resolution interpolated climate surfaces for global land areas. International Journal of Climatology 25:1965–78.
- Hodge, W. H. 1946. Cushion plants of the Peruvian Puna. Journal of the New York Botanical Garden 14:133–41.
- Holten, J. I. 2003. Altitude ranges and spatial patterns of alpine plants in northern Europe. - Alpine biodiversity in Europe, L. Nagy, G. Grabherr, C. Körner, and D. B. A. Thompson, eds. 172–84. Berlin: Springer-Verlag.
- Hughes, J. M. R. 1987. The distribution and composition of vascular plant communities on Heard Island. Polar Biology 7:153–62.
- Hughes, L. 2000. Biological consequences of global warming: Is the signal already apparent? Trends in Ecology and Evolution 15:56–61.
- Jarvis, A., H. I. Reuter, A. Nelson, and E. Guevara 2008. Hole-filled SRTM for the globe, version 4, available from the CGIAR-CSI SRTM 90m Database. Accessed on 1 May 2016. http://srtm.csi.cgiar.org.
- Johnson, P. L., and W. D. Billings. 1962. The alpine vegetation of the Beartooth Plateau in relation to cryopedogenic processes and patterns. Ecological Monographs 32:105–35.
- Kampichler, C. 1990. Community structure and vertical distribution of Collembola and Cryptostigmata in a dry-turf cushion plant. Biology and Fertility of Soils 9:130–34.
- Kikvidze, Z., R. W. Brooker, B. J. Butterfield, R. M. Callaway, L. A. Cavieres, B. J. Cook, C. J. Lortie, R. Michalet, F. I. Pugnaire, S. Xiao, et al. 2015. The effects of foundation species on community assembly: A global study on alpine cushion plant communities. Ecology 96:2064–69.
- Kleier, C., and P. Rundel. 2004. Microsite requirements, population structure and growth of the cushion plant Azorella compacta in the tropical Chilean Andes. Austral Ecology 29:461–70.
- Körner, C. 1993. Das ökosystem polsterpflanze: Recycling und aircondition. Biologie in Unserer Zeit 23:353–55. [In German].
- Körner, C. 2003. Alpine plant life: Functional plant ecology of high mountain ecosystems. Heidelberg: Springer Berlin.
- Körner, C. 2007. Climatic treelines: Conventions, global patterns, causes (klimatische baumgrenzen: Konventionen, globale muster, ursachen). Erdkunde 61:316–24.
- le Roux, P. C., M. A. McGeoch, M. J. Nyakatya, and S. L. Chown. 2005. Effects of a short-term climate change experiment on a sub-Antarctic keystone plant species. Global Change Biology 11:1628–39.
- le Roux, P. C., T. Ramaswiela, J. M. Kalwij, J. D. Shaw, P. G. Ryan, A. M. Treasure, G. T. McClelland, M. A. McGeoch, and S. L. Chown. 2013. Human activities, propagule pressure and alien plants in the sub-Antarctic: Tests of generalities and evidence in support of management. Biological Conservation 161:18–27.
- Li, R., T. Luo, Y. Tang, M. Du, and X. Zhang. 2013. The altitudinal distribution center of a widespread cushion species is related to an optimum combination of temperature and precipitation in the central Tibetan Plateau. Journal of Arid Environments 88:70–77.
- Liu, C., P. M. Berry, T. P. Dawson, and R. G. Pearson. 2005. Selecting thresholds of occurrence in the prediction of species distributions. Ecography 28:385–93.
- Lortie, C. J., and A. M. Reid. 2012. Reciprocal gender effects of a keystone alpine plant species on other plants, pollinators, and arthropods. Botany 90:273–82.
- Lough, T. J., J. B. Wilson, A. F. Mark, and A. C. Evans. 1987. Succession in a New Zealand alpine cushion community: A markovian model. Vegetatio 71:129–38.
- Maron, J. L., and E. Crone. 2006. Effects on plant abundance, distribution and population growth. Proceedings: Biological Sciences 273:2575–84.
- McGill, B. J. 2010. Matters of scale. Science 328:575–76.
- Mizerek, T. L., A. H. Baird, L. J. Beaumont, and J. S. Madin. 2016. Environmental tolerance governs the presence of reef corals at latitudes beyond reef growth. Global Ecology and Biogeography 25:979–87.
- Molau, U. 1996. Climatic impacts on flowering, growth, and vigour in an Arctic-alpine cushion plant, Diapensia lapponica, under different snow cover regimes. Ecological Bulletins 45:210–19.
- Molenda, O., A. Reid, and C. J. Lortie. 2012. The alpine cushion plant Silene acaulis as foundation species: A bug’s-eye view to facilitation and microclimate. PLoS ONE 7:e37223.
- Mucina, L., D. B. Hoare, M. C. Lötter, P. J. du Preez, M. C. Rutherford, C. R. Scott-Shaw, G. J. Bredenkamp, L. W. Powrie, L. Scott, K. G. T. Camp, et al. 2006. Grassland biome. In The vegetation of South Africa, Lesotho and Swaziland, eds. L. Mucina, and M. C. Rutherford, 348–437. Pretoria: South African National Biodiversity Institute.
- Parsons, R. F., and N. Gibson. 2009. The cushion plants of lowland southern Australia. Cunninghamia 11:177–84.
- Pearson, R. G., and T. P. Dawson. 2003. Predicting the impacts of climate change on the distribution of species: Are bioclimate envelope models useful? Global Ecology and Biogeography 12:361–71.
- Phillips, S. J. 2017. A Brief Tutorial on Maxent. AT&T Research. http://biodiversityinformatics.amnh.org/open_source/maxent/
- Phillips, S. J., M. Dudík, and R. E. Schapire 2004. A maximum entropy approach to species distribution modeling. Proceedings of the twenty-first international conference on Machine learning, pp. 83. ACM.
- Phiri, E. E., M. A. McGeoch, and S. L. Chown. 2009. Spatial variation in structural damage to a keystone plant species in the sub-Antarctic: Interactions between Azorella selago and invasive house mice. Antarctic Science 21:189–96.
- Plant List, The. 2013. Version 1.1. Available: http://www.theplantlist.org/
- Pyšek, P., and J. Liška. 1991. Colonization of Sibbaldia tetrandra cushions on alpine scree in the Pamiro-Alai Mountains, central Asia. Arctic and Alpine Research 23:263–72.
- Qin, Z.-Y., and W.-Z. Xie. 1980. Observations on the morphology and ecology of the cushion plants in Togme region of northern Xizang. Acta Botanica Sinica 22:177–81.
- R Core Team. 2016. R: A language and environment for statistical computing. R Foundation for Statistical Computing, Vienna, Austria. http://www.R-project.org
- Ralph, C. P. 1978. Observations on Azorella compacta (Umbelliferae), a tropical Andean cushion plant. Biotropica 10:62–67.
- Ramsay, P. M. 1992. The Páramo vegetation of Ecuador: The community ecology, dynamics and productivity of tropical grasslands in the Andes. Bangor, Gwynedd: School of Biological Sciences, University of Wales.
- Ramsay, P. M., and E. R. B. Oxley. 1997. The growth form composition of plant communities in the Ecuadorian Páramos. Plant Ecology 131:173–92.
- Rapoport, E. H. 1982. Areography: Geographical strategies of species. Mexico: Pergamon Press.
- Rauh, W. 1939. Über polsterförmigen wuchs, ein beitrag zur kenntnis der wuchsformen der höheren pflanzen. Nova Acta Leopoldina 7:267–508. [In German].
- Reid, A. M., L. J. Lamarque, and C. J. Lortie. 2010. A systematic review of the recent ecological literature on cushion plants: Champions of plant facilitation. Web Ecology 10:44–49.
- Schöb, C., C. Armas, M. Guler, I. Prieto, and F. I. Pugnaire. 2013. Variability in functional traits mediates plant interactions along stress gradients. Journal of Ecology 101:753–62.
- Schönswetter, P., A. Tribsch, and H. Niklfeld. 2003. Phylogeography of the high alpine cushion plant Androsace alpina (Primulaceae) in the European Alps. Plant Biology 5:623–30.
- Sklenář, P. 2007. Temperature environment of Xenophyllum humile (Kunth) v.A. Funk, a high Andean cushion plant. Arnaldoa 14:97–104.
- Sklenář, P. 2009. Presence of cushion plants increases community diversity in the high equatorial Andes. Flora 204:270–77.
- Sörensen, R., U. Zinko, and J. Seibert. 2006. On the calculation of the topographic wetness index: Evaluation of different methods based on field observations. Hydrology and Earth System Sciences Discussions 10:101–12.
- Speed, J. D. M., and G. Austrheim. 2017. The importance of herbivore density and management as determinants of the distribution of rare plant species. Biological Conservation 205:77–84.
- Svenning, J. C., D. Gravel, R. D. Holt, F. M. Schurr, W. Thuiller, T. Münkemüller, K. H. Schiffers, S. Dullinger, T. C. Edwards, and T. Hickler. 2014. The influence of interspecific interactions on species range expansion rates. Ecography 37:1198–209.
- Ternetz, C. 1902. Morphologie und anatomie de Azorella selago Hook. f. Botanische Zeitung 60:1–19. [In German].
- Thuiller, W. 2007. Biodiversity: Climate change and the ecologist. Nature 448:550–52.
- Turnbull, L. A., D. Coomes, A. Hector, and M. Rees. 2004. Seed mass and the competition/colonization trade-off: Competitive interactions and spatial patterns in a guild of annual plants. Journal of Ecology 92:97–109.
- Wagstaff, S. J., and F. Hennion. 2007. Evolution and biogeography of Lyallia and Hectorella (Portulacaceae), geographically isolated sisters from the Southern hemisphere. Antarctic Science 19:417–26.
- Weberbauer, A. 1931. Über die polsterpflanze Pycnophyllum aristatum und die polsterpflanzen im allgemeinen. Berichte Der Deutschen Botanischen Gesellschaft 49:29–34. [In German].
- Woodward, F., M. Lomas, and C. Kelly. 2004. Global climate and the distribution of plant biomes. Philosophical Transactions of the Royal Society B: Biological Sciences 359:1465–76.
Appendix
Table A2. Results from the univariate analyses of the occurrence of E. clavarioides in response to each continuous predictor variable (n = 367). Results for quadratic models were only included for those predictor variables where the quadratic model performed significantly better than the linear model
Table A4. Variables’ contribution to the species distribution model. Response curves for individual variables are presented in