
ABSTRACT
Studies of stoichiometric homeostasis in different types of plant species growing in alpine steppe environments are important in understanding the fitness and nutrient-use strategies of alpine plants in northern Tibet, which may be correlated with species dominance and stability. We used an N- and P-addition experiment to investigate the stoichiometric homeostasis N (HN) in the foliage of different plant species in the Stipa purpurea steppe of the Tibetan Plateau from 2013 to 2016. The concentration of N in the foliage of different types of plants increased significantly with the amount of N added. We found that the HN value of the foliage of alpine steppe plants was much lower than that of plants in temperate grasslands and grasslands with tall grass, suggesting that these alpine plants can absorb more nutrients when they are available. There was no difference in the HN values for different alpine plant species, which is also different from previously reported results for other types of grasslands. Furthermore, the temporal stability and dominance of species was not significantly correlated with the foliage HN value of the species. Our results suggest that the HN value of plant foliage in an alpine steppe environment little affected the species dominance and stability seen in the control and N-addition plots at the species level, which is in conflict with the results from temperate grasslands. The different types of species in this alpine steppe environment show the same nutrient utilization strategies (low HN value, about 2) for coping with a variable and limited supply of nutrients.
Introduction
Stoichiometric homeostasis (H) is an important concept in ecology, and refers to the ability of an organism to maintain relatively constant concentrations or ratios of elements within its tissues under variable environmental conditions (Koojiman Citation1995; Elser et al. Citation2010). Recent research has suggested that stoichiometric homeostasis not only is important in trophic interactions (Sterner and Elser Citation2002) but also affects species dominance and the stability of plant communities (Yu et al. Citation2010, Citation2015; Wang et al. Citation2015). Stoichiometric homeostasis can be used to predict the strategies used by different plant species to cope with limited resources in their surroundings (Sterner and Elser Citation2002; Hessen et al. Citation2004). There is a trade-off between high and low stoichiometric homeostasis in terms of competitive ability and growth when the available resource is rich. Species in the community with high stoichiometric homeostasis were more dominant and stable than those species with low stoichiometric homeostasis when nutrients were limited (Yu et al. Citation2012; Yu et al. Citation2015). Species with low stoichiometric homeostasis tend to grow faster than species with high homeostasis at high nutrient availability, but grow slower at low nutrient availability (Sardans, Rivas-Ubach, and Peñuelas Citation2012; Yu et al. Citation2012). It has been demonstrated in temperate grasslands and in grasslands with tall grass that species with high stoichiometric homeostasis are more common and stable than species with low stoichiometric homeostasis, suggesting that stoichiometric homeostasis could be predictive of the success and stability of plant species (Yu et al. Citation2010, Citation2015).
Alpine steppe is the highest and most common type of grassland on the Tibetan Plateau and is sensitive to global climate change (Wang et al. Citation2012). The low temperatures and aridity of the Tibetan Plateau are strong selective forces on the flora present in this region. Resource-utilization strategies are regarded as useful tools for exploring the adaptation of plants to different environments under nutrient-deficient conditions (Ordoñez and Sykes Citation2009; He et al. Citation2010; Geng et al. Citation2012). Although soil nitrogen (N) concentrations are low on the Tibetan Plateau, the N concentrations in the foliage of Tibetan plants are higher than the global average (He et al. Citation2006; Hong, Wang, and Wu Citation2015). Leaf N concentrations are not significantly related to the total and available N in the soils of the alpine steppe in northern Tibet (Hong, Wang, and Wu Citation2015). These results suggest that plants of the alpine steppe may have the ability to maintain high N concentrations in their tissues despite low soil N concentrations.
In the temperate and tall-grass grassland, the stoichiometric homeostasis of different types of species had greater differences, which plant species with high homoeostatic tend to have high and stable biomass (Yu et al. Citation2010). The environment of the alpine steppe ecosystem is arid, cold, and of low nutrients, which is different from the environment of temperate steppes. Therefore, it is unknown whether the stoichiometric homeostasis of alpine plants is related to species dominance and stability in the harsh environment of alpine steppes. Atmospheric N deposition has gradually increased on the Tibetan Plateau (Jia Citation2008), which will affect the soil N concentration. Geng and He (Citation2014) demonstrated that the alpine climate alters the relationships between morphological traits of foliage and roots, but not their chemical traits. Yu et al. (Citation2015) reported that leaves are the most important plant tissue in terms of stoichiometry, and that foliage stoichiometric homeostasis values could be predictive of the competitive ability and dominance of species, which is rarely affected by abiotic factors. Therefore, understanding the stoichiometric homeostasis of plants in alpine steppe environments is important in understanding the adaptation of plants to changes in soil N concentrations. This study focused on three questions: (1) How does the foliar N content and N:P ratio of different types of plants respond to N deposition? (2) What is the foliar stoichiometric homeostasis of different types of plants and does it vary between different types of plants in alpine steppe environments? (3) Is the foliar stoichiometric homeostasis of alpine plants correlated with species dominance and stability on alpine steppes?
Materials and methods
Study sites and field sampling
Stipa purpurea is a classic alpine grassland plant. We carried out a N- and phosphorus (P)-addition experiment on S. purpurea at the Xianzha Alpine Steppe and Wetland Ecosystem Observation and Experiment Station on the northern Tibetan Plateau (30° 57′ N, 88° 42′ E, 4,675 m a.s.l.) (). This region is cold and semiarid with a mean annual air temperature of 0°C. The mean annual precipitation of 300 mm mainly occurs during the growing season from May to September. The soils consist of frigid calcic soils and seasonally frozen soil. The sand content of the soil is about 77 percent and the soil pH is about 8. The amount of available N is 42.88 mg g−1 and the amount of available P is 1.76 mg g−1. The plant community covers less than 40 percent of the soil surface and the plant species are unevenly distributed.
Figure 1. Location of study area and experimental sites on the Tibetan Plateau.
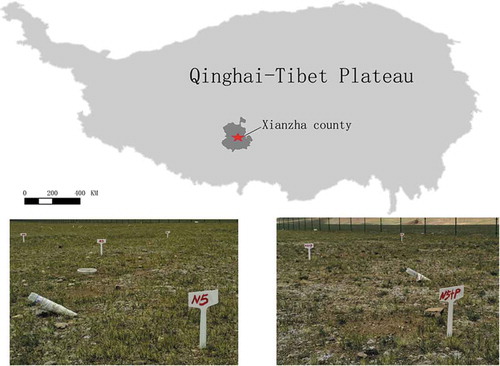
A total of twenty-one plots were assigned in the present experiment (including three CK plots) and each plot was 4 m × 4 m. Buffer zones, without fertilization and 1 m in width, were created between each plot. Nitrogen-addition treatment involving the addition of 2 g (N2), 5 g (N5), or 10 g (N10) m−2 NH4NO3 fertilizer was replicated six times (Tianjin Kelong chemical reagent factory, China). At the same time as the N was added, 4 g m−2 of P fertilizer (K2HPO4 and KH2PO4, pH 7; Tianjin Kelong chemical reagent factory, China) was added at three of the six replicate treatment plots. Nitrogen and P were applied at the beginning of June and then again at the beginning of July from 2013 to 2016. The NH4NO3 fertilizer was dissolved in 1 L of water and was sprayed evenly over each plot. The K2HPO4 and KH2PO4 were added in the same way. The CK plot was also added with 1 L water.
The alpine steppe is dominated by S. purpurea and the sub-dominant species are Carex moorcroftii and Poa litwinowiana. Accessory species are primarily Artemisia nanschanica, Leontopodium nanum, and Astragalus densiflorus. Fewer than ten different plant species were on the steppe at the experimental site, and six species, making up 95 percent of the total above-ground biomass, were selected to estimate the value of H. The N concentration in these six species was determined in August 2016 when the foliage was mature and healthy. At each plot, ten mature and healthy individuals of S. purpurea, P. litwinowiana, C. moorcrofii, and A. nanschanica were selected. However, L. nanum and A. densiflorus were few in each plot, we selected seven mature and healthy individuals of L. nanum and A. densiflorus at each treatment. At each treatment, leaves of six species were collected, mixed into one sample and then divided into three samples. Three replicate soil samples at each plot were taken at depths of 0–15 cm and mixed into one sample, which was stored at 4°C before laboratory analysis.
The amount of N in the plant foliage was determined according to the method of Bremner (Citation1996). The concentration of N (g kg−1) was calculated based on the dry leaf weight. Soil inorganic N (NO3−-N and NH4+-N) was extracted with 1 mol L−1 KCl and was then determined using a Foss FIAstar 5000 flow injection autoanalyzer. The soil inorganic N concentration was calculated based on the dry soil weight.
At the beginning of August in each year from 2013 to 2016, the above-ground biomass of each plot was harvested for each separate species by clipping in a 1 m × 1 m quadrat. At the same time, the number of plants for each species was counted at each plot. All the plant matter was oven-dried at 65°C for 48 h, and then weighed to 0.01 g.
Data analyses and statistics
The stoichiometric homeostasis for the plant foliage was calculated based on the equation y = cx1/H. We used nonlinear regression analysis to fit the data to the homoeostatic model equation. The variable y is the amount of N in the foliage, x is the soil inorganic N content, and c is a constant (Sterner and Elser Citation2002).
Species dominance was estimated using the ratio of species abundance to total abundance. The coefficient variation was estimated using the ratio of the standard deviation to the mean species above-ground biomass from 2013 to 2016, which can reflect the dispersion degree of species biomass among different years. The temporal stability of the plant species was estimated using the ratio of the mean to standard deviation of the above-ground biomass of the species from 2013 to 2016 (Tilman, Reich, and Knops Citation2015).
One-way ANOVA with Duncan’s post hoc tests was used to estimate the effect of the addition of N and P on the concentration of N in the plant foliage. The data were log-transformed to normalize before ANOVA analysis (SPSS Version 13.0 for Windows; SPSS, Chicago, IL, USA). The relationships between H and species dominance and stability were estimated via linear regression with the major axis reduction method (R i386 version 3.0.3; R Development Core Team 2012).
Results
Foliar N and N:P ratio in different types of alpine plants
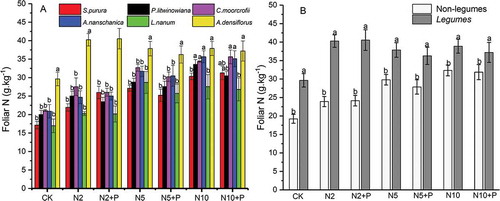
No significant difference was found in the concentration of N in foliage between the addition of N alone and the addition of both N and P among the different types of alpine plants (). The concentration of N in the foliage of all species except for A. densiflorus increased significantly as the amount of N increased. The concentration of foliar N of A. densiflorus did not change with the amount of N added (). Also, no significant difference was found in the concentration of N in foliage between the grasses and forbs (). The concentration of N in the foliage of A. densiflorus was significantly higher than in the foliage of other plants at low N additions (N2, N5), but not at high N addition (N10).
Figure 2. Changing in foliar N of six plant species response to N and P addition. Grasses: S. purpurea, P. litwinowiana; Sedge: C. moorcrofii; Forbs: A. nanschanica, L. nanum; Legume: A. densiflorus. Different lowercase letters above bars denote significant difference among treatments (p<0.05).
Figure 3. Changing of foliar N in six plant species with N and P addition (A) and the difference between Non-legumes (S. purpurea, P. litwinowiana; C. moorcrofii; A. nanschanica, L. nanum) and Legumes (A. densiflorus) (B). Different lowercase letters above bars denote significant difference among treatments (p<0.05).
The N:P ratios in plant foliage increased with the addition of N, but did not change significantly with the addition of both N and P (). The N:P ratio in foliage when N and P were added together was the same or less than the ratio present in the control plots.
Figure 4. N:P ratios in the foliage of different types of plants on the addition of N and P. Grasses: S. purpurea, P. litwinowiana; sedge: C. moorcrofii; forbs: A. nanschanica, L. nanum; and legume: A. densiflorus. Different lowercase letters above bars denote significant difference among treatments (p<0.05).
Characteristics of foliage HN values in different types of plants
The value of HN in S. purpurea (grass), P. litwinowiana(grass), C. moorcrofii (sedge), A. nanschanicaat (forb), and L. nanum (forb) was low, and varied from 1.72 to 1.96. Although the HN value for the foliage of A. densiflorus (legumes; 4.32) was higher than that of the other plants, it was not significant according to the relationship between the concentration of N in foliage and soil inorganic N (). The value of HN on the alpine steppe was much lower than that on temperate grasslands and grasslands with tall grasses ().
Table 1. Stoichiometric homeostasis (HN) for six alpine plant species.
Table 2. Foliage HN values for different plant genera in different types of grasslands.
Effect of foliage HN on species dominance and stability
At natural conditions without N addition, no significant relationship exists between HN and the coefficient of the variation of the biomass at the species level (R2 = 0.63, p = 0.22) and species dominance was not significantly correlated with HN (R2 = 0.69, p = 0.19). The temporal stability of the species was not significantly correlated with the foliage HN value of the species via linear regression (R2 = 0.56, p = 0.16). At the treatment with N addition, the species dominance also was not significantly related to the HN value of the foliage of each species on the addition of N (R2 = 0.68, p = 0.29).
Discussion
Foliar N and N:P ratios of different plant species in response to the addition of N and P
The foliar N of different plant species except for A. densiflorus increased with the N addition. A. densiflorus belong to the legume family, which have a symbiotic relationship with N2-fixing rhizobia bacteria that enables them to adapt to N-poor habitats (Vitousek et al. Citation2002). Therefore, the foliar N of A. densiflorus was little affected by the N addition. There also was a difference between A. densiflorus and other plant species in the N concentration of foliage in response to the addition of N and P. Phosphorus is an important component of energy pathways in cells and of genetic material, and is important in both plant metabolism and cellular replication (Marschner Citation1995). Therefore, the N concentration in foliage is no different between the addition of N alone and the addition of both N and P, which is similar to other studies (Wang et al. Citation2015; Gao et al. Citation2017).
The N:P ratio in foliage is an important indicator of growth in plants limited by either N or P (Koerselman and Meuleman Citation1996; Aerts and Chapin Citation1999; Güsewell Citation2004; Chen et al. Citation2013). The N:P ratio of plants on the alpine steppe increased significantly with the addition of N. However, the N:P ratio of plants on the alpine steppe was either the same as or less than that in the control group when N and P were added together. The above-ground biomass also significantly increased with the N addition, but it was not affected by the P-alone addition (Supplementary Material, Figure S1). These results suggest that plant growth in this alpine steppe environment is primarily limited by N, as reported previously in temperate grassland and alpine meadow ecosystems (Bai et al. Citation2004; Gao et al. Citation2017).
Foliage HN of different plant types on the alpine steppe
Plants with low H or high H values are expected to show a trade-off between fast growth and competitive ability (Yu et al. Citation2015). The value of HN in this alpine steppe environment ranged from 1.72 to 1.96, which is lower than the range of 3.60–9.76 for temperate grasslands and grasslands with tall grass (Yu et al. Citation2010, Citation2015; Dijkstra et al. Citation2012). For example, the HN of the genus Carex was 1.95 in this alpine steppe environment, but 5.03 in temperate grasslands and 4.45 in grasslands with tall grass. The value of HN of different plant species was low and there was no significant difference in this alpine steppe environment. However, the HN value of different plant types has previously been shown to have large differences in other grassland systems (Yu et al. Citation2010, Citation2015; Dijkstra et al. Citation2012). In grasslands with tall grass, plants with a low foliage HN value will increase in abundance with the addition of N (Yu et al. Citation2010). The N concentration in the foliage of all the species studied here was significantly increased with the addition of low concentrations of N (2 g m−2), except for L. nanum. and the absolute and relative growth rate of alpine species also increased with the N addition (Supplementary Material, Table S1, S2). These results suggest that alpine steppe plants with a low HN value can take advantage of nutrients when they are plentiful (Lambers and Poorter Citation1992; Yu et al. Citation2010). The high HN value of plant foliage will contribute to maintaining stable stoichiometric homeostasis in plant tissues in variable environments (Sterner and Elser Citation2002; Sardans, Rivas-Ubach, and Peñuelas Citation2012), which may represent an extra cost for plant growth in harsh alpine environments. Therefore, to adapt to alpine and low-nutrient environments, different plant types show the same nutrient-utilization strategies (low HN values) to cope with a variable and limited supply of nutrients (Reich, Walters, and Ellsworth Citation1997).
Effect of foliage HN on species dominance and stability
Stoichiometric homeostasis is considered to be an important factor in species dominance and stability (Elser et al. Citation2010; Yu et al. Citation2010). In this study, the HN value in foliage was neither significantly nor positively correlated with species dominance and stability on this alpine steppe, which is inconsistent with previously reported results for other grassland ecosystems (Yu et al. Citation2010, Citation2015). In temperate grasslands and grasslands with tall grass, species with a high HN value are more dominant and stable in infertile environments (Yu et al. Citation2015). However, in the alpine steppe, S. purpurea and C. moorcrofii had the highest dominance and stability in the community (). On the contrary, the HN value of their foliage was low and was the same as that of the other plant species. These results suggest that the HN value of foliage does not affect the species dominance and stability of plants in an alpine steppe environment. This is in contrast with previously reported results from temperate grasslands and grasslands with tall grass. Investigations of the community structure showed that the addition of N did not significantly affect the species composition (authors' own unpublished data). The results of the regression analysis showed that the HN value of foliage did not affect species dominance and that another mechanism is required to explain this.
Conclusions
In the present study, we found no difference in the value of HN among different types of plants, although the HN value in the foliage of different plant types was much lower than that of plants in temperate grasslands and in grasslands with tall grass. It is suggested that plants with a low H value in this alpine steppe environment are able to take advantage of nutrients when they are plentiful. The different types of plants show the same nutrient utilization strategies and adapt to the poor nutrient environment (low HN values). Therefore, stoichiometric homeostasis may have little effect on the dominance and stability of plant species.
Authors’ contributions
J.B.W. and X.D.W. designed the research; J.B.W. performed the research; J.B.W. wrote the paper, and X.D.W. provided editorial advice. All authors contributed critically to the drafts and gave final approval for publication.
Supplemental Material
Download Zip (205.6 KB)Disclosure statement
No potential conflict of interest was reported by the authors.
Supplementry material
Supplemental data for this article can be accessed here.
Additional information
Funding
Related Research Data
References
- Aerts, R., and F. S. Chapin III. 1999. The mineral nutrition of wild plants revisited: A re-evaluation of processes and patterns. Advances in Ecological Research 30:1–67.
- Bai, Y., X. Han, J. Wu, Z. Chen, and L. Li. 2004. Ecosystem stability and compensatory effects in the inner Mongolia grassland. Nature 431 (7005):181–84. doi:10.1038/nature02850.
- Bremner, J. M. 1996. Nitrogen: Total. In Methods of soil analysis part 3: Chemical methods, ed. A. L. Sparks, P. A. Page, P. N. Loeppert, M. A. Soltanpour, C. T. Tabatabai, and M. E. Sumner, 1085–123. Madison, Wisconsin, USA: Soil Science Society of America and American Society of Agronomy.
- Chen, Y., W. Han, L. Tang, Z. Tang, and J. Fang. 2013. Leaf nitrogen and phosphorus concentrations of woody plants differ in responses to climate, soil, and plant growth form. Ecography 36:178–84. doi:10.1111/more.2013.36.issue-2.
- Dijkstra, F. A., E. Pendall, J. A. Morgan, D. M. Blumenthal, Y. Carrillo, D. R. LeCain, R. F. Follett, and D. G. Williams. 2012. Climate change alters stoichiometry of phosphorus and nitrogen in a semiarid grassland. New Phytologist 196:807–15. doi:10.1111/j.1469-8137.2012.04349.x.
- Elser, J. J., W. F. Fagan, A. J. Kerkhoff, N. G. Swenson, and B. J. Enquist. 2010. Biological stoichiometry of plant production: Metabolism, scaling and ecological response to global change. New Phytologist 186:593. doi:10.1111/j.1469-8137.2010.03214.x.
- Gao, Z. B., H. Y. Wang, X. T. Lu, and Z. W. Wang. 2017. Effect of nitrogen and phosphorus addition on C:N P stoichiometry in roots and leaves of four dominant plant species in a meadow steppe of Hulunbuir. Chinese Journal of Ecology 36 (1):80–88. Abstract with English.
- Geng, Y., and J. S. He. 2014. Alpine climate alters the relationships between leaf and root morphological traits but not chemical traits. Oecologia 175:445–55. doi:10.1007/s00442-014-2919-5.
- Geng, Y., Z. Wang, C. Liang, J. Fang, F. Baumann, P. Kühn, T. Scholten, and J. S. He. 2012. Effect of geographical range size on plant functional traits and the relationships between plant, soil and climate in Chinese grasslands. Global Ecology and Biogeography 21:416–27. doi:10.1111/j.1466-8238.2011.00692.x.
- Güsewell, S. 2004. N: P ratios in terrestrial plants: Variation and functional significance. New Phytologist 164:243–66. doi:10.1111/j.1469-8137.2004.01192.x.
- He, J. S., X. Wang, B. Schmid, F. B. F. Dan, X. Li, P. B. Reich, and J. Fang. 2010. Taxonomic identity, phylogeny, climate and soil fertility as drivers of leaf traits across Chinese grassland biomes. Journal of Plant Research 123:551–61. doi:10.1007/s10265-009-0294-9.
- He, J. S., Z. Wang, X. Wang, B. Schmid, W. Zuo, M. Zhou, C. Zheng, M. Wang, and J. Fang. 2006. A test of the generality of leaf trait relationships on the Tibetan Plateau. New Phytologist 170,:835–48. doi:10.1111/j.1469-8137.2006.01704.x.
- Hessen, D. O., G. I. Ågren, T. R. Anderson, J. J. Elser, and P. C. D. Ruiter. 2004. Carbon, sequestration in ecosystems: The role of stoichiometry. Ecology 85:1179–92. doi:10.1890/02-0251.
- Hong, J., X. Wang, and J. Wu. 2015. Effects of soil fertility on the N:P stoichiometry of herbaceous plants on a nutrient-limited alpine steppe on the northern Tibetan Plateau. Plant and Soil 391 (1–2):179–94. doi:10.1007/s11104-015-2416-6.
- Jia, J. Y. 2008. Study of atmospheric wet deposition of nitrogen in Tibetan Plateau. Dissertation, Tibet University.
- Koerselman, W., and A. F. M. Meuleman. 1996. The vegetation N:P ratio: A new tool to detect the nature of nutrient limitation. Journal of Applied Ecology 33 (6):1441–50. doi:10.2307/2404783.
- Koojiman, S. A. L. M. 1995. The stoichiometry of animal energetics. Journal of Theoretical Biology 177:139–49. doi:10.1006/jtbi.1995.0232.
- Lambers, H., and H. Poorter. 1992. Inherent variation in growth rate between higher plants: A search for physiological causes and ecological consequences. Advances in Ecological Research 23:187–261.
- Marschner, H. 1995. Mineral nutrition of higher plants. Journal of Ecology 76:1250.
- Ordoñez, J. C., and M. Sykes. 2009. A global study of relationships between leaf traits, climate and soil measures of nutrient fertility. Global Ecology and Biogeography 18:137–49. doi:10.1111/j.1466-8238.2008.00441.x.
- Reich, P. B., M. B. Walters, and D. S. Ellsworth. 1997. From tropics to tundra: Global convergence in plant functioning. Proceedings of the National Academy of Sciences of the United States of America 94:13730–34.
- Sardans, J., A. Rivas-Ubach, and J. Peñuelas. 2012. The C:N:P stoichiometry of organisms and ecosystems in a changing world: A review and perspectives. Perspectives in Plant Ecology, Evolution, and Systematic 14:33–47. doi:10.1016/j.ppees.2011.08.002.
- Sterner, R. W., and J. J. Elser. 2002. Ecological stoichiometry: The biology of elements from molecules to the biosphere. Princeton, New Jersey, USA: Princeton University Press.
- Tilman, D., P. B. Reich, and J. M. Knops. 2015. Biodiversity and ecosystem stability in a decade-long grassland experiment. Nature 441:629–32. doi:10.1038/nature04742.
- Vitousek, P. M., K. Cassman, C. Cleveland, T. Crews, C. B. Field, N. B. Grimm, R. W. Howarth, R. Marino, L. Martinelli, and E. B. Rastetter. 2002. Towards an ecological understanding of biological nitrogen fixation. Biogeochemistry 57–58:1–45. doi:10.1023/A:1015798428743.
- Wang, M., T. Larmola, M. T. Murphy, T. R. Moore, and J. L. Bubier. 2015. Stoichiometric response of shrubs and mosses to long-term nutrient (N, P and K) addition in an ombrotrophic peatland. Plant and Soil 400 (1):1–14.
- Wang, S., J. Duan, G. Xu, Y. Wang, Z. Zhang, Y. Rui, C. Luo, B. Xu, X. Zhu, and X. Chang. 2012. Effects of warming and grazing on soil N availability, species composition, and ANPP in an alpine meadow. Ecology 93:2365–76.
- Yu, Q., H. Wu, N. He, X. Lü, Z. Wang, J. J. Elser, J. Wu, and X. Han. 2012. Testing the growth rate hypothesis in vascular plants with above- and below-ground biomass. PLoS ONE 7:e32162. doi:10.1371/journal.pone.0032162.
- Yu, Q., K. Wilcox, P. K. La, A. K. Knapp, X. Han, and M. D. Smith. 2015. Stoichiometric homeostasis predicts plant species dominance, temporal stability, and responses to global change. Ecology 96:2328–35.
- Yu, Q., Q. Chen, J. J. Elser, N. He, H. Wu, G. Zhang, J. Wu, Y. Bai, and X. Han. 2010. Linking stoichiometric homoeostasis with ecosystem structure, functioning and stability. Ecology Letters 13:1390–99. doi:10.1111/j.1461-0248.2010.01532.x.