
ABSTRACT
Gravel-pit lakes are a common feature of many human-modified landscapes throughout the world. In Canada’s north, they are often formed when gravel is extracted to construct dams, bridges, and highways. Past studies suggest that gravel-pit lakes differ from natural lakes in terms of their morphometry, water quality, and biological communities. In this study, we compared gravel-pit and natural lakes by sampling lakes between Inuvik and Fort McPherson in the Northwest Territories. We collected lake morphometry, water quality, and biological data (zooplankton, macroinvertebrates, and fish presence) from six gravel-pit lakes and fifteen natural lakes. In comparison to natural lakes, gravel-pit lakes were four times deeper, two times clearer, and five times smaller in their surface area. In addition, important nutrients, including phosphorus and nitrogen, were significantly lower in gravel-pit lakes. Despite the differences in morphometry and nutrients, pelagic zooplankton and littoral macroinvertebrate communities did not differ significantly between the two lake types. Therefore, we conclude that despite their recent formation and unnatural morphometry, gravel-pit lakes along the Dempster Highway can support invertebrate communities typical of natural lakes in the region.
Introduction
Industrial activity and the development of roadways throughout the Northwest Territories require the local mining of sand and gravel, leaving behind many abandoned gravel pits (borrow pits). Sand and gravel are extracted for use in the construction of buildings, dams, bridges, pipelines, and highways (Bayram and Önsoy Citation2014; Mollema and Antonellini Citation2016; Søndergaard et al. Citation2018). Government records available from the Gwich’in Land and Water Board reveal that gravel pits in northern Canada are typically used for the purposes of mineral exploration, geological mapping, the opening of roads, and highway maintenance. According to these records, there are eighteen gravel pits, now lakes, along the Dempster Highway in the Northwest Territories. Because of the construction of the highway during the 1970s, some of the earliest gravel pits opened in the mid-1970s and the extraction of material from most pits stopped during the 1990s. However, the demand for gravel mining in the region is expected to increase to accommodate the future construction associated with a growing population, increased resource development, and tourism. For example, the Inuvik-Tuktoyaktuk highway was completed in November 2017, providing road access to the southern coast of the Arctic Ocean, a region where significant development is anticipated (Kiggiak-EBA Consulting Ltd. Citation2011). Gravel extraction is also anticipated to continue in Canada’s north because of the ongoing maintenance of roadways built over permafrost and a dynamic active layer that experiences damaging freeze-thaw cycles.
Gravel-pit lakes are formed when an abandoned extraction pit floods naturally through an influx of groundwater, rainfall, and snowmelt, or through connections with nearby lakes (Gammons et al. Citation2009; Mollema and Antonellini Citation2016; Søndergaard et al. Citation2018). Although gravel-pit lakes are common features of landscapes in many parts of the world, their study has been neglected, and little is known about the development of these lake ecosystems following extraction activities (Gammons et al. Citation2009; Mollema and Antonellini Citation2016). Because of their young age and artificial construction, gravel-pit lakes can exhibit differences in important physical and chemical parameters in comparison with natural lakes (Boyes Citation1999; Hindák and Hindáková Citation2003). Past studies suggest that most gravel-pit lakes are oligotrophic, clear, and exhibit from neutral to alkaline pH levels (Hindák and Hindáková Citation2003; Søndergaard et al. Citation2018). Their artificial construction can lead to important morphometric differences. Artificial lakes created from mining or gravel-extraction activities tend to be deep with relatively flat bottoms and steep sides, creating a high depth-to-surface area ratio (Kalin et al. Citation2001; Blanchette and Lund Citation2016; Mollema and Antonellini Citation2016). The depth-to-surface area ratio for gravel-pit lakes ranges from 10 percent to 40 percent, while natural lakes have a ratio of less than 5 percent (Mollema and Antonellini Citation2016). These differences between gravel-pit and natural lakes can lead to differences in the types of biological communities that these lakes support. Most gravel-pit lakes are unlikely to support a high diversity of species in comparison with natural oligotrophic or mesotrophic lakes because of low nutrient levels (Gammons et al. Citation2009). The young age of gravel-pit lakes may also contribute to decreased biodiversity because they have less time to accumulate species and proceed through the successional cycles exhibited by many older natural lakes (Lipsey Citation1980; Ejsmont-Karabin Citation1995; Hindák and Hindáková Citation2003; Alfonso et al. Citation2010). The high depth-to-surface area ratio of gravel-pit lakes leaves little room for littoral macrophytes, which act as important habitat for many invertebrates and play a key role as refuges and breeding habitats for fish (Scheffer Citation1999). As a result, benthic communities in gravel-pit lakes may be typical of deep, poorly lit profundal habitats (Gammons et al. Citation2009). Despite these noted generalities, gravel-pit lakes can vary in their physical, geochemical, and ecological characteristics in relation to local climate and watershed characteristics (Gammons et al. Citation2009).
The composition of biological communities in gravel-pit lakes will be influenced by the natural biological diversity in nearby water bodies, the physical conditions within each lake, as well as dispersal and colonization processes (Beisner et al. Citation2006; Allen and VanDyke Citation2011; Audet, MacPhee, and Keller Citation2013). Zooplankton and phytoplankton can disperse to gravel-pit lakes using several vectors, including movement through streams, attachment to vertebrates, insects, and through heavy wind and rain events (Jenkins and Buikema Citation1998). In the Northwest Territories there are a variety of vertebrate vectors, including the black bear (Ursus americanus), grizzly bear (Ursus arctos), beaver (Castor canadensis), ruddy duck (Oxyura jamaicensis), herring gull (Larus argentatus), and the common loon (Gavia immer). However, the colonization of newly formed lakes may occur slowly for zooplankton, as many studies have identified low dispersal rates for this group (Jenkins and Buikema Citation1998; Gray and Arnott Citation2011). Macroinvertebrates are less likely to be limited by dispersal, because a variety of species can colonize via their adult aerial phase (Bilton, Freeland, and Okamura Citation2001; Van de Meutter, De Meester, and Stoks Citation2007). Exceptions to this generalization are organisms without an aerial phase, such as oligochaetes and amphipods. The colonization of fish requires either stream connections to natural lakes or intentional stocking efforts, and will occur slowly without human intervention (Shurin, Cottenie, and Hillebrand Citation2009; Søndergaard et al. Citation2018). In general, past studies show that the distribution of larger organisms, such as fish, are more strongly limited by dispersal, while lower trophic levels, such as macroinvertebrates, zooplankton, and phytoplankton, disperse more readily (Beisner et al. Citation2006). However, dispersal and colonization processes for all taxonomic groups take time to play out (Louette, De Meester, and Declerck Citation2008; Shurin, Cottenie, and Hillebrand Citation2009; Gray and Arnott Citation2011); therefore, younger gravel pits may have lower levels of biological diversity in comparison to older systems (Lipsey Citation1980).
To explore the role of gravel-pit lakes as habitat for aquatic invertebrate species, we investigated whether there are differences in lake morphometry, water quality, and biological communities between gravel-pit lakes and natural lakes. More specifically, this study aims to (1) investigate differences in water-quality and morphometric characteristics between six gravel-pit lakes and fifteen natural lakes along the Dempster Highway; (2) evaluate differences in zooplankton and macroinvertebrate communities between lake types; and (3) understand relationships among biological, morphometric, and water-quality variables in both natural and gravel-pit lakes. Based on the few studies that have been conducted in the past, we hypothesized that (1) gravel-pit lakes will be deeper, clearer, nutrient poor, and less productive in comparison to natural lakes (Søndergaard et al. Citation2018); (2) species abundance, richness, and diversity will be lower in gravel-pit lakes for both macroinvertebrates and zooplankton owing to their young age (Lipsey Citation1980; Ejsmont-Karabin Citation1995; Hindák and Hindáková Citation2003; Alfonso et al. Citation2010) and low nutrient levels (Dodson, Arnott, and Cottingham Citation2000); and (3) macroinvertebrate and zooplankton community composition will differ between gravel-pit lakes and natural lakes owing to morphometric and water-quality differences such as water clarity, nutrient availability, and depth (Blanchette and Lund Citation2016; Mollema and Antonellini Citation2016).
Methods
Study area
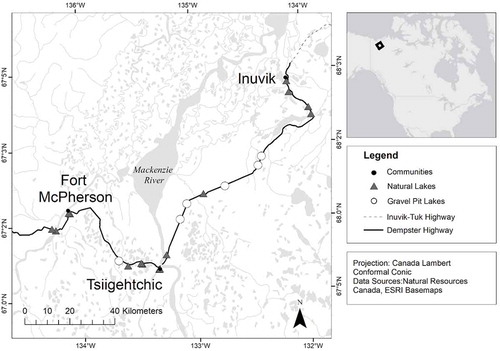
This study was conducted between August 17 and September 1, 2017, along the Dempster Highway, which runs between Fort McPherson and Inuvik within the Gwich’in Settlement Area, Northwest Territories (). This study area was chosen because of the accessibility of both gravel-pit lakes and natural lakes along the highway. We sampled six gravel-pit lakes and fifteen natural lakes with surface areas less than 100 ha for morphometric, water-quality, and biological data (, ). The lakes are located in an area of boreal forest dominated by coniferous trees, such as black spruce (Picea mariana), white spruce (Picea glauca), and jack pine (Pinus banksiana; Sweetman, Rühland, and Smol Citation2010). While visiting each lake we recorded subjective visual observations of the submerged, emergent, and shoreline vegetation present (). The region is underlain by discontinuous permafrost, covering between 50 percent and 90 percent of the total area, and the landscape includes a mix of morainal, glaciofluvial, lacustrine, and alluvial deposits (Kokelj, Zajdlik, and Thompson Citation2009). Recent climate change has had a substantial impact on permafrost (active-layer depth), landscape structure, and vegetation (Burn and Kokelj Citation2009; Kokelj, Zajdlik, and Thompson Citation2009; Lantz, Gergel, and Kokelj Citation2010). Most of our study lakes were located along remote stretches of highway, and therefore receive drainage primarily from a landscape of coniferous trees, peat hummocks, bogs, and small lakes extending on either side of the road. Based on our observations in the field, only six lakes had a noticeable inflow of water during our July/August fieldwork. Three of the study lakes are located in the town of Inuvik (population ~3,200) and two near the hamlet of Fort McPherson (population ~700), which could leave them vulnerable to nutrient pollution (). It is difficult to provide an exact age for the lakes sampled in this study; however, it is likely that the natural lakes are much older than the gravel-pit lakes. The gravel pits along the Dempster Highway are estimated to be approximately twenty-five to thirty years old based on closing dates recorded in government records available from the Gwich’in Land and Water Board. Natural lakes in this region could have formed as early as from approximately 30,000 years ago, when the Laurentide Ice Sheet receded, to approximately 13,000 years ago, during the Last Glacial Maximum (Dredge and Thorleifson Citation1987; Hill Citation1996). Although the construction of the highway may have changed the hydrology for some lakes in the region (Trombulak and Frissell Citation2000; Kiggiak-EBA Consulting Ltd. Citation2011), an examination of historical maps shows that all the natural lakes we sampled were present on the landscape prior to highway construction (Department of Energy, Mines and Resources Citation1973).
Table 1. Morphometric, water quality, and visually estimated vegetation characteristics of natural lakes and gravel-pit lakes sampled along the Dempster Highway in August 2017. SD = standard deviation.
Figure 1. Map of lakes sampled along the Dempster Highway between Fort McPherson and Inuvik, Northwest Territories.
Morphometry and water quality
Morphometric variables included surface area, mean depth, and maximum depth. These variables were measured by constructing bathymetric maps of each lake using a Humminbird Helix 5 chartplotter (Johnson Outdoors Marine Electronics, Inc.), in combination with Reefmaster bathymetry software (Reefmaster Ltd.). Drainage basin area was determined for each lake using the basin tool in ArcMap version 10.5 (Esri Inc.), using 2 m resolution digital elevation maps (Porter et al. Citation2018). Water-quality variables included Secchi depth (water clarity), turbidity, conductivity, dissolved oxygen (DO), pH, total nitrogen (TN), total phosphorus (TP), total organic carbon (TOC), calcium, chlorophyll-a, and water temperature (). At the point of maximum depth in each lake, a Manta+ multiparameter probe (Eureka Water Probes) was deployed from the boat to measure turbidity, conductivity, DO, pH, and temperature at 1 m depth from the surface. A Secchi disk was deployed over the shady side of the boat to obtain water-clarity measurements. In addition, a 1 L water sample was collected from each site at the deepest point of the lake using a 3 m polyethylene integrated tube sampler that collected a sample throughout the top 3 m of the water column. At the Center for Cold Regions and Water Science at Wilfrid Laurier, the Perkin Elmer Optima 8000 Inductively Coupled Plasma Optical Emission Spectroscopy (ICP-OES) was used to measure calcium concentrations. The Shimadzu TOC-LCPH carbon and nitrogen analyzer (Shimadzu Corp.) was used to measure TN and TOC, because it is capable of measuring a variety of carbon species and total nitrogen in liquid samples. Unfortunately, total phosphorus levels were below the detection limit for the ICP-OES (4 µg/L), and so could not be determined from the 2017 samples. Low phosphorus levels have also caused difficulty in previous studies conducted in this region (e.g., Scott et al. Citation2011). Our TN levels from the 2017 samples were also implausibly low, possibly the result of an instrument calibration error. To rectify these issues, we returned to our study lakes between July 26 and August 5, 2018, and collected shoreline water samples for measurement of TP and TN. Samples for TP were digested in an autoclave with ammonium persulfate and sulfuric acid, following EPA method 365.1. We then followed SEAL method G-103-93 to measure TP colorimetrically using a SEAL Continuous Segmented Flow Analyzer (SEAL Analytical, Inc.). Estimates of TN concentrations for the 2018 samples were obtained as described previously. Chlorophyll-a data were also obtained by collecting a 250 mL water sample from the shoreline in 2018. Samples were filtered using Fisherbrand G4 glass fiber filters, and chlorophyll-a was extracted from the filters using methanol and was analyzed using a fluorometer (Turner TD700) at Queens University (Symons, Arnott, and Sweetman Citation2012).
Zooplankton and macroinvertebrate communities
Zooplankton samples were collected from each lake at the point of maximum depth and were preserved on site using 95 percent ethanol. For lakes greater than 3 m in depth, a single vertical haul using a 35 cm diameter, 50 μm mesh-size zooplankton net was collected from each sample site. For shallow lakes less than 3 m in depth, where a vertical tow was not possible, a horizontal tow was collected by towing the net behind the boat for approximately sixty seconds. In both cases, a mechanical flowmeter attached to the mouth of the net was used to determine the volume of water that passed through the net. To calculate zooplankton densities, the number of individuals in each sample was divided by the volume of sampled water. In the laboratory, individuals were identified to the species level according to Aliberti et al. (Citation2013), using a magnification of 40–400× depending on the size of the species. Zooplankton were collected from all fifteen natural lakes and from five of the six gravel-pit lakes in 2017 (one sample container was damaged during shipping). A zooplankton sample from the missing gravel pit was collected in August 2018 and added to our data set.
Littoral macroinvertebrate samples were collected using a modified version of the Ontario Benthic Biomonitoring Network (OBBN) protocol (Jones et al. Citation2007). Samples were collected using a 500 μm D-net to kick and sweep macroinvertebrates. Between one and three replicate samples were taken along perpendicular transects from the shore. For each replicate, approximately 1 m2 of the bottom was sampled. The protocol was modified from the standard OBBN in that each replicate was collected for only three minutes and replicates were not taken from random shoreline locations on the lake. We used a three-minute kick and sweep per replicate rather than a ten-minute collection because the abundance of organic matter on the bottom of most natural lakes quickly clogged the D-net, preventing further sample collection. The inability to sample from random locations along the shoreline stemmed from the boggy terrain, which made it extremely difficult to walk the shoreline without sinking several feet into the peat. Each sample was preserved in 95 percent ethanol and was brought back to the laboratory for identification. Macroinvertebrates were identified to the order and family level according to the OBBN tally sheet (Jones et al. Citation2007). Macroinvertebrates were collected from all fifteen natural lakes and from five of the six gravel-pit lakes.
To determine fish presence and absence in lakes, we used a combination of visual fish observations, surveys with gill nets, and the presence or absence of the phantom midge Chaoborus americanus (Sweetman and Smol Citation2006). Fish presence was confirmed using gill nets in nine natural lakes and one gravel-pit lake, and by observation in a second gravel-pit lake. Fish presence or absence was inferred in an additional eleven lakes based on the presence or absence of C. americanus, which are a prevalent species found in northern lakes but are not known to coexist with fish (Sweetman and Smol Citation2006). Of these eleven lakes, fish presence was likely in three natural lakes and two gravel-pit lakes, whereas the remaining lakes were deemed unlikely to support fish. Where fish sampling occurred, methods followed the Ontario Broadscale Monitoring (BSM) protocol, which incorporates a standardized study design using large- and small-mesh gill nets (Sandstrom, Rawson, and Lester Citation2013). Large-mesh nets target large-bodied fish generally greater than 20 cm in size, and small-mesh gill nets target small-bodied fish less than 20 cm. Gill nets were distributed over varying lake strata depths according to the BSM protocol for a duration of 16–22 h.
To compare species richness and species diversity among lakes, we used indices that correct for differences in sample size (number of individuals identified) among lakes. For richness, we used rarefaction to calculate values that reflect an equal taxonomic/sampling effort for each lake (Hurlbert Citation1971). Rarefaction accounts for differences in sampling effort by resampling abundance data for a particular site hundreds or thousands of times to determine the average number of species identified for a given number of individuals collected (Gotelli and Colwell Citation2001). For zooplankton species richness we rarefied communities to 142 individuals, which was the lowest number of individuals identified from a single lake. Similarly, for macroinvertebrate taxa we rarified to 189 individuals for each lake. Rarefaction was conducted using the rarefy function in the vegan package for R (Oksanen et al. Citation2016), which is based on the formulation by Hurlbert (Citation1971). Similarly, the diversity index used corrected for differences in taxonomic/sampling effort. Diversity was calculated according to Chao’s method for calculating rarified Hill numbers (Chao et al. Citation2014). We used the estimateD function in the iNEXT package for R to calculate rarified order 1 Hill numbers representative of the exponential of Shannon’s entropy index (Hsieh, Ma, and Chao Citation2016).
Statistical analyses
Welch’s t tests were used to test for differences in morphometric, water quality, and biological variables associated with our first two hypotheses. Welch’s t tests are an adaptation of the student’s t test for circumstances where unequal variances and sample sizes are encountered (Welch Citation1947). Data used for all t tests was tested for normality by performing Shapiro-Wilks tests. If data were not normally distributed, transformations were applied to meet this assumption. To meet assumptions of normality, turbidity, TOC, conductivity, chlorophyll-a, zooplankton abundance, and macroinvertebrate abundance were log transformed, while TN was square-root transformed. Levene’s test was used to test for homogeneity of variances (the data for all tests passed this assumption). Bonferroni corrections were used to deal with the problem of inflating type I error when conducting multiple independent t tests.
To provide additional insight into our first hypothesis regarding physicochemical differences between natural and gravel-pit lakes, we performed a principal component analysis (PCA) to visualize differences in morphometric and water-quality variables among lakes. A PCA is a linear indirect gradient analysis that reduces multidimensional data into a set of compound axes (Dytham Citation2011). The first PCA axis explains the most variation, followed by the second axis, and so on (Dytham Citation2011). As a result, the first few PCA axes will typically explain the most variation in a data set, and sites (lakes) located closer together on an ordination plot will have similar environmental characteristics. Morphometry and water-quality variables were standardized to a zero-mean and unit variance using the decostand function in the vegan library in R. The PCA was conducted using the prcomp() function in the stats package for R (Borcard, François, and Legendre Citation2011). Ordination plots for the first two PCA axes were generated to visualize differences in morphometry and water quality among lakes.
Redundancy analysis (RDA) was used to identify the morphometric and water-quality variables that may influence zooplankton and macroinvertebrate community structure. Redundancy analysis is a multivariate method used to extract and summarize variation in a set of response variables that can be explained by a set of predictor variables (McArdle and Anderson Citation2001). In this case, the response variables were zooplankton or macroinvertebrate species abundances by lake and the predictor variables were a corresponding series of spatial (latitude), morphometric (mean depth, maximum depth, lake surface area), biological (fish presence or absence), and water-quality variables (DO, turbidity, Secchi depth, pH, temperature, conductivity, calcium, TOC, TP, chlorophyll-a, and TN). Lake surface temperatures declined slightly during the course of our sampling period because of changes in air temperature, so the effects of lake temperature were removed prior to analysis by conducting a partial RDA using lake temperatures as a conditioning variable. It was expected that gravel-pit lakes would separate from natural lakes on the biplots owing to differences in community composition associated with predictor variables such as water clarity, nutrient availability, and depth. A stepwise variable selection procedure based on Akaike Information Criterion (AIC) values was used to identify variables that were significantly related to the biological data (Burnham and Anderson Citation2004). The stepwise selection was implemented using the ordistep function in the vegan package for R (Oksanen et al. Citation2016). To test for collinearity among predictor variables, the variance inflation factor (VIF) was calculated using the vif function in vegan (no variables had a VIF > 5; Oksanen et al. Citation2016).
Results
Morphometry and water quality
A significant amount of variation exists in morphometry and water-quality variables among our study lakes (). In terms of morphometry, gravel-pit lakes were significantly deeper, with a mean depth four times greater than that of natural lakes ( and , ). Gravel-pit lakes also had a smaller surface area, with the mean surface area for gravel-pit lakes being five times smaller than natural lakes (). For water quality, gravel-pit lakes were clearer than natural lakes, having Secchi depths twice as deep as natural lakes and turbidity values one-quarter that of natural lakes (, ). Total nitrogen concentrations were twice as high in natural lakes compared to gravel-pit lakes and TP was 1.5 times higher in natural lakes (; ). However, gravel-pit lakes and natural lakes had similar values for pH, water temperature, DO, conductivity, chlorophyll-a, TOC, and calcium ( and , , ). The first two axes of the PCA explained 55.3 percent of the variation among lakes (). Gravel-pit lakes are found in the upper-left quadrant of the ordination plot and are characterized as deep lakes with a small surface area, high water clarity, and lower nutrients ().
Table 2. Results of Welch’s t tests comparing selected water-quality and physical variables. t tests were conducted only for variables associated with our three hypotheses. The Bonferroni p value is corrected for eight tests. df = degree of freedom.
Figure 2. Comparison of selected morphometric and water-quality variables between natural and gravel-pit lakes. Bolded line = median; lower end of box = first quartile; upper end of box = third quartile; whiskers = range of data; dots = outliers.
Figure 3. Principal component analysis (PCA) conducted with morphometry and water-quality data for each of our twenty-one study lakes. Circles represent gravel-pit lakes and triangles represent natural lakes. Sites that are closer together tend to have similar morphometry and water quality than sites that are farther apart. The angle between the arrows reflects the correlation between predictor variables. Gravel pits tend to cluster in the upper-left quadrant of the PCA, indicating that they are deeper, clearer (high Secchi depth, low turbidity), smaller in area, and have low nutrient concentrations.
Zooplankton and macroinvertebrate communities
Species abundance, richness, and diversity for both zooplankton and macroinvertebrates were similar in gravel-pit and natural lakes (; Welch’s t tests p > 0.1 in all cases). Fish presence or absence, mean depth, Secchi depth, turbidity, and latitude were significant predictors of zooplankton community composition with the first two RDA axes explaining 38.4 percent of the variation (, F = 2.68, p < 0.005, adjusted R2 = 0.29). The RDA suggests that species of Daphnia were associated with deeper lakes and cyclopoid copepods were more abundant in shallow lakes. Additionally, the calanoid copepod Skistodiaptomus pallidus was abundant in fishless, less turbid lakes. The final RDA model for macroinvertebrates included chlorophyll-a, fish presence or absence, and mean depth as significant predictors, and the first two axes accounted for 21.24 percent of variation in communities (, F = 1.59, p < 0.05, adjusted R2 = 0.08). The RDA hinted that Gastropoda may be positively associated with fish absence, and Hemiptera with mean depth, but for the most part, distinct correlations between macroinvertebrate species and predictor variables were not observed.
Figure 4. Comparison of rarefied species richness, diversity (Hill numbers), and abundance of zooplankton and macroinvertebrates in natural lakes and gravel-pit lakes.
Figure 5. Results of redundancy analyses displaying predictor variables (morphometry and water quality) with zooplankton (A) and macroinvertebrate (B) abundances as response variables. Circles represent gravel-pit lakes, triangles represent natural lakes. Species are represented by their text labels. Morphology and water-quality variables are represented by arrows. Sites that are closer together in the ordination plot have similar species composition than sites that are further apart.
Discussion
Gravel-pit lakes were markedly different in their morphometry and in several water-quality characteristics compared to natural lakes but, surprisingly, zooplankton and macroinvertebrate communities did not differ between lake types. The relatively deep basins and low nutrient, chlorophyll-a, and turbidity levels in gravel pits supported our first hypothesis that these lakes would be deep, clear, nutrient poor, and less productive. However, our data provided no support for our two biological hypotheses. Species richness, species diversity, and abundance for zooplankton and macroinvertebrates were not lower in gravel-pit lakes, providing no support for our second hypothesis. Finally, community structure for zooplankton and macroinvertebrates did not differ between lake types, lending no support to our third hypothesis that differences in morphometry and water-quality characteristics would lead to differences in community structure.
Morphometry and water quality
The values obtained for our morphometric variables were consistent with other studies, as gravel-pit lakes were significantly deeper than natural lakes (Mollema et al. Citation2015; Søndergaard et al. Citation2018). Gravel-pit lakes also had a smaller surface area than natural lakes, consistent with the idea that these artificial lakes typically have a higher depth-to-surface area ratio (Blanchette and Lund Citation2016). The reason that most gravel pits conform to this structure is that deep pits allow for a large extraction volume while minimizing cost and disturbance to terrestrial landscapes (Blanchette and Lund Citation2016). Low levels of turbidity and high Secchi depths for gravel pits are likely the result of interactions among morphometry, nutrients, and organic carbon. Shallow lakes are often turbid because of wave action, which causes resuspension of bottom sediments, resulting in minerogenic turbidity (Bloesch Citation1995). Although we have no direct measurements of sediment resuspension for these lakes, the depth of gravel pits in our study (mean = 6.40 m) likely means that the resuspension of bottom sediments through wave action is less frequent than for the natural lakes (mean depth = 1.62 m). Water clarity is also influenced by biological production in a lake. Chlorophyll-a concentrations were lower in gravel pits in comparison to natural lakes (although not after Bonferroni correction) and gravel-pit lakes had significantly lower TN and TP concentrations than natural lakes. These differences indicate that gravel pits are relatively unproductive in comparison with natural lakes (Brylinsky and Mann Citation1973; Smith Citation1982). Finally, TOC levels were lower in gravel-pit lakes (although not after Bonferroni correction), suggesting that water coloration resulting from dissolved organic substances was also lower in gravel-pit lakes. Decreasing terrestrial biomass has been associated with decreases in lake TOC levels, so we suspect that lower TOC levels may be related to the clearing of vegetation in the watershed in concert with the development of the gravel pits (Pienitz, Smol, and Lean Citation1997; Rühland et al. Citation2003).
The water-quality measurements for the twenty-one lakes in our study generally conformed well with previous studies in the region. The pH of lakes in this region was found to range between 6.9–7.6 in previous studies (Swadling, Pienitz, and Nogrady Citation2000; Kokelj, Zajdlik, and Thompson Citation2009; Houben et al. Citation2016), which falls into the range for our twenty-one lakes (6.1–8.5). Total organic carbon levels measured in thirty-nine lakes by Kokelj, Zajdlik, and Thompson (Citation2009) averaged 16.1 mg/L, falling between our recorded concentrations for natural and gravel-pit lakes, which had mean TOC concentrations of 22.2 and 15.3 mg/L, respectively. The mean chlorophyll-a concentration in natural lakes was 1.25 μg/L and in gravel-pit lakes was 0.38 μg/L, which fell within the range measured by Houben et al. (Citation2016) where concentrations ranged from 0.20 μg/L to 19.60 μg/L. Our calcium levels had a slightly higher range compared to Houben et al. (Citation2016), Kokelj, Zajdlik, and Thompson (Citation2009), and Swadling, Pienitz, and Nogrady (Citation2000). We measured Ca levels between 8.1 mg/L and 52.5 mg/L, while the aforementioned studies found mean concentrations ranging between 8.6 mg/L and 31.4 mg/L. Conductivity was slightly elevated compared to previous studies by Houben et al. (Citation2016) and Kokelj, Zajdlik, and Thompson (Citation2009), who found mean conductivity levels of 108.8 μS/cm and 259.1 μS/cm, respectively. The slightly higher range for calcium, and the elevation of conductivity compared to previous studies, may be attributed to the fact that all sites were located along the Dempster Highway, a significant source of calcareous dust (Gunter Citation2017). Our TN levels, which ranged from 0.13 mg/L to 0.98 mg/L, were similar to those concentrations measured by Houben et al. (Citation2016), where concentrations ranged from 0.13 mg/L to 0.73 mg/L, and Swadling, Pienitz, and Nogrady (Citation2000), whose TN concentrations ranged from 0.25 mg/L to 1.58 mg/L. Our TP levels, which ranged from 22.97 μg/L to 85.56 μg/L, were also similar to those concentrations measured by Houben et al. (Citation2016), where concentrations ranged from 6.40 μg/L to 67.90 μg/L.
Zooplankton and macroinvertebrate communities
Our results did not support the hypothesis that gravel-pit lakes contain lower zooplankton richness and diversity because of their younger age. These results contrast with those of Lipsey and Malcom (Citation1981), where zooplankton were collected from seven gravel-pit lakes. In that study, older pit lakes had a greater species richness and diversity than newer ponds (Lipsey and Malcom Citation1981). In a separate study, a similar relationship between lake age and diversity was also found for phytoplankton (Lipsey Citation1980). Other studies also show relationships between age and plankton diversity in artificial lakes (Ejsmont-Karabin Citation1995; Dodson et al. Citation2007; Alfonso et al. Citation2010). In our study, we may have failed to detect a difference between natural lakes and gravel pits because of the relatively old age of the gravel pits (minimum, approximately twenty-five years; AlecSandra MacDonald, Gwich’in Land and Water Board, personal communication). Both Ejsmont-Karabin (Citation1995) and Alfonso et al. (Citation2010) found that differences could be detected on the time scale of one to three decades, but past that point dispersal and colonization processes allowed artificial lakes to achieve an equilibrium number of species. The age of the gravel pits in Lipsey and Malcom (Citation1981) and Lipsey (Citation1980) varied between one and thirteen years, a time frame where differences in diversity based on age would be most evident (Ejsmont-Karabin Citation1995; Alfonso et al. Citation2010).
We also hypothesized that the structure of zooplankton communities (relative abundance of species) would differ between gravel-pit lakes and natural lakes, owing to differences in morphometry and water quality. However, our ordinations did not display any obvious differences between the lake types. When developing this hypothesis, we assumed that the physical parameters that differed between the two lake types would be important for structuring zooplankton communities. Significant differences between lake types were evident for lake depth, water clarity, TP, and TN. Our redundancy analysis identified mean depth and water-clarity variables (Secchi depth and turbidity) as significant predictors of community structure, but not TP or TN. It is likely that the difference in community structure between lake types did not materialize as expected because other physical variables that did not differ between lake types were also controls on community structure. For example, in our redundancy analysis for zooplankton, latitude was significant but did not consistently differ between lake types. Other northern studies have identified temperature, dissolved organic carbon, fish presence or absence, phytoplankton (chlorophyll-a), and total phosphorus as major controls on zooplankton community structure (Moore Citation1978; Sweetman and Smol Citation2006; Richardson Citation2008; Schilling, Loftin, and Huryn Citation2009; Sweetman, Rühland, and Smol Citation2010). It is possible that our study did not include a large enough gradient (range) for those variables such that they would be selected as significant in our statistical analyses.
We also expected macroinvertebrate communities to differ between gravel-pit and natural lakes, owing to the relatively young age of the former and differences in morphometric and water-quality variables. However, our analyses did not find a significant difference in richness, diversity, or abundance between lake types. Similar to zooplankton, the relatively old age of these gravel pits may suggest that enough time has passed for most macroinvertebrate species to colonize these systems, leaving no difference in diversity metrics. This idea is supported by previous studies that have demonstrated rapid colonization of new habitats by benthic invertebrates (Voshell and Simmons Citation1984; Layton and Voshell Citation1991; Bass Citation1992). The taxonomic resolution used for macroinvertebrates may also offer an explanation, because this group was identified to the order and family level, which perhaps was too coarse to reveal differences in richness or diversity between lake types. As with the zooplankton, our ordination did not reveal differences in the structure of macroinvertebrate communities between natural and gravel-pit lakes. In our RDA, chlorophyll-a, fish presence or absence, and mean depth were selected as significant predictors of community structure for macroinvertebrates. Chlorophyll-a levels and mean depth did differ significantly between gravel pits and natural lakes, but the low percentage of variation explained by the model (21.2%), suggests that macroinvertebrates are likely structured by variables that we did not measure.
Future directions
While we believe that our study design allowed us to test our hypotheses, there are some obvious limitations. Accessing a large number of lakes in isolated northern environments is difficult, and therefore we were only able to assemble a data set of fifteen natural lakes and six gravel-pit lakes that were accessible by the highway. Given this relatively small sample size, we considered running a power analysis to identify whether biological differences between our lake categories (gravel pit versus natural) did exist, but were not statistically different because of low power. However, there did not appear to be obvious differences in means for most variables (e.g., richness), which would suggest a difference was present but not detected because of low power. Our study was also limited in that we chose to focus on pelagic zooplankton and littoral macroinvertebrates, but excluded littoral zooplankton and profundal macroinvertebrates. It is possible that future studies exploring differences in profundal macroinvertebrate communities could find a difference between gravel pits and natural lakes, especially given differences in depth between these two lake types. Finally, the redundancy analysis for our macroinvertebrates explained only 21 percent of variation in those communities. Although this level of explained variation is common in many studies (e.g., Tolonen et al. Citation2018), some studies have been able to explain in excess of 40 percent of the variation in macroinvertebrate communities (e.g., Dos Santos et al. Citation2016). This suggests that future work measuring additional predictor variables that are relevant for littoral macroinvertebrates communities could be fruitful (e.g., sediment types).
How should we view gravel pits in the context of environmental management?
Gravel extraction has several potential negative impacts, including the destruction of terrestrial habitats and the exposure of groundwater to pollution and evaporative losses (Mollema and Antonellini Citation2016; Søndergaard et al. Citation2018). In northern permafrost-laden areas, specifically, cutting into the ground to extract gravel could lead to a change in the air–surface temperature balance, promoting slumping and erosion in adjacent areas (Kiggiak-EBA Consulting Ltd. Citation2011). However, the results of this study and others suggest that the end result of gravel extraction is not entirely negative. In this study, gravel-pit lakes were found to provide an adequate simulation of natural lakes for both littoral macroinvertebrates and pelagic zooplankton. This is consistent with other studies that suggest that gravel-pit lakes can have ecological value by providing habitat for aquatic species, increasing biodiversity (Ejsmont-Karabin Citation1995; Gammons et al. Citation2009; Alfonso et al. Citation2010). In addition to their ecological value, gravel-pit lakes can be used for recreational purposes, including boating, fishing, and swimming (Søndergaard et al. Citation2018). In some parts of the world expected to experience climate change–related shortages of freshwater supplies, gravel-pit lakes may even increase the availability of surface water (Fang et al. Citation2010).
Conclusions
In summary, gravel-pit lakes differed in key morphometric and water-quality parameters in comparison with natural lakes; however, littoral macroinvertebrate and pelagic zooplankton communities were similar. Gravel-pit lakes were clearer and deeper with lower nutrient levels. Despite these differences in morphometry and water quality, zooplankton and macroinvertebrate communities did not differ in richness, diversity, abundance, or structure between the two lake types. Our results suggest that gravel-pit lakes along the Dempster Highway provide habitat that is of similar quality to natural lakes. The increasing pressure of northern development brings with it both economic growth and the potential for negative environmental effects. However, anthropogenic by-products, such as gravel-pit lakes, may also yield unexpected positive effects for freshwater resources and the people that depend on them.
Acknowledgments
This work was carried out under Northwest Territories Scientific License number 16126. We would like to thank the Gwich’in Renewable Resources Board and the Renewable Resource Councils in Fort McPherson, Tsiigehtchic, and Inuvik for supporting the project. L. Waters, Y. Langille, C. Tward, L. Lopez, and M. Teillet assisted with field data collection. Alexandra MacDonald at the Gwich’in Land and Water Board provided access to government records on gravel pits and historical topographical maps of the region. Logistics support was provided by the Aurora Research Institute. G. Braun and Dr. H. Gray at The Center for Cold Regions and Water Science Analytical Laboratory provided assistance with Ca, TN, TOC, and TP measurement. Dr. S. Arnott assisted with analysis of chlorophyll-a concentrations. Funding was provided by the Northwest Territories Cumulative Impacts Management Program under project CIMP197 and by Wilfrid Laurier University.
Disclosure statement
No potential conflict of interest was reported by the authors.
Additional information
Funding
References
- Alfonso, G., G. Belmonte, F. Marrone, and L. Naselli-Flores. 2010. Does lake age affect zooplankton diversity in Mediterranean lakes and reservoirs? A case study from Southern Italy. In Fifty years after the ‘‘Homage to Santa Rosalia’’: Old and new paradigms on biodiversity in aquatic ecosystems, 149–64. Dordrecht: Springer. doi:10.1007/s10750-010-0350-4.
- Aliberti, M. A., E. Allan, S. Allard, D. J. Bauer, W. Beagen, S. R. Bradt, B. Carlson, S. C. Carlson, U. M. Doan, J. Dufresne, et al. 2013. An image-based key to the zooplankton of North America. http://cfb.unh.edu/cfbkey/html/.
- Allen, M., and J. VanDyke. 2011. Metacommunity assembly and sorting in newly formed lake communities. Ecology 92:269–75. doi:10.1890/10-0522.1.
- Audet, C., S. MacPhee, and W. Keller. 2013. Colonization of constructed ponds by crustacean zooplankton: Local and regional influences. Journal of Limnology 72:43. doi:10.4081/jlimnol.2013.e43.
- Bass, D. 1992. Colonization and succession of benthic macroinvertebrates in Arcadia Lake, a South-Central USA reservoir. Hydrobiologia 242:123–31. doi:10.1007/BF00018068.
- Bayram, A., and H. Önsoy. 2014. Sand and gravel mining impact on the surface water quality: A case study from the city of Tirebolu (Giresun Province, NE Turkey). Environmental Earth Sciences 73:1997–2011. doi:10.1007/s12665-014-3549-2.
- Beisner, B. E., P. R. Peres-Neto, E. S. Lindström, A. Barnett, and M. L. Longhi. 2006. The role of environmental and spatial processes in structuring lake communities from bacteria to fish. Ecology 87:2985–91. doi:10.1890/0012-9658(2006)87[2985:TROEAS]2.0.CO;2.
- Bilton, D. T., J. R. Freeland, and B. Okamura. 2001. Dispersal in freshwater invertebrates. Annual Review of Ecology and Systematics 32:159–81. doi:10.1146/annurev.ecolsys.32.081501.114016.
- Blanchette, M. L., and M. A. Lund. 2016. Pit lakes are a global legacy of mining: An integrated approach to achieving sustainable ecosystems and value for communities. Current Opinion in Environmental Sustainability 23:28–34. doi:10.1016/j.cosust.2016.11.012.
- Bloesch, J. 1995. Mechanisms, measurement and importance of sediment resuspension in lakes. Marine and Freshwater Research 46:295–304. doi:10.1071/MF9950295.
- Borcard, D., G. François, and P. Legendre. 2011. Numerical ecology with R. doi:10.1007/978-1-4419-7976-6.
- Boyes, D. M. 1999. Morphometry, spatial analysis and development of lakes on the Mackenzie Delta Plain. MSc diss., The University of Western Ontario.
- Brylinsky, M., and K. H. Mann. 1973. An analysis of factors governing productivity in lakes and reservoirs. Limnology and Oceanography 18:1–14. doi:10.4319/lo.1973.18.1.0001.
- Burn, C. R., and S. V. Kokelj. 2009. The environment and permafrost of the Mackenzie Delta area. Permafrost and Periglacial Processes 20:83–105. doi:10.1002/ppp.655.
- Burnham, K. P., and D. R. Anderson. 2004. Multimodel inference: Understanding AIC and BIC in model selection. Sociological Methods and Research 33:261–304. doi:10.1177/0049124104268644.
- Chao, A., N. J. Gotelli, T. C. Hsieh, E. L. Sander, K. H. Ma, R. K. Colwell, and A. M. Ellison. 2014. Rarefaction and extrapolation with Hill numbers: A framework for sampling and estimation in species diversity studies. Ecological Monographs 84:45–67. doi:10.1890/13-0133.1.
- Department of Energy, Mines and Resources. 1973. Fort McPherson, District of Mackenzie, Northwest Territories [map]. 1:50,000, Department of Energy, Mines and Resources, Ottawa, ON.
- Dodson, S. I., S. E. Arnott, and K. L. Cottingham. 2000. The relationship in lake communities between primary productivity and species richness. Ecology 81:2662–79. doi:10.1890/0012-9658(2000)081[2662:TRILCB]2.0.CO;2.
- Dodson, S. I., W. R. Everhart, A. K. Jandl, and S. J. Krauskopf. 2007. Effect of watershed land use and lake age on zooplankton species richness. Hydrobiologia 579:393–99. doi:10.1007/s10750-006-0392-9.
- Dos Santos, N. C. L., H. S. de Santana, R. M. Dias, H. L. F. Borges, V. F. de Melo, W. Severi, L. C. Gomes, and A. A. Agostinho. 2016. Distribution of benthic macroinvertebrates in a tropical reservoir cascade. Hydrobiologia 765:265–75. doi:10.1007/s10750-015-2419-6.
- Dredge, L. A., and H. L. Thorleifson. 1987. The Middle Wisconsinan history of the Laurentide Ice Sheet. Géographie Physique et Quaternaire XLI:215–35. doi:10.7202/032680ar.
- Dytham, C. 2011. Choosing and using statistics: A biologist’s guide. Chichester: Wiley-Blackwell.
- Ejsmont-Karabin, J. 1995. Rotifer occurrence in relation to age, depth and trophic state of quarry lakes. Hydrobiologia 313–314:21–28. doi:10.1007/BF00025927.
- Fang, X., N.-B. Chang, M.-K. Lee, and L. Wolf. 2010. Environmental impacts on surface water and groundwater for expanding urban water supply capacity using stone quarries. In Effects of urbanization of ground water: An engineering case-based approach for sustainable development, 26–50. Reston, VA: American Society of Civil Engineers. doi:10.1061/41036(342)189.
- Gammons, C. H., L. N. Harris, J. M. Castro, P. A. Cott, and B. Hanna. 2009. Creating lakes from open pit mines: Processes and considerations, with emphasis on northern environments. Canadian Technical Report of Fisheries and Aquatic Sciences 2826:1–106.
- Gotelli, N. J., and R. K. Colwell. 2001. Quantifying biodiversity: Procedures and pitfalls in the measurement and comparison of species richness. Ecology Letters 4:379–91. doi:10.1046/j.1461-0248.2001.00230.x.
- Gray, D. K., and S. E. Arnott. 2011. Does dispersal limitation impact the recovery of zooplankton communities damaged by a regional stressor? Ecological Applications 21:1241–56. doi:10.1890/10-0364.1.
- Gunter, R. A. 2017. The impact of road dust on Arctic aquatic ecosystems, Northwest Territories, Canada. MSc thesis, Brock University.
- Hill, P. R. 1996. Late quaternary sequence stratigraphy of the Mackenzie Delta. Canadian Journal of Earth Sciences 33:1064–74. doi:10.1139/e96-081.
- Hindák, F., and A. Hindáková. 2003. Diversity of cyanobacteria and algae of urban gravel pit lakes in Bratislava, Slovakia: A survey. Hydrobiologia 506–509. doi:10.1023/B:HYDR.0000008631.82041.c7.
- Houben, A. J., T. D. French, S. V. Kokelj, X. Wang, J. P. Smol, and J. M. Blais. 2016. The impacts of permafrost thaw slump events on limnological variables in upland tundra lakes, Mackenzie Delta region. Fundamental and Applied Limnology/Archiv Für Hydrobiologie 189:11–35. doi:10.1127/fal/2016/0921.
- Hsieh, T. C., K. H. Ma, and A. Chao. 2016. iNEXT: An R package for rarefaction and extrapolation of species diversity (Hill numbers). Methods in Ecology and Evolution 7:1451–56. doi:10.1111/2041-210X.12613.
- Hurlbert, S. H. 1971. The nonconcept of species diversity: A critique and alternative parameters. Ecology 52:577–86. doi:10.2307/1934145.
- Jenkins, D. G., and A. L. Buikema. 1998. Do similar communities develop in similar sites? A test with zooplankton structure and function. Ecological Monographs 68:421–43. doi:10.1890/0012-9615(1998)068[0421:DSCDIS]2.0.CO;2.
- Jones, F. C., K. M. Somers, B. Craig, and T. B. Reynoldson. 2007. Ontario Benthos Biomonitoring Network: Protocol manual. https://desc.ca/sites/default/files/OBBN2007finalapril18c.pdf.
- Kalin, M., Y. Cao, M. Smith, and M. M. Olaveson. 2001. Development of the phytoplankton community in a pit-lake in relation to water quality changes. Water Research 35:3215–25. doi:10.1016/S0043-1354(01)00016-1.
- Kiggiak-EBA Consulting Ltd. 2011. Environmental impact statement for construction of the Inuvik to Tuktoyaktuk Highway, NWT. https://eirb.ca/wp-content/uploads/2015/03/068-1-Segment-001-of-EIS-Inuvik-Tuk-Highway.pdf.
- Kokelj, S. V., B. Zajdlik, and M. S. Thompson. 2009. The impacts of thawing permafrost on the chemistry of lakes across the subarctic boreal-tundra transition, Mackenzie Delta region, Canada. Permafrost and Periglacial Processes 20:185–99. doi:10.1002/ppp.641.
- Lantz, T. C., S. E. Gergel, and S. V. Kokelj. 2010. Spatial heterogeneity in the shrub tundra ecotone in the Mackenzie Delta region, Northwest territories: Implications for Arctic environmental change. Ecosystems 13:194–204. doi:10.1007/s10021-009-9310-0.
- Layton, R. J., and J. R. Voshell. 1991. Colonization of new experimental ponds by benthic macroinvertebrates. Environmental Entomology 20:110–17. doi:10.1093/ee/20.1.110.
- Lipsey, L. L., Jr. 1980. Phytoplankton of selected borrow pit ponds in northern Illinois. The Ohio Journal of Science 80:108–13.
- Lipsey, L. L., and S. Malcom. 1981. Summer zooplankton communities of selected borrow-pit ponds in Northern Illinois, U.S.A. Hydrobiologia 77:81–85. doi:10.1007/BF00006392.
- Louette, G., L. De Meester, and S. Declerck. 2008. Assembly of zooplankton communities in newly created ponds. Freshwater Biology 53:2309–20. doi:10.1111/j.1365-2427.2008.02052.x.
- McArdle, B. H., and M. J. Anderson. 2001. Fitting multivariate models to community data: A comment on distance-based redundancy analysis. Ecology 82:290–97. doi:10.1890/0012-9658(2001)082[0290:FMMTCD]2.0.CO;2.
- Mollema, P. N., and M. Antonellini. 2016. Water and (bio)chemical cycling in gravel pit lakes: A review and outlook. Earth-Science Reviews 159:247–70. doi:10.1016/j.earscirev.2016.05.006.
- Mollema, P. N., M. Antonellini, E. Dinelli, N. Greggio, and P. J. Stuyfzand. 2015. The influence of flow-through saline gravel pit lakes on the hydrologic budget and hydrochemistry of a Mediterranean drainage basin. Limnology and Oceanography 60:2009–25. doi:10.1002/lno.10147.
- Moore, J. W. 1978. Composition and structure of zooplankton communities in eighteen arctic and subarctic lakes. Internationale Revue der gesamten Hydrobiologie und Hydrographie 63:545–65. doi:10.1002/(ISSN)1522-2632.
- Oksanen, J., F. G. Blanchet, R. Kindt, P. Legendre, P. R. Minchin, R. B. O’Hara, and H. Wagner. 2016: vegan: Community Ecology Package. In R package ver. 2.4-1. doi:10.4135/9781412971874.n145.
- Pienitz, R., J. P. Smol, and D. R. S. Lean. 1997. Physical and chemical limnology of 59 lakes located between the southern Yukon and the Tuktoyaktuk Peninsula, Northwest Territories (Canada). Canadian Journal of Fisheries and Aquatic Science 54:330–46. doi:10.1139/f96-274.
- Porter, C., P. Morin, I. Howat, M.-J. Noh, B. Bates, K. Peterman, S. Keesey, M. Schlenk, J. Gardiner, K. Tomko, et al. 2018. “ArcticDEM”. doi:10.7910/DVN/OHHUKH.
- Richardson, A. J. 2008. In hot water: Zooplankton and climate change. ICES Journal of Marine Science 65:279–95. doi:10.1093/icesjms/fsn028.
- Rühland, K. M., J. P. Smol, X. Wang, and D. C. G. Muir. 2003. Limnological characteristics of 56 lakes in the Central Canadian Arctic Treeline Region. Journal of Limnology 62:9–27. doi:10.4081/jlimnol.2003.9.
- Sandstrom, S., M. Rawson, and N. Lester. 2013. Manual of instructions for Broad-scale Fish Community Monitoring; using North American (NA1) and Ontario Small Mesh (ON2) Gillnets. Version 2013.2 35, Ontario Ministry of Natural Resources, Peterborough, Ontario.
- Scheffer, M. 1999. The effect of aquatic vegetation on turbidity; how important are the filter feeders? Hydrobiologia 408/409:307–16. doi:10.1023/A:1017011320148.
- Schilling, E. G., C. S. Loftin, and A. D. Huryn. 2009. Macroinvertebrates as indicators of fish absence in naturally fishless lakes. Freshwater Biology 54:181–202. doi:10.1111/j.1365-2427.2008.02096.x.
- Schultze, M., K. H. Pokrandt, and W. Hille. 2010. Pit lakes of the Central German lignite mining district: Creation, morphometry and water quality aspects. Limnologica 40:148–55. doi:10.1016/j.limno.2009.11.006.
- Scott, R. W., D. R. Barton, M. S. Evans, and J. J. Keating. 2011. Latitudinal gradients and local control of aquatic insect richness in a large river system in northern Canada. Journal of the North American Benthological Society 30:621–34. doi:10.1899/10-112.1.
- Shurin, J. B., K. Cottenie, and H. Hillebrand. 2009. Spatial autocorrelation and dispersal limitation in freshwater organisms. Oecologia 159:151–59. doi:10.1007/s00442-008-1174-z.
- Smith, V. H. 1982. The nitrogen and phosphorus dependence of algal biomass in lakes: An empirical and theoretical analysis. Limnology and Oceanography 27:1101–11. doi:10.4319/lo.1982.27.6.1101.
- Søndergaard, M., T. L. Lauridsen, L. S. Johansson, and E. Jeppesen. 2018. Gravel pit lakes in Denmark: Chemical and biological state. Science of the Total Environment 612:9–17. doi:10.1016/j.scitotenv.2017.08.163.
- Swadling, K. M., R. Pienitz, and T. Nogrady. 2000. Zooplankton community composition of lakes in the Yukon and Northwest Territories (Canada): Relationship to physical and chemical limnology. Hydrobiologia 431:211–24. doi:10.1023/A:1004056715976.
- Sweetman, J. N., and J. P. Smol. 2006. Reconstructing fish populations using Chaoborus (Diptera: Chaoboridae) remains – A review. Quaternary Science Reviews 25:2013–23. doi:10.1016/j.quascirev.2006.01.007.
- Sweetman, J. N., K. M. Rühland, and J. P. Smol. 2010. Environmental and spatial factors influencing the distribution of cladocerans in lakes across the central Canadian Arctic treeline region. Journal of Limnology 69:7. doi:10.3274/JL10-69-1-07.
- Symons, C. C., S. E. Arnott, and J. N. Sweetman. 2012. Grazing rates of crustacean zooplankton communities on intact phytoplankton communities in Canadian Subarctic lakes and ponds. Hydrobiologia 694:131–41. doi:10.1007/s10750-012-1137-6.
- Tolonen, K. T., Y. Cai, A. Vilmi, S. M. Karjalainen, T. Sutela, and J. Heino. 2018. Environmental filtering and spatial effects on metacommunity organisation differ among littoral macroinvertebrate groups deconstructed by biological traits. Aquatic Ecology 52:119–31. doi:10.1007/s10452-018-9649-4.
- Trombulak, S. C., and C. A. Frissell. 2000. Review of ecological effects of roads on terrestrial and aquatic communities. Conservation Biology 14:18–30. doi:10.1046/j.1523-1739.2000.99084.x.
- Van de Meutter, F., L. De Meester, and R. Stoks. 2007. Metacommunity structure of pond macroinvertebrates: Effects of dispersal mode and generation time. Ecology 88:1687–95. doi:10.1890/06-0333.1.
- Voshell, J. R., and G. M. Simmons. 1984. Colonization and succession of benthic macroinvertebrates in a new reservoir. Hydrobiologia 112:27–39. doi:10.1007/BF00007663.
- Welch, B. L. 1947. The generalization of 'Student’s’ problem when several different population variances are involved. Biometrika 34:28. doi:10.2307/2332510.