
ABSTRACT
The alpine ecosystem of the Rocky Mountains is experiencing significant increases in growing season length, summer maximum temperatures, and shifting patterns in precipitation. Alpine herbs are specifically sensitive to these changes. Biomass accumulation and reproductive effort are often negatively affected by elevated temperatures and earlier snowmelt. Here, we assess the use of herb-chronology, the study of annual growth rings in the woody underground organs, to retroactively monitor effects of monthly to seasonal climate on growth of the alpine forb species Penstemon whippleanus. We explored methods for building the strongest growth chronology possible by comparing the mean interseries correlations (MICs) of the whole population to that of groupings by cohorts, spatial locations, and random groupings using a permutation procedure. MIC for the whole population was low (0.034). Our permutation grouping performed best, producing a maximum MIC of 0.263. Using the permutation-derived chronology (2008–2015), we found significant decrease in growth with increased maximum temperatures in July, decreased May rainfall, increased drought between April and August, and lower minimum temperatures in September. Herb-chronology proved useful for understanding growth dynamics with climate in this alpine system; expanding this practice to similar systems could elucidate unknown effects of shifting climate on annual growth of alpine herbaceous species.
Introduction
There is wide consensus that anticipated global change may be the strongest in the polar regions and high-altitude systems (Solomon et al. Citation2007). For the Rocky Mountains of the United States in particular, over the last four decades, the number of annual frost days has decreased while minimum temperatures in the early spring continue to rise (Pederson et al. Citation2011a). Monthly maximum temperatures throughout the year are also increasing (Pederson et al. Citation2011a). Warmer overall spring temperatures, coupled with decreases in winter snowpack and substantial declines in peak snow water equivalent, are contributing to earlier season snow melts with reduced amounts of runoff (Rajagopalan et al. Citation2009; Pederson et al. Citation2011b). Rainfall is departing from previous averages with higher mean amounts and increased variance in the spring and summer (Pederson et al. Citation2011a).
If these changes in annual climate continue, large changes to the growth and composition of the Rocky Mountain alpine vegetation may ensue. Over geologic time, pollen and macrofossil records reveal the cyclic nature of alpine communities; herbaceous prominence in alpine landscapes thrives during cooler geologic time periods, whereas trees and shrubs dominate in relatively warmer periods (Short Citation1985; Wick and Tinner Citation1997). Conservation and better anticipating the effects of climate change on the growth of current alpine communities, which are mostly dominated by perennial herbaceous forb species and a small presence of shrubs and subshrubs (Hadley Citation1987), is becoming a top research priority (Xu et al. Citation2009; Thomas Citation2011; Rayback, Lini, and Berg Citation2012). Preservation of current alpine and subalpine vegetation instills numerous ecosystem benefits, as resident forb communities are important belowground carbon sinks (Kato et al. Citation2006; Sun et al. Citation2011), filter streamflow draining from catchments (Mueller, Weingartner, and Alewell Citation2013), and host a suite of endemic plant and animal species (Bliss Citation1962; Tribsch and Schönswetter Citation2003).
Observed changes in regional temperature have had mixed effects on alpine forbs. Often, rising temperatures affect growth by inducing water stress and thus decreases in photosynthesis (Roden and Ball Citation1996; Pearson and Dawson Citation2003; Niu et al. Citation2008), though these effects are species specific with even the capacity of some to acclimate to changes (Niu et al. Citation2008). For forbs negatively affected by rising temperatures and the induced water stress, aboveground biomass often decreases over time in experimental warming plots (Lambrecht et al. Citation2007). Alternatively, rising temperatures could play an indirect role in lengthening the growing season by decreasing the occurrence of late spring frosts (Pederson et al. Citation2011a), enabling earlier growth phenology (Lambrecht et al. Citation2007) and possibly enhanced growth. To a lesser degree, increasing minimum temperatures in early fall (Pederson et al. Citation2011a) could also enhance growth by prolonging the time until first frost and plant senescence (Zhang and Welker Citation1996; Berdanier and Klein Citation2011).
Precipitation is another important factor in alpine forb annual growth. Primarily, runoff from winter snowpack recharges soil moisture in the spring when forbs are emerging. When a decreased amount of winter snowpack is coupled with an advanced snowmelt, the resulting lower springtime available soil moisture negatively effects aboveground forb biomass (Harte and Shaw Citation1995; Inouye et al. Citation2000; Lambrecht et al. Citation2007). The exact timing of snowmelt is important since snow provides insulation from freezing wind exposure in the late winter and early spring, which could kill apical buds and thus interrupt the annual growth cycle (Galen and Stanton Citation1995; Inouye et al. Citation2000; Wipf and Rixen Citation2010; Klimešová, Doležal, and Št’astná Citation2013). Due to this frost damage, early snowmelt has been directly connected to decreased growth (Harte and Shaw Citation1995; Inouye et al. Citation2000; Wipf and Rixen Citation2010). Plant reproductive effort may also be reduced due to frost damage, which over time could decrease populations (Molau Citation1997; Inouye Citation2008; Wipf and Rixen Citation2010). For these reasons, many forb populations thrive in habitats with a long snow cover duration in the Rocky Mountain Alpine.
Given the anticipated changes in climate for the Rocky Mountain Alpine, and the documented effects these factors have on forb growth (Lambrecht et al. Citation2007; Wipf and Rixen Citation2010), records of growth response to recent past environments could be important for forecasting future growth, population viability, and even possible community transition away from forb dominance. Annual growth records of alpine plants are largely represented by dendrochronology research on shrub species (Bär et al. Citation2008; Hallinger, Manthey, and Wilmking Citation2010; Franklin Citation2013), with a paucity of similar studies on the more dominant alpine herbaceous component. Though currently not common knowledge, the annual growth of herbaceous plants too can be retrospectively observed. Many herbs contain annual growth rings in their perennial underground organs (Dietz and Ullmann Citation1998; Dietz and Schweingruber Citation2002). Like dendrochronology, herb-chronology finds significant variation between climate and annual growth increments of herbaceous species in montane (Dietz, von Arx, and Dietz Citation2004; von Arx and Dietz Citation2006; Klimešová, Doležal, and Št’astná Citation2013) and other landscapes (Liu and Zhang Citation2010; Dee and Palmer Citation2017; Hiebert-Giesbrecht et al. Citation2017). Physiologically, belowground annual growth rings correlate with annual climatic factors because the xylem in part functions in the winter storage of photoassimilate (Wargo Citation1979; Lacointe Citation2000; Dee et al. Citation2018).
In this study, we verify the application of herb-chronology by using this technique for uncovering the monthly climatic factors dictating growth of a Rocky Mountain perennial alpine herb Penstemon whippleanus. We predict years with warmer spring and summer months, earlier snowmelt, less winter snowpack, and less summer precipitation will lead to years with the most reduced annual growth ring areas. Additionally, years with lower minimum temperatures in the late summer and early fall could lead to increased annual growth ring areas. Since herb-chronology is a nascent field, our study also serves to establish a method to better construct herbaceous growth chronologies. Two major problems exist in the nature of obtaining a reliable master chronology from herbaceous species. First, study-wide synchronous growth patterns between individuals are often low compared to trees (Dee and Palmer Citation2017), possibly due to a high sensitivity to microsite environment in addition to climate (Dietz and Ullmann Citation1998; Dee and Palmer Citation2016, Citation2017). Second, traditional diagnostics used to cross-date and build a master chronology (Cook and Kairiukstis Citation2013) are mostly lost due to the short time series often found in herbs. In efforts to overcome these problems and progress toward investigating connections between climate and herbaceous growth mentioned in the preceding, our study explored a new dendrochronology-derived method for obtaining robust chronologies from herbaceous species.
Methods
Site description and field methods
Pennsylvania Mountain (PMR; 39.26463° N, −106.14203° W), located in Park County, Colorado, is 3100 to 4000 m in elevation and represents a transition zone between alpine tundra with alpine perennial herbs, shrubs, and grasses giving way to forests dominated by Rocky Mountain bristlecone pine (Pinus aristata) and subalpine fir (Abies lasiocarpa) at the lower elevations. Typical annual climate consists of winter durations of snowpack, usually subsiding by middle May, and growing season temperatures ranging between 1°C and 15°C, until the first freeze, which usually takes place in September (http://www.usa.com/park-county-co-weather.htm). Rainfall is usually most abundant during the late spring with an average of about 650 mm growing-season accumulation (http://www.usa.com/park-county-co-weather.htm).
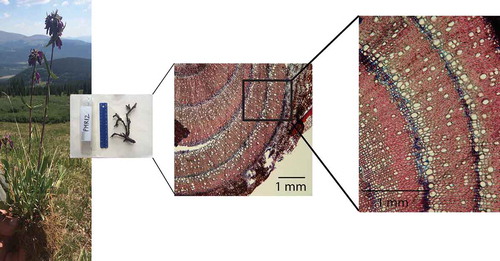
In the early fall of 2016 we excavated 40 Penstemon whippleanus individuals from Pennsylvania Mountain with global positioning system (GPS) locations and elevation positions recorded for each. Penstemon whippleanus () is a perennial herb of the Plantaginaceae family with a local distribution spanning from the alpine down through subalpine and lower elevations. Penstemon whippleanus contains a primary lateral root that gives way to secondary and finer roots. Each spring a new basal rosette emerges from underground buds. Xylem anatomy is semi-ring porous. Several other herbs in the Penstemon genus contain semi-ring porous anatomy with distinguishable growth rings (https://www.wsl.ch/dendropro/xylemdb/index.php?TEXTID=2379andMOD=1).
Figure 1. Excavated P. whippleanus in its common habitat at PMR, along with an example of the semi-ring porous root anatomy observed after staining a root section, visualized at 40× and 100× magnification, respectively. Features delineating the start of a new growth ring are shown: specifically, an earlywood parenchyma band stained blue followed by large earlywood vessels.
Lab methods
Following excavation, roots were separated from aboveground mass, cleaned of debris, and stored in Mason jars containing 75% alcohol. Drawings of roots were used to track locations of sections and their relative sizes. In the lab, we dissected roots and determined sectioning locations based on location nearest the stem and least disturbed tissue. Root sectioning was performed using a mini sledge microtome. Sections of approximately 15 µm thickness were then bleached for 5 minutes and washed with water to enhance the subsequent staining. Two drops of a 1:1 mix of Astra blue and Safranin (Schweingruber, Börner, and Schulze Citation2011), which turns parenchyma cells blue and lignified cells red to help enhance ring borders, were used for staining. After 3 minutes, excess stain was washed away with 95% alcohol. Sections were then mounted onto glass slides, allowing images of each stained section to be taken using a compound scope at 40× (). Images were scaled by finding the pixel distance of a 1-mm scale of imaged ruler under the same 40× magnification. Image analysis proceeded with ROXAS (von Arx and Carrer Citation2014) software to digitize ring boundaries and determine annual ring area. In cases where the complete root cross section was not present, we estimated ring area by taking the area measured, its arc length, and the diameter of the section, and then calculating total area of the ring assuming a perfect circle shape.
Constructing a master growth chronology for P. whippleanus
Individual ring area series were standardized and plotted out both through time and by age via spaghetti plots constructed using the plotting functions under the gplots library in R version 3.4.3 (Warnes et al. Citation2009; R Core Team Citation2017). Standardization of individual series consisted of subtracting the mean ring area from each area in a series and dividing by the standard deviation of the series. Mean interseries correlation (MIC) and mean sensitivity for the entire population were then calculated (Cook and Kairiukstis Citation2013). Given our efforts in establishing a master ring-area chronology with the strongest possible ability correlation with local environmental factors, MIC would be of primary importance because of its ability to assess the consistency of annual growth amongst individuals in a group. In past studies with herb-chronology, MICs for populations improved to as high as 0.45 when subgrouping on a predetermined biological context (Dee and Palmer Citation2017). In this study we assumed a similar phenomenon would occur; stronger chronologies based on groupings by a predefined biological context would emerge with higher MICs compared to those for the entire population, thus maximizing a common signal and our ability to associate annual herbaceous growth with a source (e.g., climate).
As with prior studies, building the strongest possible master chronology first began by evaluating MICs for the entire population. After MICs were assessed, we proceeded with forming a priori groupings by cohort and by spatial location along an elevational gradient. Three groups were formed from the elevational gradient, each separated by approximately 250 m between 3600 and 3750 m. For each cohort and elevational group, we ran a permutation test with 10,000 iterations to assess how the MIC of the grouping compares to randomly placing individuals into a subgrouping of the same size. The test statistic was the MIC of the actual grouping; therefore, the associated p value represented the percentage of the 10,000 random iterations with a higher MIC compared to the grouping. We concluded a significant MIC at p ≤ 0.05. In addition, in case grouping by cohort or spatial location failed to produce MICs that were improved over the population MIC, we proceeded with running a permutation scheme with 10,000 iterations of randomly shuffling individuals into groupings of 75% of the total population (n = 20). Though 75% may appear arbitrary, we choose this percentage since 25% of the total amount of series in a forb chronology typically have low pairwise correlations with other series, and most of the time this likely has to do with microsite conditions not accounted for within the study (Dee and Palmer Citation2016, Citation2017). Only the permutation group with the highest MIC was considered in further growth and climate analyses.
Climatic correlations with chosen chronology(s)
For the subsequent climatic analysis, chronologies from cohort and elevational groups were considered if their MICs were higher than that of the entire population. If neither cohorts nor elevation groupings produced higher MICs, and also failed permutation tests, then the 75% permutation group was used, given it had a higher MIC relative to the entire population. Overall, if none of these groupings produced an MIC of ≥ 0.20, a minimum metric for prior successful studies (Dee and Palmer Citation2016, Citation2017), climatic analysis did not proceed.
For the years 2008–2015 (with 2008 representing the first year a sample depth of at least four individuals was achieved) we used daily PRISM data (Daly et al. Citation2008) downloaded from http://www.prism.oregonstate.edu. Interpolated PRISM data for the site included daily minimum and maximum temperature, daily precipitation, and daily maximum vapor pressure deficit (VpdMax hereafter). These climatic variables were first averaged by calendar month and then correlated with each other to remove collinear variables (r ≥ 0.70) prior to correlative analysis with the master chronology. In addition, these monthly averages were also averaged into 3- to 4-month seasonal periods (January through March, April through August, and September through December).
Other climatic variables considered included last date of snowpack for each year along with drought severity for each of the three to four seasonal month periods. Landsat 7 and 8 satellite images (https://glovis.usgs.gov/imagery) were used to estimate the last day of snow cover at the site each year. Landsat imagery is available on a roughly 2-week time step. We cycled through available images between the months of April and July each year to assign an approximate date of last snow cover for the whole site. We excluded 2012 and 2014 from the analysis because all image dates between April and July were obscured by clouds. Datasets of Palmer Drought Severity Index (PDSI hereafter) for Colorado Climate Division 4 were compiled at a monthly resolution for 2008–2015 (Avail: https://www.ncdc.noaa.gov/temp-and-precip/drought/historical-palmers/).
For any significant correlations among ring area and climate variables, we carried out permutation tests to reduce the possibility of spurious relationships. These permutation tests involved keeping the master ring area chronology constant while randomly shuffling yearly values of the climatic variable being considered and then assessing correlations value for each of 10,000 iterations. The test statistic was the actual correlation between the climatic variable and ring area, with the p value representing the percentage of the 10,000 random iterations with a higher correlation. We concluded that there is a significant relationship if p ≤ 0.05 for the permutation test. All these analyses were done in R version 3.4.3 (R Core Team, Citation2017).
Results
Building chronology(s) for P. whippleanus
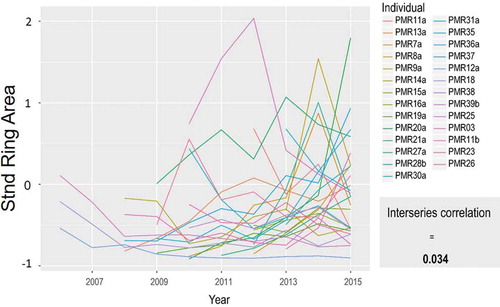
Twenty-seven individual series of annual ring area were constructed with ROXAS image analysis software. Ring anatomy was semi-ring porous with the latewood to earlywood transition easily identified except in cases when rings were compact on outer portions of the roots (). On average, individual series had a mean length of 6.03 (SD = 2.19) years. Year-to-year variation in ring area amongst individuals was high, translating to a very low MIC of 0.034 (). Average mean sensitivity across the population was 0.25. From 2008 to 2015 (sample depth of at least four individuals), ring area increased between 2008 and 2010, declined in 2011 and 2012, and strongly increased from 2013 onward ( and see , shown later). When plotted by age, rather than calendar year, we found no obvious age-related trends in ring area (results not shown).
Figure 2. Ring area spaghetti plot for all individuals at PMR study site. Mean interseries correlation represents the average pairwise correlation between individual series.
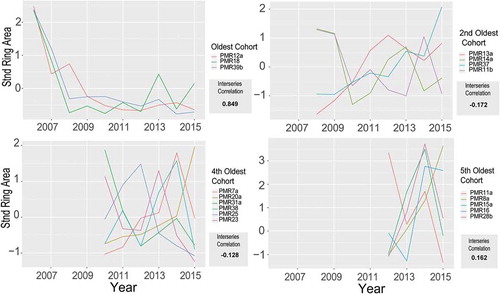
Our first approach to identifying the strongest correlated chronology (compared to the low MIC of 0.03 for the whole study) was grouping individuals by cohort. Six cohorts, 10 to 3 years of age, were established based on pith years of each individual (, only four out of six total cohorts shown). Overall, grouping by cohort produced unsatisfactory results. MICs among cohort groups were inconsistent and, on average, comparable to the low MIC for the entire population. Only the oldest cohort (10 years old) and our fifth oldest cohort (4 years old) had higher MICs than the entire population (). The oldest cohort had the highest MIC of 0.849. Ring area of individuals in this cohort declined sharply between 2006 and 2008 and maintained low year-to-year variation thereafter (). The fifth cohort showed a consistent increase in ring area between 2013 and 2014, followed by a large decline in 2015 for four out of the five individuals ().
Figure 3. Standardized ring area spaghetti plots grouped by select cohorts along with the mean interseries correlation for each. Permutation results were only significant for the oldest cohort (p = 0.026).
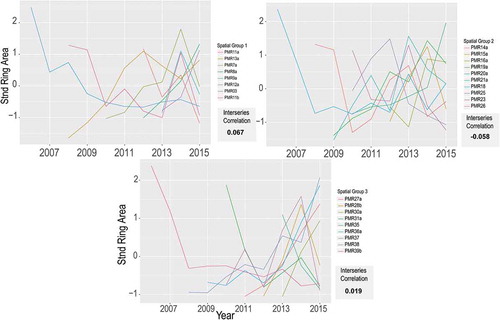
Grouping by elevation resulted in three spatially clumped groups, each containing nine or 10 individuals. Overall, this grouping method was the least successful in terms of improving MICs above that of the entire population. MICs for all groups were close to zero, with no significant permutation results suggesting any were stronger than the whole population (). By comparison, grouping by cohort produced higher MICs, though neither methodology produced adequate results (consistent MICs ≥ 0.20) for climatic analysis.
Figure 4. Standardized ring area spaghetti plots grouped by spatial location along with the mean interseries correlation for each. Permutation results were not significant for any grouping.
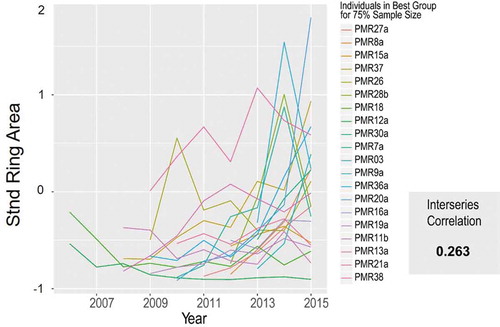
With unsatisfactory results based on grouping by cohort or elevation, we proceeded with randomly permuting different groups with 20 individuals (75% of our total sample size). After 10,000 iterations, our highest permutation group MIC was 0.26 (), considerably higher than for the entire population (0.03). We compared this MIC to the average MIC of 50 highest 75% permutation groups resulting from 50 separate runs of this process using random numbers replaced into the time series for all 27 individuals. We found the average MIC from these 50 runs was 0.139, considerably less than the 0.26 we found using actual data. This confirms that the MIC from this procedure using actual data was much larger than an MIC generated from random data. Visually, the year-to-year variation among individuals in the permutation group with an MIC of 0.26 appeared to be diminished compared to the entire population chronology, but with both showing the same pronounced 2013–2015 growth increase. Moving forward, the master chronology from this 20-member randomly permuted group was used for subsequent climatic analysis.
Figure 5. Ring area spaghetti plots for the 20-member permutation group with the best mean interseries correlation.
Climatic analysis
Correlations among growth and monthly climate variables are summarized in a heat map (). The highest correlation represented a positive relationship between ring area and minimum September temperature (r = 0.83, ). Following this, previous and current July VpdMax were the next strongest correlations with a negative association (r = −0.82, r = −0.81, respectively, ). Precipitation in November and May had strong positive associations with ring area as well (r = 0.80 and r = 0.74, respectively, ). Daily high temperature in the previous July, August, and current July also had strong inverse relations to ring area (r = −0.74, r = −0.67, r = −0.74, respectively, ). provides a visual reference, with the time series of the master chronology plotted alongside each of these mostly highly correlated climatic variables. Overall, permutation tests showed significance with these and another 12 climatic variables ().
Table 1. Correlation coefficient and each respective permutation result for the top 15 strongest correlations between the master chronology and climatic variables (2008–2015). Note. Correlations for each monthly variables are shown in the heat map. Abbreviations are as follows: VpdMax = the average of daily maximum vapor pressure deficit values, Precip = precipitation, PDSI = Palmer Drought Severity Index, and Prev = correlation for previous year’s variable.
Figure 6. Heat map for the correlations between the master chronology and monthly climatic variables of the current year and previous year.
Figure 7. Trends between the standardized master chronology for ring area (middle 95% confidence interval [CI] panel) and highly correlated climatic variables (surrounding panels). Correlation coefficients can be found within the heat map. The sample depth (out of 20) for the master chronology was 5 for 2008, 8 for 2009, 11 for 2010, 12 for 2011, 17 for 2012, and 20 for 2013–2015.
![Figure 7. Trends between the standardized master chronology for ring area (middle 95% confidence interval [CI] panel) and highly correlated climatic variables (surrounding panels). Correlation coefficients can be found within the Figure 6 heat map. The sample depth (out of 20) for the master chronology was 5 for 2008, 8 for 2009, 11 for 2010, 12 for 2011, 17 for 2012, and 20 for 2013–2015.](/cms/asset/02819bf4-34c3-4f77-8144-79661d594c7b/uaar_a_1585173_f0007_oc.jpg)
Discussion
Building a site herb-chronology
Similar to previous herb-chronology work (von Arx and Dietz Citation2006; Liu and Zhang Citation2010; Dee and Palmer Citation2017), the entire chronology time span for P. whippleanus was close to one decade. Series of this length nullify using more traditional dendrochronology techniques in efforts for cross-dating and building a site chronology (Grissino-Mayer Citation2001). In addition, high variability in annual growth, leading to low MICs, may be experienced across herbaceous individuals due to microsite variability (Dietz and Ullmann Citation1998; Dee and Palmer Citation2016, Citation2017). To overcome these issues, we adopted the chronology building practice of attempting to group by cohort, spatial location, and randomly permuting, all the while inspecting for improved chronology MICs over that of the whole population.
Though not successful in our study, grouping by cohort has biological justification. One can hypothesize that individuals germinating in a drought period may experience relatively more sensitive annual growth rates pertaining to water availability compared to cohorts from years when water resources are plentiful (Chapin, Schulze, and Mooney Citation1990; Walters and Reich Citation1997; Schwinning and Sala Citation2004). Thus, a low MIC for a whole site chronology may be the result of a diffuse distribution of cohorts and/or periodic events, such as drought or other influential environmental changes. MICs of our six cohorts were mostly not improved over that of our entire population, suggesting that grouping by cohort was not beneficial. Only two of our six cohorts produced high pairwise correlation values, with no biological reasoning to help explain and distinguish this result from a random chance. The germination years of these two respective cohorts (2006 and 2012) present no evidence for consistencies in climate conditions that may have induced higher consistency in growth of only these two cohorts. Nevertheless, we recommend attempting grouping by cohort in future studies since timing of germination could have an overarching effect on growth. This “cohort effect” may overall depend on annual fecundity rates (Herrera Citation1991; Saavedra et al. Citation2003) and periodicity of the leading limiting growth factors.
Grouping by spatial location also proved unsuccessful in improving chronology MICs. No groups produced MICs > 0.1. This suggests that there may be a strong microsite effect on chronologies even within similar elevations, since dividing the site sample size into thirds based on proximity did not improve and even worsened MICs in some cases. PMR is a rocky site with different exposures at the microsite level to wind and low shade. Microtopographic variability in alpine zones can create different snowpack durations and variable growing-season water availability (Huelber et al. Citation2006; Bär et al. Citation2008). Though the technique was not successful in our study, past studies grouping by a predetermined environmental factor have had notable success in improving chronology MICs. Dee and Palmer (Citation2017) found stronger MICs within units of different fire histories compared to the populations of two locations located in the tallgrass prairie of the central United States. Overall, grouping by a predetermined growth-limiting factor should be considered in future studies, whereas chronology building success could be improved by careful documentation of microsite conditions and increased sample sizes.
We believe that future chronology building efforts should consider a permutation grouping approach. In our study, after 10,000 iterations of randomly shuffling individuals with replacement into a group size of 20 individuals, we found a grouping that had a considerable improvement over the entire population chronology. Furthermore, our permutation-derived master chronology MIC of 0.262 was comparable to previous studies that further implemented growth and climate correlations (Dee and Palmer Citation2017). Through this procedure, the seven problem series that were removed likely resulted from some unknown plant, site, or other environmental factors that affected their growth during the time considered. Four out of seven of these removed series had a reduced ring area in 2014 compared to 2013 and 2015, contrasting highly with the master chronology. Separately from all other analysis, we ran correlations with the chronology of these seven individuals and monthly climate, finding a weak (r = 0.728, p = 0.10) positive response to July Vpdmax, which is the opposite directional response to July Vpdmax seen with the permutation-derived chronology used in the study. Warranting further microsite documentation for similar studies, as mentioned elsewhere in this discussion, it is possible that decreased growth in wetter conditions for these individuals may be the result of increased competition, especially if these individuals existed in a relatively dense matrix with other forbs and/or graminoids (Dee and Palmer Citation2016, Citation2018).
Implications of climatic variability on the growth of P. whippleanus
Growing season length appears to have the strongest effect on the ring area of P. whippleanus. A positive effect of increasing September minimum temperatures between 2011 and 2015 likely provided an extra few weeks for carbon assimilation, subsequent storage, and enlarged ring area (Chapin, Schulze, and Mooney Citation1990; Lacointe Citation2000). Likewise, the positive effect of higher prior year September minimum temperature also could improve current year growth due to increased reserves (Chapin, Schulze, and Mooney Citation1990). In several alpine landscapes, increasing growing season length enhances herbaceous biomass production compared to years with shorter growing seasons(Zhang and Welker Citation1996; Berdanier and Klein Citation2011). This is the case for shrubs and subshrubs in the alpine and subalpine as well (Rayback, Lini, and Berg Citation2012; Franklin Citation2013). Timing of increased minimum or maximum temperatures may be important for the response of forbs in terms of biomass accumulation due to seasonality of soil moisture availability. For example, forb reduction in biomass in response to experimental warming (Harte and Shaw Citation1995; Inouye et al. Citation2000; Lambrecht et al. Citation2007) may occur because of an overriding negative effect from increased temperatures during the summer period, likely from enhanced water stress (Lambrecht et al. Citation2007). Increased temperatures during the late summer and early fall may not amplify water stress but rather lengthen optimal growing conditions (Zhang and Welker Citation1996; Berdanier and Klein Citation2011; Rayback, Lini, and Berg Citation2012; Weijers et al. Citation2012). In contrast, there is the possibility that warmer conditions at the end of the growing season may negatively affect winter hardiness preparations within the plant, therefore subjecting them to winter damage or kill (Wipf and Rixen Citation2010).
We found strong direct evidence that drought in summer months negatively affected P. whippleanus growth. We found that growing season PDSI (averaged for April through August) was positively correlated with ring area. We also found a strong negative association growth and July VpdMax. High levels of July VpdMax (and previous July VpdMax) between 2008 and 2012 were associated with relatively small ring areas. Production in this particular location, and plausibly belowground allocation of carbon resources (Chapin, Schulze, and Mooney Citation1990; Lacointe Citation2000), may reach high levels during July, as demonstrated by NDVI satellite imagery being at its highest values during this month. Thus, any impediment to carbon assimilation, such as drought and high vapor pressure deficit, could translate to decreased ring areas that we observed. Interestingly, other herb-chronology studies in completely different regions of the United States, such as the oak savannah and the tallgrass prairie (Dee and Palmer Citation2017), demonstrate similar responses. Pollen records indicate periods of herbaceous dominance that are usually associated with cooler periods in these systems as well (Camill et al. Citation2003), suggesting no doubt that summer drought may play an important role in limiting herbaceous growth across landscapes.
Even with evidence that both the length of the growing season and the availability of soil moisture in the driest parts of the growing season limit growth, it is surprising that annual snowfall amount and estimated snowpack duration (from satellite imagery) had no significant effects. Though lengthening of the growing season could be expected to have positive effect on growth, most past work highlights the negative effect of earlier snowmelt on growth and abundance(Harte and Shaw Citation1995; Inouye et al. Citation2000; Wipf and Rixen Citation2010; Klimešová, Doležal, and Št’astná Citation2013), with a primary reason that earlier snowmelt may expose apical buds to damage from frost (Molau Citation1997; Inouye Citation2008; Wipf and Rixen Citation2010). One factor that may help explain the apparent lack of effect from snow related variables is the rugged terrain of the alpine, which may cause large variation in the actual microsite accumulation and duration. Large microsite variation in snow accumulation and duration of snowpack may be a large factor in the disparate snowfall effects seen on individual growth chronologies. In addition, use of LANDSAT, PRISM, MODIS, and so on may be too coarse for accurately recording snowmelt timing in microsites. To help rectify this, we recommend that future studies that focus on plant individuals rather than populations be more diligent in obtaining improved snowmelt data for respective microsites.
Conclusions
Growth, composition, and existing ecosystem services of Rocky Mountain alpine ecosystems are under threat with anticipated increases in growing season length, growing season temperature, and altered rainfall patterns (Solomon et al. Citation2007; Pederson et al. Citation2011a). Alpine ecosystem services will likely change if a shifting climate causes community transition from herbaceous-dominated to more woody dominance over the next several decades (Harsch et al. Citation2009; Elliott and Kipfmueller Citation2011). Indeed, many observations are made in alpine habitats on the positive growth response and establishment of sagebrush (Artemisia tridentata) in response to warmer temperatures, given its greater tolerance to drought (Harte and Shaw Citation1995; Loik and Harte Citation1997; Maier et al. Citation2001; Perfors, Harte, and Alter Citation2003). Our study provides a framework for documenting herb growth response to annual climate so these relationships can be better understood and future compositional changes may even be better anticipated. In this effort, it is vital to separate more traditional dendrochronology techniques from ones that are necessary for the shorter and microsite-sensitive time series related to herbaceous species. Moving forward, we recommend chronology analyses include iterative grouping processes in attempts to improve the accuracy of herb chronologies. With these techniques, we were able to improve chronologies and find significant correlations between annual P. whippleanus growth and several climate variables. Further connecting these growth patterns to aboveground production, through either remote sensing or other means, will bolster the value of herbaceous root chronologies for understanding future growth dynamics in the face of climate change.
Disclosure statement
No potential conflict of interest was reported by the authors.
References
- Bär, A., R. Pape, J. Löffler, and A. Bräuning. 2008. The impact of microtopography in alpine environments on growth-ring variations of the dwarf shrub Empetrum hermaphroditum. Journal of Biogeography 35 (4):625–95. doi:10.1111/j.1365-2699.2007.01804.x.
- Berdanier, A. B., and J. A. Klein. 2011. Growing season length and soil moisture interactively constrain high elevation aboveground net primary production. Ecosystems 14 (6):963–74. doi:10.1007/s10021-011-9459-1.
- Bliss, L. C. 1962. Adaptations of arctic and alpine plants to environmental conditions. Arctic 15 (2):117–44. doi:10.14430/arctic3564.
- Camill, P., C. E. Umbanhowar, R. Teed, C. E. Geiss, J. Aldinger, L. Dvorak, J. Kenning, J. Limmer, and K. Walkup. 2003. Late-glacial and Holocene climatic effects on fire and vegetation dynamics at the prairie-forest ecotone in south-central Minnesota. Journal of Ecology 91 (5):822–36. doi:10.1046/j.1365-2745.2003.00812.x.
- Chapin, F. S., III, E. D. Schulze, and H. A. Mooney. 1990. The ecology and economics of storage in plants. Annual Review of Ecology and Systematics 21 (1):423–47. doi:10.1146/annurev.es.21.110190.002231.
- Cook, E. R., and L. A. Kairiukstis. eds. 2013. Methods of dendrochronology: Applications in the environmental sciences. Berlin: Springer Science and Business Media.
- Daly, C., M. Halbleib, J. I. Smith, W. P. Gibson, M. K. Doggett, G. H. Taylor, J. Curtis, and P. P. Pasteris. 2008. Physiographically sensitive mapping of climatological temperature and precipitation across the conterminous united states. International Journal of Climatology: A Journal of the Royal Meteorological Society 28 (15):2031–2064.
- Dee, J. R., H. D. Adams, and M. W. Palmer. 2018. Belowground annual ring growth coordinates with aboveground phenology and timing of carbon storage in two tallgrass prairie forb species. American Journal of Botany 105 (12):1975–1985.
- Dee, J. R., and M. W. Palmer. 2016. Application of herb-chronology: Annual fertilization and climate reveal annual ring signatures within the roots of US tallgrass prairie plants. Botany 94 (4):277–88. doi:10.1139/cjb-2015-0217.
- Dee, J. R., and M. W. Palmer. 2017. Annual rings of perennial forbs and mature oaks show similar effects of climate but inconsistent responses to fire in the North American prairie–Forest ecotone. Canadian Journal of Forest Research 47 (6):716–26. doi:10.1139/cjfr-2016-0473.
- Dee, J. R., and M. W. Palmer. 2018. Utility of herbaceous annual rings as markers of plant response to disturbance: A case study using roots of a common milkweed species of the US tallgrass prairie. Tree-Ring Research. doi:10.3959/TRR2018-2.
- Dietz, H., and F. H. Schweingruber. 2002. Annual rings in native and introduced forbs of lower Michigan, USA. Canadian Journal of Botany-Revue 80 (6):642–49. doi:10.1139/b02-048.
- Dietz, H., G. von Arx, and S. Dietz. 2004. Growth patterns in two alpine forbs as preserved in annual rings of the roots: The influence of a snowbank gradient. Arctic, Antarctic, and Alpine Research 36:591–97. doi:10.1657/1523-0430(2004)036[0591:GIPITR]2.0.CO;2.
- Dietz, H., and I. Ullmann. 1998. Ecological application of ‘Herbchronology’: Comparative stand age structure analyses of the invasive plant Bunias orientalis L. Annals of Botany 82 (4):471–80. doi:10.1006/anbo.1998.0706.
- Elliott, G. P., and K. F. Kipfmueller. 2011. Multiscale influences of climate on upper treeline dynamics in the Southern Rocky Mountains, USA: Evidence of intraregional variability and bioclimatic thresholds in response to twentieth-century warming. Annals of the Association of American Geographers 101 (6):1181–203. doi:10.1080/00045608.2011.584288.
- Franklin, R. S. 2013. Growth response of the alpine shrub, Linanthus pungens, to snowpack and temperature at a rock glacier site in the eastern Sierra Nevada of California, USA. Quaternary International 310:20–33. doi:10.1016/j.quaint.2012.07.018.
- Galen, C., and M. L. Stanton. 1995. Responses of snowbed plant-species to changes in growing-season length. Ecology 76 (5):1546–57. doi:10.2307/1938156.
- Grissino-Mayer, H. D. 2001. Evaluating crossdating accuracy: A manual and tutorial for the computer program COFECHA. Tree Ring Research 57:205–221.
- Hadley, K. S. 1987. Vascular alpine plant distributions within the central and southern Rocky Mountains, USA. Arctic and Alpine Research 19 (3):242–51. doi:10.2307/1551359.
- Hallinger, M., M. Manthey, and M. Wilmking. 2010. Establishing a missing link: Warm summers and winter snow cover promote shrub expansion into alpine tundra in Scandinavia. New Phytologist 186 (4):890–99. doi:10.1111/j.1469-8137.2010.03223.x.
- Harsch, M. A., P. E. Hulme, M. S. McGlone, and R. P. Duncan. 2009. Are treelines advancing? A global meta‐analysis of treeline response to climate warming. Ecology Letters 12 (10):1040–49. doi:10.1111/j.1461-0248.2009.01355.x.
- Harte, J., and M. R. Shaw. 1995. Shifting dominance within a montane vegetation community: Results of a climate-warming experiment. Science 267:876–80. doi:10.1126/science.267.5199.876.
- Herrera, C. M. 1991. Dissecting factors responsible for individual variation in plant fecundity. Ecology 72 (4):1436–48. doi:10.2307/1941116.
- Hiebert-Giesbrecht, M. R., C. Y. Novelo-Rodríguez, G. R. Dzib, L. M. Calvo-Irabién, G. von Arx, and L. M. Peña-Rodríguez. 2017. Herb-chronology as a tool for determining the age of perennial forbs in tropical climates. Botany 96 (1):73–78. doi:10.1139/cjb-2017-0167.
- Huelber, K., M. Gottfried, M. Pauli, H. Reiter, K. Winkler, and G. Grabherr. 2006. Phenological responses of snowbed species to snow removal dates in the Central Alps: Implications for climate warming. Arctic, Antarctic, and Alpine Research 38 (1):99–103. doi:10.1657/1523-0430(2006)038[0099:PROSST]2.0.CO;2.
- Inouye, D. W. 2008. Effects of climate change on phenology, frost damage, and floral abundance of montane wildflowers. Ecology 89:353–62. doi:10.1890/06-2128.1.
- Inouye, D. W., W. A. Barr, K. B. Armitage, and B. D. Inouye. 2000. Climate change is affecting altitudinal migrants and hibernating species. Proceedings of the National Academy of Sciences of the United States of America 97:1630–33. doi:10.1073/pnas.97.4.1630.
- Kato, T., Y. Tang, S. Gu, M. Hirota, M. Du, Y. Li, and X. Zhao. 2006. Temperature and biomass influences on interannual changes in CO2 exchange in an alpine meadow on the Qinghai-Tibetan Plateau. Global Change Biology 12 (7):1285–98. doi:10.1111/gcb.2006.12.issue-7.
- Klimešová, J., J. Doležal, and P. Št’astná. 2013. Growth of the alpine herb Rumex alpinus over two decades: Effect of climate fluctuations and local conditions. Plant Ecology 214 (8):1071–84. doi:10.1007/s11258-013-0232-8.
- Lacointe, A. 2000. Carbon allocation among tree organs: A review of basic processes and representation in functional-structural tree models. Annals of Forest Science 57 (5):521–33. doi:10.1051/forest:2000139.
- Lambrecht, S. C., M. E. Loik, D. Inouye, and J. Harte. 2007. Reproductive and physiological responses to simulated climate warming for four subalpine species. New Phytologist 173 (1):121–34. doi:10.1111/j.1469-8137.2006.01892.x.
- Liu, Y. B., and Q. B. Zhang. 2010. Effect of climate on the growth of annual rings in the main roots of perennial forbs in an Inner Mongolian semi-arid grassland, China. Journal of Vegetation Science 21 (5):899–907. doi:10.1111/j.1654-1103.2010.01199.x.
- Loik, M. E., and J. Harte. 1997. Changes in water relations for leaves exposed to a climate-warming manipulation in the Rocky Mountains of Colorado. Environmental and Experimental Botany 37 (2–3):115–23. doi:10.1016/S0098-8472(96)01043-X.
- Maier, A. M., B. L. Perryman, R. A. Olson, and A. L. Hild. 2001. Climatic influences on recruitment of 3 subspecies of Artemisia tridentata. Journal of Range Management 54 (6):699–703. doi:10.2307/4003674.
- Molau, U. 1997. Phenology and reproductive success in Arctic plants: Susceptibility to climate change. In Global change and Arctic terrestrial ecosystems, eds. W.C. Oechel, T. Callaghan, T. Gilmanov, J. I. Holten, B. Maxwell, U. Molau, and B. Sveinbjörnsson, 153–70. New York, NY: Springer. 119.02371.
- Mueller, M. H., R. Weingartner, and C. Alewell. 2013. Importance of vegetation, topography and flow paths for water transit times of base flow in alpine headwater catchments. Hydrology and Earth System Sciences 17:1661–69. doi:10.5194/hess-17-1661-2013.
- Niu, S., Z. Li, J. Xia, Y. Han, M. Wu, and S. Wan. 2008. Climatic warming changes plant photosynthesis and its temperature dependence in a temperate steppe of northern China. Environmental and Experimental Botany 63 (1–3):91–101. doi:10.1016/j.envexpbot.2007.10.016.
- Pearson, R. G., and T. P. Dawson. 2003. Predicting the impacts of climate change on the distribution of species: Are bioclimate envelope models useful? Global Ecology and Biogeography 12 (5):361–71. doi:10.1046/j.1466-822X.2003.00042.x.
- Pederson, G. T., S. T. Gray, C. A. Woodhouse, J. L. Betancourt, D. B. Fagre, J. S. Littell, and L. J. Graumlich. 2011b. The unusual nature of recent snowpack declines in the North American Cordillera. Science 333 (6040):332–35. doi:10.1126/science.1201570.
- Pederson, G. T., S. T. Gray, T. Ault, W. Marsh, D. B. Fagre, A. G. Bunn, and L. J. Graumlich. 2011a. Climatic controls on the snowmelt hydrology of the northern Rocky Mountains. Journal of Climate 24 (6):1666–87. doi:10.1175/2010JCLI3729.1.
- Perfors, T., J. Harte, and E. Alter. 2003. Enhanced growth of sagebrush (Artemisia tridentata) in response to manipulated ecosystem warming. Global Change Biology 9 (5):736–42. doi:10.1046/j.1365-2486.2003.00559.x.
- R Core Team. 2017. R: A language and environment for statistical computing (Version 3.4. 2) [Computer software]. Vienna, Austria: R Foundation for Statistical Computing.
- Rajagopalan, B., K. Nowak, J. Prairie, M. Hoerling, B. Harding, J. Barsugli, A. Ray, and B. Udall. 2009. Water supply risk on the Colorado River: Can management mitigate? Water Resources Research 45 (8):W08201. doi:10.1029/2008WR007652.
- Rayback, S. A., A. Lini, and D. L. Berg. 2012. The dendroclimatological potential of an alpine shrub, Cassiope mertensiana, from Mount Rainier, WA, USA. Geografiska Annaler: Series A, Physical Geography 94:413–27. doi:10.1111/j.1468-0459.2012.00463.x.
- Roden, J. S., and M. C. Ball. 1996. The effect of elevated [CO2] on growth and photosynthesis of two eucalyptus species exposed to high temperatures and water deficits. Plant Physiology 111 (3):909–19. 101.954636.
- Saavedra, F., D. W. Inouye, M. V. Price, and J. Harte. 2003. Changes in flowering and abundance of Delphinium nuttallianum (Ranunculaceae) in response to a subalpine climate warming experiment. Global Change Biology 9 (6):885–94. doi:10.1046/j.1365-2486.2003.00635.x.
- Schweingruber, F. H., A. Börner, and E. D. Schulze. 2011. Atlas of stem anatomy in herbs, shrubs and trees, Vol. 1. Berlin, Heidelberg: Springer Science & Business Media.
- Schwinning, S., and O. Sala. 2004. Hierarchy of responses to resource pulses in arid and semi-arid ecosystems. Oecologia 141 (2):211–20. doi:10.1007/s00442-004-1520-8.
- Short, S. K. 1985. Palynology of Holocene sediments, Colorado Front Range: Vegetation and treeline changes in the subalpine forest. American Association of Stratigraphic Palynologists Contribution Series 16:7–30.
- Solomon, S., D. Qin, M. Manning, K. Averyt, and M. Marquis. 2007. Climate change 2007-the physical science basis: Working group I contribution to the fourth assessment report of the IPCC. New York: Cambridge University Press. Vol. 4.
- Sun, D. S., K. Wesche, D. D. Chen, S. H. Zhang, G. L. Wu, G. Z. Du, and N. B. Comerford. 2011. Grazing depresses soil carbon storage through changing plant biomass and composition in a Tibetan alpine meadow. Plant, Soil and Environment 57 (6):271–78. doi:10.17221/PSE.
- Thomas, C. D. 2011. Translocation of species, climate change, and the end of trying to recreate past ecological communities. Trends in Ecology and Evolution 26 (5):216–21. doi:10.1016/j.tree.2011.02.006.
- Tribsch, A., and P. Schönswetter. 2003. Patterns of endemism and comparative phylogeography confirm palaeo-environmental evidence for Pleistocene refugia in the Eastern Alps. Taxon 52 (3):477–97. doi:10.2307/3647447.
- von Arx, G., and H. Dietz. 2006. Growth rings in the roots of temperate forbs are robust annual markers. Plant Biology 8 (2):224–33. doi:10.1055/s-2005-873051.
- von Arx, G., and M. Carrer. 2014. ROXAS - a new tool to build centuries-long tracheid-lumen chronologies in conifers. Dendrochronologia 32 (3):290–93. doi:10.1016/j.dendro.2013.12.001.
- Walters, M. B., and P. B. Reich. 1997. Growth of Acer saccharum seedlings in deeply shaded understories of northern Wisconsin: Effects of nitrogen and water availability. Canadian Journal of Forest Research 27 (2):237–47. doi:10.1139/x96-178.
- Wargo, P. M. 1979. Strach storage and radial growth in woody roots of sugar maple. Canadian Journal of Forest Research 9 (1):49–56.
- Warnes, G. R., B. Bolker, L. Bonebakker, R. Gentleman, W. Huber, A. Liaw, T. Lumley, M. Maechler, A. Magnusson, S. Moeller, and M. Schwartz. 2009. gplots: Various R programming tools for plotting data. R package version 3.0.1. Available: http://CRAN.R-project.org/package=gplots.
- Weijers, S., I. Greve Alsos, P. Bronken Eidesen, R. Broekman, M. J. Loonen, and J. Rozema. 2012. No divergence in Cassiope tetragona: Persistence of growth response along a latitudinal temperature gradient and under multi-year experimental warming. Annals of Botany 110 (3):653–65. doi:10.1093/aob/mcs123.
- Wick, L., and W. Tinner. 1997. Vegetation changes and umbertine fluctuations in the Central Alps as indicators of Holocene climatic oscillations. Arctic and Alpine Research 29 (4):445–58. doi:10.2307/1551992.
- Wipf, S., and C. Rixen. 2010. A review of snow manipulation experiments in Arctic and alpine tundra ecosystems. Polar Research 29 (1):95–109. doi:10.1111/j.1751-8369.2010.00153.x.
- Xu, J., R. E. Grumbine, A. Shrestha, M. Eriksson, X. Yang, Y. U. N. Wang, and A. Wilkes. 2009. The melting Himalayas: Cascading effects of climate change on water, biodiversity, and livelihoods. Conservation Biology 23 (3):520–30. doi:10.1111/j.1523-1739.2009.01237.x.
- Zhang, Y., and J. M. Welker. 1996. Tibetan alpine tundra responses to simulated changes in climate: Aboveground biomass and community responses. Arctic and Alpine Research 28 (2):203–09. doi:10.2307/1551761.