
ABSTRACT
We detail variations in the weight percent (wt%) of quartz, a proxy for drift ice, in fifteen marine sediment cores from the northwest, west, and southwest Iceland shelf throughout the past 10 cal ka BP. We present the first map of iceberg distributions in Iceland waters between 1983 and 2011 and a new compilation of sea-ice records in the century from 850 to 1950 CE. The wt% of quartz, determined by quantitative X-ray diffraction (qXRD) analysis, is used to evaluate changes in the importation of drift ice. Small wt% of quartz were added to milled basalt (0% quartz), and to a mixture of non-clay and clay minerals; the qXRD method replicated 0 percent quartz, while measured 1–3 percent quartz always resulted in a “presence” estimate. The outer sites in the northwest sector lie close to the average position of the sea-ice margin between 1870 and 1920 CE; the southwest shelf sites lie south of this limit. Transects of cores along the Húnaflói and Djúpáll troughs indicate that the traces of drift ice decrease rapidly landward from the outer sites. The cores from the west/southwest of Iceland have limited amounts of quartz, generally possibly limited incursions of drift ice.
Introduction
The presence of sea ice and icebergs (together termed drift ice) around Iceland (; Koch Citation1945; Wallevik and Sigurjónsson Citation1998) is an important climatic indicator (Lamb Citation1979; Ogilvie and Jónsdóttir Citation2000; Ogilvie and Jónsson Citation2001). Sea-ice export from the Arctic Ocean (~5,000 km3 yr−1) is a major contributor of fresh water to the northern North Atlantic (Karcher et al. Citation2005; Morison et al. Citation2012; ), which can impact deep-water formation and the thermohaline circulation (Dickson et al. Citation1988, Citation1996). Increased drift ice points to critical changes in the atmosphere–ocean–cryosphere system and has negative effects on Icelandic agriculture and fishing (Ogilvie Citation1997). Modern satellite and historical observations of the southern and eastern limits of drift ice on the Iceland shelf indicate a limited penetration of drift ice south of Vestfirðir (the northwest peninsula of Iceland; ). However, it is not known whether these limits applied during the mid-to-late Holocene (the past ca 5 cal ka) and whether extensive drift ice reached southwest Iceland during the Little Ice Age (1300–1900 CE), the coldest interval of the past 10 ka as suggested by Jennings et al. (Citation2001). If this had occurred it could have had an impact on the subpolar gyre (Miller et al. Citation2012; Moreno-Chamarro et al. Citation2017).
Table 1. Location of the cores used in this study, and the average sediment accumulation rate (SAR) and the trend in the weight % of quartz over the last 5000 yrs.
Figure 1. Location map (see insert map for overall location). Dotted line shows the average April position 1870–1920 CE of the sea-ice edge (15 percent ice coverage). The lines labeled “Gray 1881” indicate the extent of sea ice as noted in his map (Gray Citation1881a). The full identifications for the cores are listed in . The names of the troughs in this part of the Iceland shelf are used in .
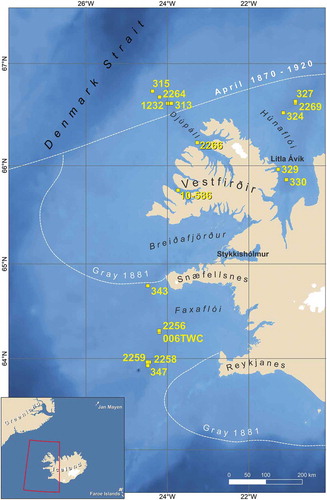
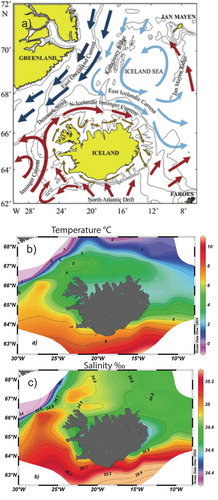
Figure 2. (A) Map showing the major surface currents around Iceland (red = warm, blue = cold), (B) temperature °C distribution at 50 m wd, and (C) salinity ‰ at 50 m wd for February 2013.
The purpose of this article is to develop reconstructions of drift-ice extent throughout the past 10,000 years on the northwest, west, and southwest Iceland shelf using the weight percent (wt%) of the mineral quartz in marine sediment cores, and to evaluate these data in the context of the present-day and historic observations of the distribution and controls on drift ice (Bergthórsson Citation1969; Ogilvie Citation1997; Ogilvie and Jónsdóttir Citation2000; ).
Background and methods
Ocean climate and currents
The Icelandic Marine and Freshwater Research Institute (www.hafro.is) has maintained a series of hydrographic transects on the shelf around Iceland with stations occupied seasonally since 1970. Warm and saline Atlantic water carried by the Irminger Current is transported clockwise around Iceland; the current divides off southwest Iceland and one branch continues north and east around Iceland as the North Iceland Irminger Current (NIIC; Stefansson Citation1962; ). Winter sea-surface temperatures in the Irminger Current are 6–4°C. Much colder, fresher, drift ice bearing Arctic and Polar surface waters flow toward Iceland from the Arctic Ocean in the East Greenland and East Iceland Currents (). The boundary between the Atlantic and Arctic and Polar surface waters is referred to as the North Iceland Front (Belkin, Cornillon, and Sherman Citation2009). A coastal current () runs clockwise around Iceland and this can transport glacial meltwater, fluvial runoff, and occasionally sea ice to southwest Iceland.
Drift ice
Both icebergs and sea ice are exported from the Arctic Basin (Eggertsson Citation1993; Hellmann et al. Citation2015; Darby et al. Citation2017) and are primarily transported along the north coast of Iceland by the East Iceland Current (Stefansson Citation1962; ). The vast majority of icebergs reaching the Iceland shelf originate from tidewater glaciers along the northeast–east Greenland margin of the Greenland ice sheet (Bigg Citation1999, Citation2016; Andrews, Bigg, and Wilton Citation2014; Darby et al. Citation2017). The release of icebergs to drift, however, depends on the state of the landfast sea ice around Greenland (Reeh et al. Citation2001; Reeh Citation2004), which can hold the icebergs inshore. The trajectory of iceberg drift is a function of sea-surface current speed and direction, plus the strength, persistence, and direction of surface winds (Daley and Veitch Citation2000; Bigg Citation2016), although iceberg shape is also important (Wadhams Citation2000).
Drift-ice proxies
A variety of proxies have been developed and used to estimate the presence of sea ice and drift ice (de Vernal et al. Citation2008, Citation2013; ), and all have limitations. Here we do not investigate further the application of diatom and dinoflagellate assemblages in the reconstruction of sea-ice history (see Jiang et al. Citation2001; Solignac, de Vernal, and Hillaire-Marcel Citation2004). We focus on the presence of quartz, a mineral that is generally absent in basalt and thus not a product of erosional processes on Iceland. We assess the limits and advantages of this method against sea-ice rafted driftwood (Eggertsson Citation1993) and the IP25 biomarker (Belt and Müller Citation2013; Cabedo-Sanz et al. Citation2016; ).
Figure 3. sediment diagram showing the limits of various proxies for drift ice (see text); namely, driftwood, quartz wt %, and the sea-ice biomarker IP25.
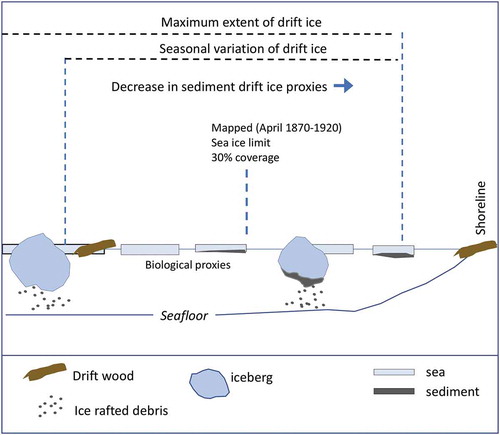
Siberian driftwood is plentiful on the beaches of northwest–north Iceland and its linkage to Russian river systems is a powerful indicator that drift ice reaches Icelandic waters (Eggertsson Citation1993; Hellmann et al. Citation2015). Research has shown that the driftwood needs to be transported on sea ice, because it cannot float for the many months it would take to drift to Iceland on its own (Haggblom Citation1982). However, as illustrated in , the driftwood could initially be carried on sea ice, and when those ice floes melted the driftwood could float for some undetermined distance from the sea-ice edge to shore.
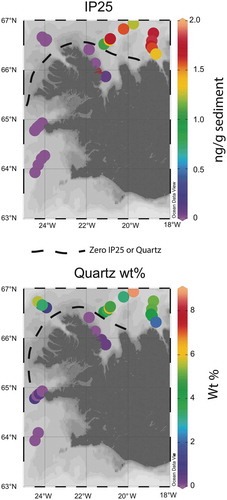
The IP25 biomarker is a robust indicator of the presence of sea ice (Belt et al. Citation2007; Belt and Müller Citation2013), but unlike quartz it is unrelated to the presence of icebergs. Off north Iceland (core MD99-2269) () a close correspondence has been noted between the presence of quartz wt% and IP25, both in downcore analysis (Cabedo-Sanz et al. Citation2016) as well as in the seafloor surface samples collected during the B997-cruise (Helgadóttir Citation1997). However, off west and southwest Iceland, the two proxies differ, with quartz wt% present in low percentages while IP25 is absent (). This difference might be attributed to a drift-ice (sea ice and icebergs) versus solely sea-ice association ().
Figure 4. Plot of the surface (1997 CE) values for IP25 and quartz % (Cabedo-Sanz et al. Citation2016). The dashed black line shows the approximate limits of zero detection for both proxies.
Research on the application of FeO grains (250–43 µm) as indicators of sediment sources in marine sediments around north Iceland has also been presented (Andrews et al. Citation2009; Darby et al. Citation2017). Darby et al. (Citation2017) derived sediment provenance via the geochemistry of sand grains in the 250–45 µm fraction of the core MD99-2263 from Djúpáll, northwest Iceland (). In this fraction the majority of the grains were derived from east and northeast Greenland and they concluded that the FeO-grain evidence from Djúpáll was weighted toward east Greenland iceberg sources as opposed to FeO grains originating from sources around the Arctic Basin.
Quantitative x-ray diffraction (qXRD)
Quartz is generally foreign to the basaltic bedrock of Iceland, although its presence has been noted in altered basalt (Ehlmann et al. Citation2012). In basalt silica is present as glass, an amorphous phase. Thus, quartz can be used as a proxy for drift ice around Iceland (Eiríksson et al. Citation2000; Andrews and Vogt Citation2014). For quartz to be transported onto the Iceland shelf, either in sea ice or icebergs, sediment has to be entrained into or onto the ice (). The presence of sediment in or on sea ice that is exported from the Arctic Ocean requires that the ice originate on the shallow shelves around the Arctic Basin (Dethleff Citation2005; Dethleff and Kuhlmann Citation2009, Citation2010; where the driftwood would also be emplaced during the nival flood period) or as glacial debris (Drewry Citation1986; Alley et al. Citation1997; Bigg Citation2016). The use of quartz as an index of the presence of drift ice requires that: (1) the drift ice contains sediment and (2) melting of the ice takes place. The wt% of quartz was determined by quantitative X-ray diffraction (qXRD) of the bulk sediment <2 mm (Eberl Citation2003; Andrews and Eberl Citation2007; see Supplementary Material). Quartz is present in both the clay-size and in the <2 mm fractions (Andrews and Eberl Citation2007). We use the wt% of calcite measured by qXRD (Eberl Citation2003) as a comparison to the quartz wt%. Changes in the wt% of calcite have been used as a proxy for marine productivity and hydrographic variability (Andrews et al. Citation2001a, Citation2001b), and are especially influenced by coccolith blooms (Giraudeau et al. Citation2010), which are a function of temperature and nutrient supply (Thórdardóttir Citation1984; Stefansson and Ólafsson Citation1991).
The detection limit for quartz and other minerals in qXRD (e.g., Cook et al. Citation1975; Kolla, Biscaye, and Hanley Citation1979; Armbruster, Tillman, and Hubbs Citation1994) has not received a lot of attention (see VyVerberg, Jaeger, and Dutton Citation2018). The quartz detection limit varies depending on the instrument, instrument settings, and analytical program used. In the INSTAAR Sediment Laboratory we routinely run measured (i.e., known) wt% mixtures of non-clay and clay minerals. This enables us to: (1) estimate the bias (absolute difference between the known and measured wt%) for selected minerals (Raven and Self Citation2017), including quartz and calcite, and (2) evaluate the statistical quality control of the time-series standards (Aabel Citation2016). To investigate the detection limits we performed experiments (see Supplementary Material) on: (1) a sediment mixture with measured amounts of quartz (3.7%), calcite, dolomite, pyroxene, and kaolinite (Supplementary Table 2a)—a smaller quartz standard was produced by splitting the sample and adding 50 percent by weight of brucite—and (2) quartz added to a ground basalt with 0 percent quartz. The results from the experiments indicated that: (1) repeated runs of the basalt samples always resulted in a 0 wt% quartz and (2) when small weighed fractions of quartz were added it was always detected by qXRD, although with variable wt% estimates (; see Supplementary Material). To avoid a bias related to possible instrument drift, the core samples for qXRD were always processed in a quasi-random sequence and not consecutively by depth. Because the qXRD results are normalized to sum to 100 percent the estimated quartz wt% is potentially affected by the totality of changes in mineral composition (Fisher and Underwood Citation1995). However, we noted little change between the estimated quartz wt% based on twelve versus thirty-five minerals (Supplementary Tables 2a and 2b).
Figure 5. Comparison of measured quartz wt% estimates based on (1) mixture of non-clay and clay minerals and (2) ground samples of basalt. Note that the estimated quartz wt% on basalt samples equals 0 percent (cross symbol) and that quartz was always detected when it was present. The 45° line marks the 1:1 association between measured and estimated wt% (see Supplementary Material for additional data and results).
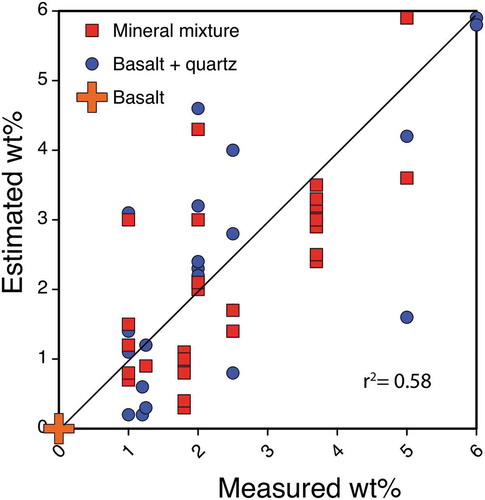
At the distal end of drift-ice transport the quartz wt% may be small and close to the detection limit, but if there is a constant but “trace” amount of quartz the former presence of drift ice is considered possible. However, we argue that what is important is not whether the wt% of quartz is absolutely accurate (), but whether there are statistically important trends in the time series. We use the non-parametric Mann-Kendal trend test (Hammer, Harper, and Ryan Citation2001) to ascertain if there is a significant increase (+), decrease (-), or no trend (NA) in quartz during the past 5 cal ka BP (). If the variations in quartz wt% are merely expected random variations about mean values, then a detectable trend would only occasionally arise by chance. Previously we have shown that there is strong regional coherence in the quartz signal from multiple cores on 250 yr and 100 yr resolution time series (Andrews Citation2009; Andrews et al. Citation2009; see B.1). An additional important reason for confidence in the use of quartz wt% as a proxy for drift ice is the significant correlations between measurements of the IP25 biomarker and quartz (e.g., ; Cabedo-Sanz et al. Citation2016; Darby et al. Citation2017).
Core chronologies
All radiocarbon dates used herein are published in INSTAAR Date Lists (Manley and Jennings Citation1996; Smith and Licht Citation2000; Dunhill, Andrews, and Kristjánsdóttir Citation2004; Quillmann et al. Citation2009). We have calibrated them using the intcal13 marine data and the Oxcal online program (Bronk Ramsey Citation2008; Reimer et al. Citation2013) using ∆R = 0 14C years for the local offset to the ocean reservoir correction. It is likely that this correction was variable during the Holocene (Eiríksson et al. Citation2004, Citation2010; Kristjánsdóttir Citation2005; and Supplementary Table 1). Depth and age models were constructed using a simple interpolation between the calibrated ages (Telford, Heegaard, and Birks Citation2003). Several cores extend into the earliest Holocene but we restrict our coverage to the past 10 cal ka BP. We also note that several cores did not resolve the last few 100 to 2 cal ka BP. Sediment accumulation rates (SAR, cm/ka) vary considerably through time and by site (, and ). In most cases the cores were sampled for mineralogy at 5–10 cm intervals. Because of the changes in the SARs and sampling density the resolution between the records differs markedly from multi-decadal to multi-century.
Iceland: Observational and historical evidence of sea ice and icebergs
Because of its impact on Icelanders’ lives sea-ice conditions were frequently noted in annals, letters, and reports. Accounts of sea ice can be found in sagas and various documentary sources from the Settlement, approximately 874 CE, onward, although neither on an annual basis nor with the exact timing or position noted accurately. Seasonal letters to the authorities were written by all sheriffs in Iceland from 1600 to 1890 CE, describing, among other things, ice conditions and climate (Ogilvie Citation1981). Many authors have described and compared different historical sources of sea ice, as well as how the ice could affect living conditions in the country (Thoroddsen Citation1916–1917; Bergthórsson Citation1969; Ogilvie Citation1981; Jónsdóttir Citation1995). Historical sources should be interpreted with caution and checked for interdependency. For example, it is possible that some sources confused broken-up locally formed ice with drift ice coming from the north.
Additional independent sources of sea-ice information off Iceland are maps established from the logbooks of Norwegian sealers. The sealing took place at the ice edge, mainly during the spring when sea ice tends to reach its maximum extent in these waters. Diaries of Icelandic farmers have also proven to be valuable to study sea-ice extent and how sea ice affected farming and fishing (Jónsdóttir Citation1995). As an example of the documentation from historical accounts, sea ice is described all around Iceland in 1695 (see Einarsson Citation1969, 322–29; ). Historical sea-ice records have been constructed from both observational and proxy studies. Koch (Citation1945) produced an historical compilation of variations of drift ice to distinguish it from locally formed sea ice around Iceland and an adaptation of this has been compiled by the Iceland Meteorological Office (IMO; Wallevik and Sigurjónsson Citation1998). Ogilvie (Citation1996) used documentary sources to create a sea-ice index for the Iceland shelf from 1600 to 1850 CE, showing a close correspondence between this index and the spring air temperatures recorded at Stykkishólmur, west Iceland (). Ogilvie and Jónsdóttir (Citation2000) extended this index up to the year 2000, showing relatively mild ice conditions for the twentieth century, apart from the first two decades, and the so-called sea-ice years, from 1965 to the 1970s. Sea ice did not reach Faxaflói in the twentieth century. The Snæfellsnes peninsula, west Iceland, was the only place that had no reports of sea ice, although sea ice was said to have reached Faxaflói () from the south, and Breiðafjörður from the north (Gray Citation1881a). This is not the only occasion when ice is reported to have reached Faxaflói having circulated with coastal currents around the east and south coasts (Vilmundarson Citation1971), but Breiðafjörður is sometimes covered by locally formed sea ice.
Figure 6. Map from Vilmundarson (Citation1969). Open circles show ice coming from the east in south Iceland (Hafís að austan) and from the west in northwest Iceland (Hafís að vestan). Sea ice off the north and east coast is not shown on this map; only the extremes. Other text on the map refers to individual Annals (annáll): Eyrarannáll before 1703 (um Þorra fram að sumri = from early year to next summer); Sauðlauksdalsannáll before 1778 CE; summary of Fitjaannáll before 1720 CE; Fitjaannáll before 1712 CE; Vallaannáll 1701 CE and later; Setbergsannáll 1715 CE. (The other text is 1 vika í maíbyrjun = one week in the beginning of May).
The Danish Meteorological Institute began systematic reporting of ice conditions off Iceland and Greenland in the late nineteenth century (Garðarsson Citation1999) and the Icelandic Meteorological Office has continued this effort. A cache of late nineteenth and early twentieth century Danish Meteorological Office ice maps was recently made available (brunnur.vedur.is/pub/trausti/) and a variety of earlier observations are being uncovered (Gray Citation1881a, Citation1881b) and compiled (e.g., Ogilvie Citation1996, Citation1997; Divine and Dick Citation2006). shows the average April position of the sea-ice edge (15 percent ice coverage) for 1870–1920 CE, and the limits in 1881 of sea ice (Gray Citation1881a, Citation1881b).
We have compiled previously unpublished data from the IMO on the occurrence of icebergs () and we also illustrate sea-ice data for the region. These data have not been published before with such high spatial and temporal resolution (). shows the distribution of reported icebergs between 1983 and 2011. shows the change in occurrence of sea ice between 1850 and 1950 in areas #724 and #622 highlighted in . The identification of areas on these figures uses the Marsden square protocols as approved by the World Meteorological Organization (the Marsden squares are the gray numbered grid shown in the background of ). Certain clusters in the data appear near stations on land, where observations are continuous (weather station Litla Ávík at Strandir [] is a classic example). The same might be the case for popular fishing grounds. Comparison between satellite data (radar and medium-resolution optical data) and reports of direct human observation indicates that not all icebergs or ice floes are reported to the IMO. In interviews, ship captains mention that they would only report ice that was unexpected, or could pose a danger to navigation.
Figure 7. (A) Sea ice and icebergs off the coast of Iceland from 1983 to 2011. The data are from the Icelandic Meteorological Office (IMO), and are based on reports from ships, coastal stations, and ice reconnaissance flights from the Icelandic Coast Guard. The points are color coded by time intervals of observations. (B) Sea-ice indices in Marsden square areas #724 (blue) and #622 (orange), marked in the overview map. Note that the Marsden square numbers increase from right to left in increments of two. The indices are based on historical data, logbooks from ships, reports from weather stations, farmers’ diaries, letters, and newspapers. The temporal resolution is one month, so it is enough for the ice to be observed within the region for one day of the month to register. The graph shows five-year sums. There is a shift toward the data sources becoming more reliable with time, as observations became more systematic.
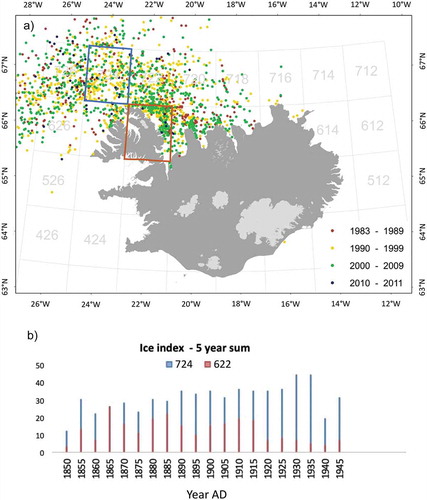
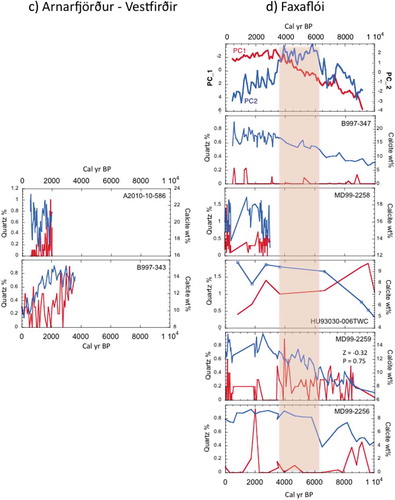
Figure 8. Data from (A) Húnaflói; (B) Djúpáll; (C) Breiðafjörður, Kolluáll; and (D) Faxaflói (see and for core locations). In all graphs quartz = red, calcite = blue, and they are plotted against calibrated years BP. Time scales for C.1 and C.2 are for the past 4,000 cal yr BP. Graphs A.1 and A.2 show the quartz and calcite data (Moros et al. Citation2006) and sea-ice biomarker data (Cabedo-Sanz et al. Citation2016) from MD99-2269. B.1 is the average and standard deviation estimates of quartz and k-feldspars in north–northwest Iceland cores (Andrews Citation2009). Graph D.1 shows the principal component scores and the vertical dashed lines outline the Holocene marine climate boundaries (Kristjánsdóttir et al. Citation2016).
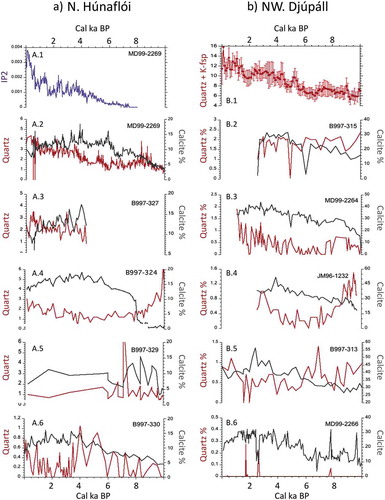
Figure 8. (Continued).
The distribution of icebergs has a prominent west–east trend caused by the major source of icebergs—Scoresby Sund and other east Greenland tidewater glaciers north of approximately 66°N (Seale et al. Citation2011). Occasional icebergs have been reported eastward to areas #616 and #716, while the southernmost observations are in #526 and #626. Icebergs drift toward Vestfirðir and have even been observed to enter some of the fjords and bays (). A slight bias is apparent in the Strandir region (), where there is a cluster of ice reports close to a manned weather station (Litla Ávík). The data set has not been filtered to prevent the same iceberg being registered more than once as it drifts, or if many ships or stations detected it. However, as a map of iceberg sightings in the past few decades this map should give a good indication of the spatial limits. A source of error in the more recent IMO reports is the lack of differentiation between icebergs and floes of drift ice.
Drift-ice variations: Results from the marine cores
Some of the data from cores discussed here were included in a previous article that synthesized the individual results into a single composite 100 yr resolution record (Andrews Citation2009). However, the only cores for which the quartz wt% data have been published are MD99-2269 (Moros et al. Citation2006), MD99-2263 (Andrews et al. Citation2009), and MD99-2258 (Axford et al. Citation2011). As noted earlier, sediment accumulation rates for the cores (, Supplementary Table 1) vary considerably and are the fundamental control on the temporal resolution of our data (e.g., A.5). Core MD99-2269 () has been studied for a variety of high-resolution proxies recording changes in Holocene ocean conditions (Moros et al. Citation2006; Cabedo-Sanz et al. Citation2016; Kristjánsdóttir et al. Citation2016; e.g., A.1 and 8A.2). Given the variability in the estimated wt% of quartz versus the measured wt% of quartz (), it is important to note that the estimated wt% from the cores () rarely reveal large between-sample variations; rather, where we have reasonable sample density, many sites show a statistically significant increase in quartz wt% throughout the past 5 cal ka BP ().
A synthesis of several marine climate proxies in MD99-2269 () indicated a threefold division of the Holocene with boundaries at both 6350 and 3450 cal yr BP (Kristjánsdóttir et al. Citation2016; D.1). In terms of our data the probability of a marine sediment core (with a diameter of ≤10 cm) recording (i.e., receiving) ice-rafted sediment depends on: (1) whether the sea ice or iceberg contained sediment, (2) whether that 10 cm diameter portion of the sea floor had an ice flow or iceberg drift over it, and (3) whether melting resulted in sediment release. Because southwest Iceland () is well outside modern sea-ice limits, the probability of one of the southwest sites recording the rare passage of drift ice is extremely small (). This low probability of drift ice being recorded even applies to our sites in inner Húnaflói and Ísafjarðardjúp (e.g., MD99-2266, and ) where, although sea ice and icebergs have been observed (), the probability of a coherent drift-ice signal must be very low ().
The data on the drift ice occurrence of the past few decades to the last millennium around Iceland (, , and ) indicate a significant difference between the northwest–north shelf versus the area south of Snæfellsnes (), with the northern sites generally indicating an increase in quartz during the past 5 cal ka BP, whereas sites south of Snæfellsnes have either no trend or a negative trend (). Marine core proxy data can be used to ascertain regional variations on Holocene time scales at multi-decadal to multi-century resolution. As noted earlier, in several studies the sea-ice biomarker IP25 and the wt% quartz track each other closely, both in terms of the seafloor surface samples (see ) and at specific core sites (Axford et al. Citation2011; Cabedo-Sanz et al. Citation2016; Darby et al. Citation2017).
North Iceland shelf: Húnaflóaáll–Húnaflói
Four cores have been studied from Húnaflói (Helgadóttir Citation1997), which lies on the eastern margin of our study area and includes areas #720 and #620 ( and ). Húnaflói experiences rare incursions of drift ice today, including both icebergs and sea ice (). The inner shelf sites lie within the NIIC but cold and fresh Arctic and Polar waters overlie the sites further seaward (). Paleoclimate proxy data from these sites have been published (Andrews and Giraudeau Citation2003; Castaneda et al. Citation2004; Solignac, de Vernal, and Hillaire-Marcel Citation2004; Smith et al. Citation2005).
Figure 9. Transects of Holocene quartz wt% data for cores along the Húnaflóaáll-Húnaflói and Djúpáll-Ísafjarðardjúp troughs (), distance calculated from the outer cores. Note that the exact time period covered for each core varies (). The plots also include the minimum and maximum wt% and the median wt% for each core. Also shown is the occurrence of driftwood on beaches and the average April 1870–1920 sea-ice edge (see ).
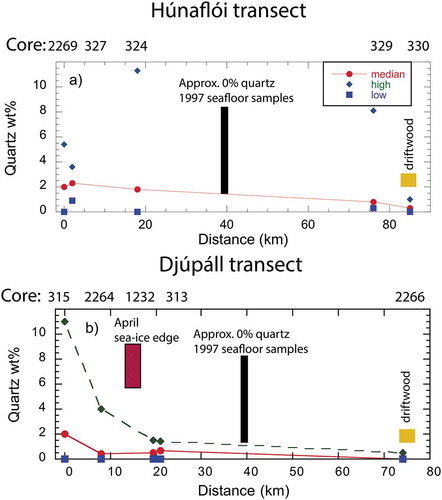
The outermost core on the Húnaflói transect is the high-resolution sampled and well-dated core MD99-2269 (Moros et al. Citation2006; Stoner et al. Citation2007). This core lies close to the average April (1870–1920 CE) sea-ice limit (; Divine and Dick Citation2006). During the past 10 cal ka BP quartz wt% (drift-ice proxy) varied between 1 percent and 4 percent at MD99-2269 () and calcite (marine productivity proxy) rose from approximately 2 percent to maximum values of approximately 13–15 percent between 6 and 4 cal ka BP. The sea-ice biomarker IP25 (Cabedo-Sanz et al. Citation2016) was only quantified for the past 8 cal ka BP () and during this period is correlated with the quartz wt%. At the other outer Húnaflói sites (#327 and #324) the trends of the quartz and calcite parallel those of MD99-2269, with calcite wt% declining during the past 4 cal ka BP, whereas wt% quartz shows a slight but irregular increase. B997-324 has a significant peak in quartz in the early Holocene (between 10 and 8 cal ka BP), but quartz decreased to the lowest values between 6 and 4 cal ka BP. At B997-330 close to the coast (, , and ), the calcite wt% is a close match to the MD99-2269 data but the quartz wt% are less than 1 percent with rather surprising, if real, “high” peaks of approximately 1 percent in the mid-Holocene between 5.5 and 4 cal ka BP. The rather persistent presence of low quartz wt% may support some incursions of drift ice to the inner part of Húnaflói throughout the Holocene, a condition that has occurred in recent time (). The calcite record from B997-329 between 10 and 8 cal ka is different from the other records, but because of the slow rate of sediment accumulation sampling is too sparse to comment further.
Northwest Iceland shelf: Djúpáll–Ísafjarðardjúp
Five cores have been studied from Djúpáll at sites extending from near the shelf break and Denmark Strait to the mouth of Ísafjördur (, ). The outer area lies within the 1870–1920 CE average April sea-ice limit (). Recent incursions of sea ice brought sea ice to the Iceland northwest coast (Jónsdóttir and Sveinbjörnsson Citation2007). However, today the trough is mainly in the domain of the warm and salty Irminger Current (). The area includes Marsden squares #624 and #724, which have numerous iceberg sightings and they have been observed along the trough well into Ísafjarðardjúp (). The most detailed temperature estimates from Djúpáll for the past 2 cal ka BP are based on aragonite mollusk shells (Patterson et al. Citation2010) that indicated temperature variations of approximately 4°C, with a minimum bottom water temperature at approximately 1400 CE.
A feature of the qXRD data in Djúpáll is the very large calcite percentage, ranging between 20 percent and 50 percent (), indicating high marine productivity especially in foraminifera. The Djúpáll sites indicate overall a rising trend in calcite from 10 to 2 cal ka BP, after which calcite declines. The quartz wt% declines landward from a relatively constant approximately 2 percent from 10 to 2 cal ka BP at the outer Djúpáll site (B997-315) to virtually no quartz at the mouth of the Ísafjarðardjúp (MD99-2266; ). Sites in the mid-trough (MD99-2263/64, B997-313, and JM96-1232) show similar Holocene variations in quartz wt% as MD99-2269 in Húnaflói and thus are representative of conditions around north–northwest Iceland (Andrews Citation2009; B.1). This trend in quartz wt% indicates the presence of drift ice between 10 and 8 cal ka BP and during the past 2 cal ka BP. Actual estimated quartz wt% values are low throughout the cores, rarely exceeding 2 percent, but this is partially explained by the very high calcite wt% estimates. Darby et al. (Citation2015, Citation2017) argued that medium sand–size to coarse silt–size iron oxide grains were carried to the area (MD99-2263/MD99-2264) not only primarily by icebergs from east–northeast Greenland but also by sea ice from sites around the Arctic Basin.
West Iceland shelf: Arnarfjörður, Kolluáll
This area () is represented by two sediment cores (Arnarfjörður AA2010-10-586 and Kolluáll B997-343; ) that are limited to the past 2–3 cal ka BP () and lie close to the observed limits of drifting icebergs (Marsden squares #626 and #624; ); sea ice occasionally has been observed drifting in from the north. As indicated by Gray’s map for 1882, drift ice may have extended south into Kolluáll, near to both sites (). Local fast ice can form along the coastline in severe winters. The two sediment records indicate low but persistent quartz wt% (<1%), approximately 2–1.5 cal ka BP, which decreased toward the present, suggesting an opposite trend from sites to the northwest and north (). These values of quartz wt% are close to the detection limit, but we note that repeated measurements of basalt samples always resulted in zero wt% quartz ().
Southwest Iceland shelf: Faxaflói
The southwest Iceland shelf had no reported icebergs in the period 1983–2000 (, area #424) and it lies well south of most modern limits of drift ice. The sea-ice biomarker IP25 was not present during the past 2 cal ka BP in core MD99-2258 (Axford et al. Citation2011) and seafloor samples collected in 1997 also had no trace of the sea-ice biomarker (). Quartz wt% estimates are generally less than 1 percent () and for most cores only an occasional trace is detected. These data, in conjunction with our experimental runs (), support the argument that this area of the Iceland shelf has remained largely outside the limits of drift ice. Gray’s map for April and May 1882 shows the ice encircling Iceland but, with Faxaflói ice free (). Jennings, Andrews, and Wilson (Citation2015) argued that icebergs from the Laurentide Ice Sheet reached southwest Iceland during the early Holocene and certainly the quartz wt% are also much higher in cores such as MD99-2256 and MD99-2259 immediately following deglaciation (; Andrews et al. Citation2018). Faunal and stable isotopic evidence in a push core (from box core HU93030-003; Jennings et al. Citation2001) suggested colder ocean conditions during the Little Ice Age (LIA) and perhaps also indicating drift-ice transport into Faxaflói in the coastal current. However, it is unclear how much sediment this drift ice would retain after such a long clockwise transport trajectory around Iceland, when quartz wt% on the northern shelf (e.g., ) was already quite low. The isolated quartz approximately 1 percent peak in MD99-2256 may represent a rare incursion of drift ice. In the recent past drift ice has been observed on a few occasions, and always from the south, brought into the area by the clockwise surface circulation ( and ). Ice is reported to have reached Reykjanes in 1850, 1859, and 1881.
Discussion
A critical issue in comparing the historical and observation records (e.g., and ) with the marine proxy data ( and ) is that the marine sediment data, depending on the rate of sediment accumulation, integrate events throughout multi-decades to centuries versus the yearly time scale that is inherent to the observational data. In addition, marine piston or gravity coring frequently does not capture or retain the uppermost sediment column (see Supplementary Table); thus, the records are often missing all or part of the LIA. Alternatively, box cores (e.g., MD99-2258, MD99-2263; same site as MD99-2264) are specifically designed to retain surface and historic-aged sediments (Axford et al. Citation2011). A further complication is that the period when drift-ice observations are available (past few hundred years) is a period when there is considerable uncertainty in the calibration of radiocarbon dates (e.g., Sejrup et al. Citation2010) because of significant structural changes in the radiocarbon calibration curve. This, plus the relatively low rates of sediment accumulation in our box cores, means that direct decadal comparisons with other Iceland LIA records (Ogilvie and Jónsson Citation2001; Axford et al. Citation2011) are not possible. Regardless, the pattern of quartz in experimental data (), recent seafloor sediments (), and regional Holocene patterns ( and ) support the iceberg and sea-ice observations () that indicate a strong contrast between north and northwest Iceland versus the west and southwest.
The wt% of calcite () broadly reflects marine productivity and all the records indicate an increase from low values at 10 cal ka BP to maximum values between 6 and 4 cal ka BP. Several cores (e.g., B997-324, JM96-1232) have their highest quartz wt% values in the period prior to approximately 8 cal ka BP. The consistent suppression of calcite in the cores until approximately 8 cal ka BP (e.g., B997-324, ) implies the presence of a low salinity meltwater lid, possibly reflecting the influence around Iceland of the late deglaciation of the Laurentide Ice Sheet. The marine core evidence (see ) indicates that quartz wt% starts to increase approximately 6 cal ka BP, suggesting an association with the onset of Neoglaciation and possibly reflecting readvances in east Greenland tidewater glaciers (Andrews et al. Citation1997; Vasskog et al. Citation2015). Most of the cores from the northwest and north Iceland outer to mid-shelf areas show a persistent and statistically significant trend for a quartz wt% increase during the past 5 cal ka BP (), thus also suggesting a link with the onset of Neoglaciation (Geirsdóttir et al. Citation2019). However, research around the Arctic Basin also pointed out that the shallow Russian shelves were flooded by the postglacial sea level rise approximately 6 cal ka BP (Bauch et al. Citation2001; Blaschek and Renssen Citation2013), which would probably have resulted in a significant increase of quartz-rich sediment entrainment in sea ice (Vogt Citation1997; Dethleff Citation2005; Dethleff and Kuhlmann Citation2009). The records () show a steady increase in the wt% quartz in cores from the outer areas of north and northwest Iceland and those that lie seaward of the zero wt% quartz boundary ( and , ). The evidence for drift ice in southwest Iceland, based on the quartz proxy (), indicates that there have been no persistent Neoglacial incursions of drift ice, although MD99-2258 showed a marked increase in the past 300 years or so. It is also intriguing that the quartz data from A2010-10-586 and B997-343 (), although only evident in trace amounts, show a significant decrease in quartz during the past 4–2 cal ka BP, thus an opposing trend to data from sites to the north ().
Earlier we noted that the strong correlation in terms of seafloor data between the quartz and IP25 records in MD99-2269 (; Cabedo-Sanz et al. Citation2016) suggests that the quartz record is primarily associated with sea ice rather than icebergs. This is based on the fact that diatom producers of IP25 have no association with glacial ice (Belt and Müller Citation2013). In Djúpáll (MD99-2264 and B997-313) there is evidence for a strong east Greenland (iceberg) component in sediment composition (Darby et al. Citation2017). However, we note that there is little evidence in X-radiographs from these cores of coarse ice-rafted debris (IRD) (>2 mm) during the past 10 cal ka BP. Also, our data indicate that there is little evidence for any prolonged periods of drift ice reaching Faxaflói. Any ice that reached the area would be floe ice carried into the region by the coastal current and would not form a dense ice pack, consistent with modern and historic information on the area ( and ).
Plots of the quartz wt% along the northern shelf (Húnaflóaáll-Húnaflói) and northwest shelf (Djúpáll-Ísafjarðardjúp) troughs show a consistent decrease, as might be expected toward the coast (). The median values of quartz are less than 0.5 percent in both troughs, probably reflecting the effect of increased melting in the IC and NIIC on the inner shelf (). Based on the 1997 seafloor samples (), the recent 0 percent quartz limit lies approximately 40 km from the outer coast () even though the map of the iceberg distribution () shows numerous icebergs landward of that limit. This speaks to the questions of: (1) Do the icebergs still retain sediment after a long drift? and (2) what is the probability of an iceberg tracking over a core (~75 cm2) site? We are unable to provide any rigorous estimate for this probability but a simple ratio of the total area of the seafloor versus that of the combined icebergs is of the order of 0.001. and indicate that driftwood, as an index of sea ice, significantly extends the drift-ice limit beyond the evidence provided by other proxies ().
Using a series of historical archives, Lamb (Citation1979) discussed the conditions in the northwest North Atlantic during the LIA at approximately 1675, suggesting that sea surface temperatures were 5°C colder than at present. The impact of the export of freshwater (in the form of sea ice) on the subpolar gyre has been modeled (Moreno-Chamarro et al. Citation2017) and the impact of the “Great Salinity Anomaly” (1969–1970; Dickson et al. Citation1988) on the Iceland climate is well documented (Ólafsson Citation1999). The agreement between the export of heavy, multiyear ice (the so-called storis; Schmith and Hanssen Citation2003) along the Greenland shelf and the Iceland drift-ice data (Alonso-Garcia et al. Citation2013) during the past 150 yr suggests that climatic events in the Arctic Basin and Fram Strait, especially freshwater and sea-ice export, are critical (Mysak and Power Citation1992; Rogers, Yang, and Li Citation2005). Such variations have been used to explain the record of driftwood (Tremblay, Mysak, and Dyke Citation1997) on beaches in Arctic Canada.
Conclusions
We present a new compilation of sea-ice conditions off Iceland and the first compilation of the locations of icebergs during recent decades in the region () and compare this information with down-core analyses of sea-ice proxies. The modest values of quartz in the sediment matrix (<2 mm) show that the observed invasion of drift ice along the north shelf (Húnaflóaáll-Húnaflói) and northwest shelf (Djúpáll-Ísafjarðadjúp) troughs ( and ) was persistent, especially during the Early (10–8 cal ka BP) and Late Holocene (past 2 cal ka BP). Despite errors in the estimates of the wt% of quartz (; Supplementary Material; Raven and Self Citation2017) the coherent presence or absence of quartz (), and the agreement in the position of 0 percent quartz in both surface and core transects ( and ) gives us confidence in our overall conclusions. The decreases in quartz wt% on the inner shelf of the northern transects ( and ) suggests that the presence of warm Atlantic water has been a persistent factor throughout the past 10 cal ka BP. We see little evidence in our quartz wt% proxy for a prolonged Neoglacial invasion of drift ice onto the southwest Iceland shelf. However, the broad-scale geographic trend must also be viewed in the context of the changes at each core site (), which especially in the two northern areas shows a broad U-shaped pattern in quartz with a clear increase in the past several millennium.
The difference in the resolution between the yearly observational and historical records and the decadal to century marine core records indicates that comparisons need to be based on trends, and it is unrealistic, given the sampling interval and rates of sediment accumulation (), to search for specific severe ice years within marine core archives, although high-resolution sampling at sites with rates of sediment accumulation greater than or equal to 100 cm/ky could derive robust decadal resolutions ().
Supplemental Material
Download Zip (2.4 MB)Acknowledgments
JTA acknowledges the support of the National Science Foundation for much of the qXRD data reported here. Wendy Roth is acknowledged for her assistance in the XRD Laboratory and several undergraduate research assistants have throughout the years been extremely helpful in running samples from the cores used in this study. Cruise B997 was supported by the Iceland Marine Institute and NSF grant ATM-9531397 and the MD99 Marion Dufresne cruise was in part supported by NSF-OCE and by The Icelandic Research Center (RANNIS). RANNIS supported the Icelandic research on MD99-2264 and MD99-2269. We thank the editor Dr. Anne E. Jennings, Dr. John Jaeger, and two other reviewers for the time and effort in making substantive recommendations for the improvement of the article.
Disclosure statement
No potential conflict of interest was reported by the authors.
Related Research Data
References
- Aabel. 2016. Aabel NG software package. http://www.gigawiz.com/.
- Alley, R. B., K. M. Cuffey, E. B. Evenson, D. E. Lawson, and J. C. Strasser. 1997. How glaciers entrain and transport basal sediment: Physical constraints. Quaternary Science Review 16:1017–38. doi:10.1016/S0277-3791(97)00034-6.
- Alonso-Garcia, M., J. T. Andrews, S. T. Belt, P. Cabedo-Sanz, D. Darby, and J. Jaeger. 2013. A multi-proxy and multi-decadal record (to AD 1850) of environmental conditions on the East Greenland shelf (~66°N). The Holocene 23:1672–83.
- Andrews, J. T. 2009. Seeking a Holocene drift ice proxy: Non-clay mineral variations from the SW to N-central Iceland shelf: Trends, regime shifts, and periodicities. Journal of Quaternary Science 24:664–76. doi:10.1002/jqs.v24:7.
- Andrews, J. T., and C. Vogt. 2014. Source to Sink: Statistical identification of regional variations in the mineralogy of surface sediments in the western Nordic Seas (58°N–75°N; 10°W–40°W). Marine Geology 357:151–62.
- Andrews, J. T., D. A. Darby, D. D. Eberl, A. E. Jennings, M. Moros, and A. Ogilvie. 2009. A robust multi-site Holocene history of drift ice off northern Iceland: Implications for North Atlantic climate. The Holocene 19:71–78. doi:10.1177/0959683608098953.
- Andrews, J. T., and D. D. Eberl. 2007. Quantitative mineralogy of surface sediments on the Iceland shelf, and application to down-core studies of Holocene ice-rafted sediments. Journal of Sedimentary Research 77:469–79. doi:10.2110/jsr.2007.045.
- Andrews, J. T., G. Helgadóttir, Á. Geirsdóttir, and A. E. Jennings. 2001a. Multicentury-scale records of carbonate (hydrographic?) variability on the N. Iceland margin over the last 5000 yrs. Quaternary Research 56:199–206. doi:10.1006/qres.2001.2253.
- Andrews, J. T., G. B. Kristjánsdóttir, Á. Geirsdóttir, J. Hardardóttir, G.Helgadóttir, A. E. Sveinbjörnsdóttir, A. E. Jennings, and L. M. Smith. 2001b. Late Holocene (~5 cal ka) trends and century-scale variability of N. Iceland marine records: Measures of surface hydrography, productivity, and land / ocean interactions. In The oceans and rapid climate change: Past present and future, ed. D. Seivdov, B. Haupt, and M. Maslin, 69–81. Washington, DC: American Geophysical Union.
- Andrews, J. T., G. R. Bigg, and D. J. Wilton. 2014. Holocene sediment transport from the glaciated margin of East/Northeast Greenland (67-80°N) to the N Iceland shelves: Detecting and modeling changing sediment sources. Quaternary Science Reviews 91:204–17.
- Andrews, J. T., and J. Giraudeau. 2003. Multi-proxy records showing significant Holocene environmental variability: The inner N Iceland Shelf (Húnaflói). Quaternary Science Reviews 22:175–93. doi:10.1016/S0277-3791(02)00035-5.
- Andrews, J. T., L. M. Smith, R. Preston, T. Cooper, and A. E. Jennings. 1997. Spatial and temporal patterns of iceberg rafting (IRD) along the East Greenland margin, ca. 68 N, over the last 14 cal.ka. Journal of Quaternary Science 12 (1):1–3.
- Andrews, J. T., P. Cabedo‐Sanz, A. E. Jennings, S. Olafsdottir, S. T. Belt, and A. Geirsdottir. 2018. Sea ice, ice-rafting, and ocean climate across Denmark Strait during rapid deglaciation (~16 to 12 cal ka BP) of the Iceland and East Greenland shelves. Journal of Quaternary Science 33 (1):112–30. doi:10.1002/jqs.3007.
- Armbruster, D. A., M. D. Tillman, and L. M. Hubbs. 1994. Limit of detection (LOD)/limit of quantitation (LOQ): Comparison of the empirical and the statistical methods exemplified with GC-MS assays of abused drugs. Clinical Chemistry 40 (7):1233–38.
- Axford, Y., C. S. Andresen, J. T. Andrews, S. T. Belt, Á. Geirsdóttir, G. Massé, G. H Miller, S. Ólafsdóttir, and L. L. Vare. 2011. Do paleoclimate proxies agree? A test comparing 19 late Holocene climate and sea‐ice reconstructions from Icelandic marine and lake sediments. Journal of Quaternary Science 26:645–56. doi:10.1002/jqs.1487.
- Bauch, H. A., T. Müller-Lupp, E. Taldenkova, R. F. Spielhagen, H. Kassens, P. M. Grootes, J. Thiede, J. Heinemeier, and V. V. Petryashov. 2001. Chronology of the Holocene transgression at the North Siberian margin. Global and Planetary Change 31:125–39. doi:10.1016/S0921-8181(01)00116-3.
- Belkin, I. M., P. C. Cornillon, and K. Sherman. 2009. Fronts in large marine ecosystems. Progress in Oceanography 81:223–36. doi:10.1016/j.pocean.2009.04.015.
- Belt, S. T., G. Masse, S. J. Rowland, M. Poulin, C. Michel, and B. LeBlanc. 2007. A novel chemical fossil of palaeo sea ice: IP25. Organic Gechemistry 38:16–27. doi:10.1016/j.orggeochem.2006.09.013.
- Belt, S. T., and J. Müller. 2013. The Arctic sea ice biomarker IP25: A review of current understanding, recommendations for future research and applications in palaeo sea ice reconstructions. Quaternary Science Reviews 79:9–25. doi:10.1016/j.quascirev.2012.12.001.
- Bergthórsson, P. 1969. An estimate of drift ice and temperature in iceland in 1000 years. Jökull 19:94–101.
- Bigg, G. R. 1999. An estimate of the flux of iceberg calving from Greenland. Arctic, Antarctic, and Alpine Research 31:174–78. doi:10.1080/15230430.1999.12003294.
- Bigg, G. R. 2016. Icebergs. Their science and links to global change, 240. Cambridge, UK: Cambridge University Press.
- Blaschek, M., and H. Renssen. 2013. The impact of early Holocene Arctic shelf flooding on climate in an atmosphere-ocean-sea-ice model. Climate of the Past 9:2651–67. doi:10.5194/cp-9-2651-2013.
- Bronk Ramsey, C. 2008. Deposition models for chronological records. Quaternary Science Reviews 27:42–60. doi:10.1016/j.quascirev.2007.01.019.
- Cabedo-Sanz, P., S. T. Belt, A. E. Jennings, J. T. Andrews, and A. Geirsdóttir. 2016. Variability in drift ice export from the Arctic Ocean to the North Icelandic Shelf over the last 8000 years: A multi-proxy evaluation. Quaternary Science Reviews 146:99–115. doi:10.1016/j.quascirev.2016.06.012.
- Castaneda, I. S., M. L. Smith, G. B. Kristjánsdóttir, and J. T. Andrews. 2004. Temporal changes in Holocene δ18O records from the northwest and central North Iceland Shelf. Journal of Quaternary Science 19:1–14. doi:10.1002/jqs.841.
- Cook, H. E., P. D. Johnson, J. C. Matti, and T. Zemmels. 1975. Methods of sample preparation, and X-ray diffraction data analysis, X-ray mineralogy laboratory, Deep-Sea Drilling Project, University of CA, Riverside. In Initial reports of the Deep Sea Drilling Project, ed. D. E. Hayes, L. A. Frakes, et al., 999–1007. Washington DC: United States Government Printing Office.
- Daley, C., and B. Veitch. 2000. Iceberg evolution modelling: A background study. Memorial University PERD/CHC Report 20-53, 20000-05-06, St John’s, Newfoundland, Canada, 49 pp.
- Darby, D. A., J. T. Andrews, S. T. Belt, A. E. Jennings, and P. Cabedo-Sanz. 2017. Holocene cyclic records of ice-rafted debris and sea ice variations on the East Greenland and NW Iceland margins. Antarctic, Arctic, and Alpine Research 49:649–72. doi:10.1657/AAAR0017-008.
- Darby, D. A., W. Myers, S. Herman, and B. Nicholson. 2015. Chemical fingerprinting, a precise and efficient method to determine sediment sources. Journal of Sedimentary Research 85 (3):247–53.
- de Vernal, A., C. Hillaire-Marcel, S. Solignac, T. Radi, and A. Rochon. 2008. Reconstructing sea ice conditions in the Arctic and Sub-Arctic prior to human observations. In Arctic sea ice decline: Observations, projections, mechanisms and implications, ed. E. T. DeWeaver, C. M. Bitz, and L.-B. Tremblay, 27–45. Washington, DC: American Geophysical Union.
- de Vernal, A., R. Gersonde, H. Goosse, M. S. Seidenkrantz, and E. W. Wolff. 2013. Sea ice in the paleoclimate system: The challenge of reconstructing sea ice from proxies - an introduction. Quaternary Science Reviews 79:1–8. doi:10.1016/j.quascirev.2013.08.009.
- Dethleff, D. 2005. Entrainment and export of Laptev Sea ice sediments, Siberian Arctic. Journal of Geophysical Research-Oceans 110. doi:10.1029/2005jc003294.
- Dethleff, D., and G. Kuhlmann. 2009. Entrainment of fine-grained surface deposits into new ice in the southwestern Kara Sea, Siberian Arctic. Continental Shelf Research 29:691–701. doi:10.1016/j.csr.2008.11.009.
- Dethleff, D., and G. Kuhlmann. 2010. Fram Strait sea-ice sediment provinces based on silt and clay compositions identify Siberian Kara and Laptev seas as main source regions. Polar Research 29:265–82. doi:10.1111/j.1751-8369.2010.00149.x.
- Dickson, R., J. Lazier, J. Meincke, P. Rhines, and J. Swift. 1996. Long-term cordinated changes in the convective activity of the North Atlantic. Progress in Oceanography 38:241–95. doi:10.1016/S0079-6611(97)00002-5.
- Dickson, R. R., J. Meincke, S. Malmberg, and A. Lee. 1988. The “Great Salinity Anomaly” in the Northern North Atlantic 1968–1982. Progress in Oceanography 20:103–51. doi:10.1016/0079-6611(88)90049-3.
- Divine, D. V., and C. Dick. 2006. Historical variability of the sea ice edge position in the Nordic Seas. Journal of Geophysical Research 111:1 of 14. doi:10.1029/2004JC002851.
- Drewry, D. 1986. Glacial geologic processes, 276. London: Edward Arnold.
- Dunhill, G., J. T. Andrews, and G. B. Kristjánsdóttir. 2004. Radiocarbon date list X: Baffin Bay, Baffin Island, Iceland, Labrador, and the northern North Atlantic. Occasional Paper No. 56, Institute of Arctic and Alpine Research, University of Colorado, Boulder, 77 pp.
- Eberl, D. D. 2003. User guide to RockJock: A program for determining quantitative mineralogy from X-ray diffraction data. United States Geological Survey, Open File Report 03-78, Washington, DC: United States Geological Survey, 40 pp.
- Eggertsson, O. 1993. Origin of the driftwood on the coasts of Iceland: A dendrochronological study. Jökull 43:15–32.
- Ehlmann, B. L., D. L. Bish, S. W. Ruff, and J. F. Mustard. 2012. Mineralogy and chemistry of altered Icelandic basalts: Application to clay mineral detection and understanding aqueous environments on Mars. Journal of Geophysical Research-Planets 117:1 of 27. doi:10.1029/2012JE004156.
- Einarsson, M. Á., ed. 1969. Hafísinn, 552. Almenna, Iceland: Bókafélagið.
- Eiríksson, J., G. Larsen, K. L. Knudsen, J. Heinemeier, and L. A. Símonarson. 2004. Marine reservoir age variability and water mass distribution in the Iceland Sea. Quaternary Science Reviews 23:2247–68. doi:10.1016/j.quascirev.2004.08.002.
- Eiríksson, J., K. L. Knudsen, G. Larsen, J. Olsen, J. Heinemeier, H. B. Bartels-Jónsdóttir, H. Jiang, L. H. Ran, and L. A. Símonarson. 2010. Coupling of palaeoceanographic shifts and changes in marine reservoir ages off North Iceland through the last millennium. Palaeogeography, Palaeoclimatology, Palaeoecology 302:95–108. doi:10.1016/j.palaeo.2010.06.002.
- Eiríksson, J., K. L. Knudsen, H. Haflidason, and P. Henriksen. 2000. Late-glacial and Holocene paleoceanography of the North Iceland Shelf. Journal of Quaternary Science 15:23–42. doi:10.1002/(SICI)1099-1417(200001)15:1<23::AID-JQS476>3.0.CO;2-8.
- Fisher, A. T., and M. B. Underwood. 1995. Calibration of an X-ray diffraction method to determine relative mineral abundances in bulk powders using matrix singular decomposition: A test from the Barbados accretionary complex. Proceedings of the Ocean Drilling Program, Scientific Results 156:29–37.
- Garðarsson, H. 1999. Saga Veðurstofu Íslands. Mál og mynd, 417. Reykjavík, Iceland.
- Geirsdóttir, A., G. H. Miller, J. T. Andrews, D. J. Harning, L. S. Anderson, C. Florian, D. J. Larsen, and T. Thordarson. 2019. The onset of Neoglaciation in Iceland and the 4.2 ka event. Climate of the Past 15:25–40. doi:10.5194/cp-15-25-2019.
- Giraudeau, J., S. Solignac, M. Moros, J. T. Andrews, and E. Jansen. 2010. Millennial-scale variability in Atlantic water advection to the Nordic Seas derived from Holocene coccolith concentration records. Quaternary Science Reviews 29:1276–87. doi:10.1016/j.quascirev.2010.02.014.
- Gray, D. 1881a. Ice chart of the Arctic Ocean between Greenland and Spitsbergen. From observations by Capt. David Gray. Royal Geographical Society, Control # 503747. Scale 503741:503746,503750,503000.
- Gray, D. 1881b. The recent advance of the Polar ice in the Greenland and Spitzbergen Sea. Proceedings of the Royal Geographiocal Society and Monthly Record of Geography 3:740–41. doi:10.2307/1800737.
- Haggblom, A. 1982. Driftwood in Svalbard as an indicator of sea ice conditions. Geografiska Annaler 64A:81–94.
- Hammer, O., D. A. T. Harper, and P. D. Ryan. 2001. PAST: Paleontological statistics software package for education and data analysis. Palaeontologia Electronica 4 (1):Unpaginated–Unpaginated.
- Helgadóttir, G. 1997. Paleoclimate (0 to> d14 ka) of W and NW Iceland: An Iceland/USA Contribution to PALE. Cruise Report B9-97, Marine Research Institute of Iceland, Reykjavik.
- Hellmann, L., W. Tegel, A. V. Kirdyanov, O. Eggerstsson, E. Esper, L. Agafonov, A. N. Nikolaev, A. A. Knorre, V. S. Myglan, O. Churakova, et al. 2015. Timber logging in Central Siberia is the main source for recent Arctic driftwood. Arctic, Antarctic, and Alpine Research 47 (3):449–60.
- Jennings, A. E., J. T. Andrews, and L. Wilson. 2015. Detrital carbonate events on the Labrador Shelf, a 13 to 7 kyr template for freshwater forcing from the Laurentide Ice Sheet. Quaternary Science Reviews 107:62–80. doi:10.1016/j.quascirev.2014.10.022.
- Jennings, A. E., S. Hagen, J. Hardardóttir, R. Stein, A. E. J. Ogilvie, and I. Jónsdóttir. 2001. Oceanographic change and terrestrial human impacts in a post 1400 AD record from the Southwest Iceland Shelf. Climatic Change 48:83–100.
- Jiang, H., M.-S. Seidenkrantz, K. L. Knudsen, and J. Eiríksson. 2001. Diatom surface sediment assemblages around Iceland and their relationships to oceanic environmental variables. Marine Micropaleontology 41:73–96. doi:10.1016/S0377-8398(00)00053-0.
- Jónsdóttir, I. 1995. Sea ice off the coasts of Iceland in the early 20th century. M.Phil. thesis, Scott Polar Research Institute, University of Cambridge.
- Jónsdóttir, I., and E. Sveinbjörnsson. 2007. Recent variations in sea-ice extent off Iceland. Jökull 57:61–70.
- Karcher, M., R. Gerdes, F. Kauker, C. Köberle, and I. Yashayaev. 2005. Arctic Ocean change heralds North Atlantic freshening. Geophysical Research Letters 32 (21):Paper L21606. doi:10.1029/2005GL023861.
- Koch, L. 1945. The east Greenland ice. Meddelelser om Grønland 130 (3):346.
- Kolla, V., P. E. Biscaye, and A. F. Hanley. 1979. Distribution of quartz in Late Quaternary sediments in relation to climate. Quaternary Research 11:261–77. doi:10.1016/0033-5894(79)90008-5.
- Kristjánsdóttir, G. B. 2005. Holocene changes in climate, environment, and ocean reservoir age on the Iceland shelf: Mg/Ca, δ18O, and tephrachronology of core MD99-2269. PhD diss., Department of Geological Sciences, University of Colorado, Boulder, 433 pp.
- Kristjánsdóttir, G. B., M. Moros, J. T. Andrews, and A. E. Jennings. 2016. Holocene Mg/Ca, alkenones, and light stable isotope measurements on the outer North Iceland shelf (MD99-2269): A comparison of proxy data. The Holocene 26:1–11.
- Lamb, H. H. 1979. Climatic variations and changes in the wind and ocean circulation: The Little Ice Age in the Northeast Atlantic. Quaternary Research 11:1–20. doi:10.1016/0033-5894(79)90067-X.
- Manley, W. F., and A. E. Jennings. 1996. Radiocarbon Date List VIII: Eastern Canadian Arctic, Labrador, Northern Quebec, East Greenland Shelf, Iceland Shelf, and Antarctica. Institute of Arctic and Alpine Research Occasional Paper No. 50. Boulder: University of Colorado, 163 pp.
- Miller, G. H., A. Geirsdóttir, Y. F. Zhong, D. J. Larsen, B. L. Otto-Bliesner, M. M. Holland, D. A. Bailey, K. A. Refsnider, S. J. Lehman, J. R. Southon, et al. 2012. Abrupt onset of the Little Ice Age triggered by volcanism and sustained by sea-ice/ocean feedbacks. Geophysical Research Letters 39:14–25.
- Moreno-Chamarro, E., D. Zanchettin, K. Lohmann, and J. H. Jungclaus. 2017. An abrupt weakening of the subpolar gyre as trigger of Little Ice Age-type episodes. Climate Dynamics 48:727–44. doi:10.1007/s00382-016-3106-7.
- Morison, J., R. Kwok, C. Peralta-Ferriz, M. Alkire, I. Rigor, R. Andersen, and M. Steele. 2012. Changing Arctic Ocean freshwater pathways. Nature 481 (7379):66–70. doi:10.1038/nature10705.
- Moros, M., J. T. Andrews, D. D. Eberl, and E. Jansen. 2006. The Holocene history of drift ice in the northern North Atlantic: Evidence for different spatial and temporal modes. Palaeoceanography 21:1 of 10. doi:10.1029/2005PA001214.
- Mysak, L. A., and S. B. Power. 1992. Sea-ice anomalies in the western Arctic and Greenland-Iceland Sea and their relation to an interdecadal climate cycle. Climatological Bulletin 26:147–76.
- Ogilvie, A. E. J. 1981. Climate and society in Iceland from the Medieval period to the late eighteenth century. Ph.D. thesis, Climate Research Unit, School of Environmental Sciences, University of East Anglia.
- Ogilvie, A. E. J. 1996. Sea-ice conditions off the coasts of Iceland A.D. 1601-1850 with special reference to part of the Maunder Minimum period (1675–1715). In North European climate data in the latter part of the Maunder Minimum period A.D. 1675-1715, ed. E. S. Pedersen, 9–12. Stavanger, Norway: Archaeological Museum of Stravanger.
- Ogilvie, A. E. J. 1997. Fisheries, climate and sea ice in Iceland: An historical perspective. In Marine resources and human societies in the North Atlantic since 1500, ed. D. Vickers, 69–87. St Johns: Institute of Social and Economic Research, Memorial University.
- Ogilvie, A. E. J., and I. Jónsdóttir. 2000. Sea ice, climate, amd Icelandic fisheries in the eighteenth and nineteenth centuries. Arctic 53:383–94. doi:10.14430/arctic869.
- Ogilvie, A. E. J., and T. Jónsson. 2001. The iceberg in the mist: Northern research in pursuit of a “Little Ice Age”, 263. Boston: Kluwer Academic Press.
- Ólafsson, J. 1999. Connections between oceanic conditions off N-Iceland, Lake Myvatn temperature, regional wind direction variability and the North Atlantic Oscillation. Rit Fiskideildar 16:41–57.
- Patterson, W. P., K. A. Dietrich, C. Holmden, and J. T. Andrews. 2010. Two millennia of North Atlantic seasonality and implications for Norse colonies. Proceedings of the National Academy of Sciences of the United States of America 107:5306–10. doi:10.1073/pnas.0902522107.
- Quillmann, U., J. T. Andrews, and A. E. Jennings, J. Bendle, H. Jónsdóttir, G. B. Kristjánsdóttir, J. Lloyd, S. Ólafsdóttir, S. Principato. 2009. Radiocarbon Date List XI: East Greenland Shelf, West Greenland Shelf, Labrador Sea, Baffin Island Shelf, Baffin Bay, Nares Strait, and Southwest to Northwest Icelandic Shelf. Institute of Arctic and Alpine Research Occasional Paper No. 59. Boulder: University of Colorado, 69 pp.
- Raven, M. D., and P. G. Self. 2017. Outcomes of 12 years of the Reynolds Cup quantitatve mineral analysis round Robin. Clays and Clay Minerals 65 (2):122–34. doi:10.1346/CCMN.2017.064054.
- Reeh, N. 2004. Holocene climate and fjord glaciations in Northeast Greenland: Implications for IRD deposition in the North Atlantic. Sedimentary Geology 165:333–42. doi:10.1016/j.sedgeo.2003.11.023.
- Reeh, N., H. H. Thomsen, A. K. Higgins, and A. Weidick. 2001. Sea ice and the stability of north and northeast Greenland floating glaciers. Annals of Glaciology 33:474–80. doi:10.3189/172756401781818554.
- Reimer, P. J., E. Bard, A. Bayliss, J. W. Beck, P. G. Blackwell, C. Bronk Ramsey, P. M. Grootes, T. P. Guilderson, H. Haflidason, I. Hajdas, et al. 2013. IntCal13 and Marine13 radiocarbon age calibration curves 0–50,000 years cal BP. Radiocarbon 55:1869–87. doi:10.2458/azu_js_rc.55.16947.
- Rogers, J. C., L. Yang, and L. Li. 2005. The role of Fram Strait winter cyclones on sea ice flux and on Spistbergen air temperatures. Geophysical Research Letters 32:1 of 4. doi:10.1029/2004GL022262.
- Schmith, T., and C. Hanssen. 2003. Fram Strait ice export during the nineteenth and twentieth centuries reconstructed from a multiyear sea ice index from Southwestern Greenland. Journal of Climate 16:2782–91. doi:10.1175/1520-0442(2003)016<2782:FSIEDT>2.0.CO;2.
- Seale, A., P. Christoffersen, R. I. Mugford, and M. O’Leary. 2011. Ocean forcing of the Greenland Ice Sheet: Calving fronts and patterns of retreat identified by automatic satellite monitoring of eastern outlet glaciers. Journal of Geophysical Research-Earth Surface 116:1 of 16. doi:10.1029/2010jf001847.
- Sejrup, H. P., S. J. Lehman, H. Haflidason, D. Noone, R. Muscheler, I. M. Berstad, and J. T. Andrews. 2010. Response of Norwegian Sea temperature to solar forcing since 1000 AD. Journal of Geophysical Research-Oceans 115. doi:10.1029/2010jc006264.
- Smith, L. M., J. T. Andrews, I. S. Casteñeda , G. B. Kristjánsdóttir, A. E. Jennings, and A. E. Sveinbjörnsdóttir. 2005. Temperature reconstructions for SW amd N Iceland waters over the last 10,000 cal yr B.P. based on δ18O records from planktic and benthic Foraminifera. Quaternary Science Reviews 24:1723–40. doi:10.1016/j.quascirev.2004.07.025.
- Smith, L. M., and K. J. Licht 2000. Radiocarbon Date List IX: Antarctica, Arctic Ocean, and the Northern North Atlantic. Institute of Arctic and Alpine Research Occasional Paper No. 54. Boulder: University of Colorado, 138 pp.
- Solignac, S., A. de Vernal, and C. Hillaire-Marcel. 2004. Holocene sea-surface conditions in the North Atlantic—Contrasted trends and regimes in the western and eastern sectors (Labrador Sea vs Iceland Basin). Quaternary Science Reviews 23:319–34. doi:10.1016/j.quascirev.2003.06.003.
- Stefansson, U. 1962. North Icelandic waters, vol. 3, 269. Rit Fiskideildar III. Bind
- Stefansson, U., and J. Ólafsson. 1991. Nutrients and fertility of Icelandic waters. Rit Fiskideildar XII:1–56.
- Stoner, J. S., A. E. Jennings, G. B. Kristjánsdóttir, J. T. Andrews, G. Dunhill, and J. Hardardóttir. 2007. A paleomagnetic approach toward refining Holocene radiocarbon based chronostratigraphies: Paleoceanographic records from North Iceland (MD99-2269) and East Greenland (MD99-2322) margins. Palaeoceanography 22:1 of 23. doi:10.1029/2006PA001285.
- Telford, R. J., E. Heegaard, and H. J. B. Birks. 2003. All age-depth models are wrong: But how badly? Quaternary Science Reviews 23:1–5. doi:10.1016/j.quascirev.2003.11.003.
- Thórdardóttir, T. 1984. Primary Production North of Iceland in relation to Water Masses in May-June 1970–1980. International Council for the Exploration of the Sea, C.M. 1984/L20:1–17.
- Thoroddsen, T. 1916–1917. Árferði á Íslandi í þúsund ár, 432. Copenhagen: Hið íslenzka fræðafjelag.
- Tremblay, L. B., L. A. Mysak, and A. S. Dyke. 1997. Evidence from driftwood records for century-to-millennial scale variations of the high latitude atmospheric circulation during the Holocene. Geophysical Research Letters 24:2027–30. doi:10.1029/97GL02028.
- Vasskog, K., P. M. Langebroek, J. T. Andrews, J. E. O. Nilsen, and A. Nesje. 2015. The Greenland Ice Sheet during the last glacial cycle: Current ice loss and contribution to sea-level rise from a palaeoclimatic perspective. Earth-Science Reviews 150:45–67.
- Vilmundarson, Þ. 1969. Heimildir um hafís á síðari öldum. In Hafísinn, ed. M. Á. Einarsson, 313–32. Reykjavík: Almenna Bókafélagið.
- Vilmundarson, Þ. 1971. Evaluation of historical sources on sea ice near Iceland. In Sea ice, ed. T. Karlsson, 159–69. Reykjavík: National Research Council.
- Vogt, C. 1997. Regional and temporal variations of mineral assemblages in Arctic Ocean sediments as climatic indicators during glacial/interglacial changes. Reports on Polar Research 251 (1):309.
- VyVerberg, K. L., J. M. Jaeger, and A. Dutton. 2018. Quantifying detection limits and uncertainty in X-Ray diffraction mineralogical assessments of biogenic carbonates. Journal of Sedimentary Research 88:1261–75.
- Wadhams, P. 2000. Ice in the oceans, 351. London: Gordon and Breach.
- Wallevik, J. E., and H. Sigurjónsson. 1998. The Koch index: Formulation, corrections and extension. Iceland Meteorological Office, Reykavik, Iceland.