
ABSTRACT
Snow occasionally falls on the highest mountains of tropical Hawaiʻi: Maunakea, Maunaloa, Haleakalā, and Hualālai. We digitized and analyzed monthly Weather Bureau records of snow in Hawaiʻi from 1893 to 1972. In the half-century 1901–1950, Maunakea had an estimated average of one month of snow cover per year. Snow was especially abundant from 1922 to 1940, but was relatively rare from 1908 to 1921. Snow cover may play a role in the formation and preservation of permafrost. MODIS satellite data are used to measure the albedo of the snow surface as a function of its age. Following winters with snow, the ground temperature at 1 m depth is lower than after a winter without significant snow cover, and hence snow cover favors permafrost conditions.
Introduction
The tallest summits of the Hawaiian Islands—Maunakea (19.82°N 155.47°W 4,207 m a.s.l.), Maunaloa (19.50°N 155.60°W 4,169 m), and Haleakala on Maui (20.71°N 156.25°W 3,055 m)—are occasionally covered with snow (Blumenstock and Price Citation1994). Hawaiʻi’s climate is characterized by only two seasons: summer (May–October) and winter (November–April). Snowfall is more common in winter, but also occurs in summer. Snow cover affects ground temperature, and therefore the stability of sporadic permafrost near the summit of Maunakea (Woodcock, Furumoto, and Woollard Citation1970). Snow is also the main source of water for Lake Waiau and Pu’upōhaku Pond (Ehlmann et al. Citation2005; Leopold, Morelli, and Schorghofer Citation2016), and for the summit area in general. And it is relevant for the local ecology, specifically the population numbers of the endemic Wēkiu Bug (Nysius wekiuicola; Ashlock and Gange Citation1983; Englund et al. Citation2002) and the survival of high-elevation plants.
A study of historical narratives from the eighteenth and nineteenth centuries suggests that snow was more abundant in Hawaiʻi around the first half of the nineteenth century (Schorghofer, Kantar, and Nogelmeier Citation2014). Zhang, Hamilton, and Wang (Citation2017) have analyzed satellite snow-cover records for the Island of Hawaii during 2000–2015, conducted simulations with a regional atmospheric model, and predict that snowfall will nearly disappear from Hawaiʻi by the end of the twenty-first century.
The purpose of this study is to compile a snow-cover record for the twentieth century, identify any unusual climate events, and evaluate how snow cover affects the ground temperature, and therefore permafrost. In the tropics, permafrost is also found on Mt. Kilimanjaro, Pico de Orizaba in Mexico, and Coropuna and Chachani in Peru (Yoshikawa Citation2013). On Maunakea, it is found at an unusually low altitude of only 4,100 m a.s.l., and hence its presence requires exceptional circumstances, motivating us to evaluate the role of snow cover.
Snow-cover statistics since 1893
Historical data sources
In the absence of instrumental records for precipitation on the summit for the nineteenth and most of the twentieth century, narratives from monthly climatological summaries were used to determine, as best as possible, the number of days with snow cover on Maunakea. Our sources are comprised of (1) the weather record for Honolulu and the Hawaiian Islands (Lyons Citation1893–1903), (2) the Monthly Weather Review (Abbe Citation1901; Lyons Citation1901–1903, Lydecker Citation1903–1904), and (3) Climatological Data Publications Citation1905–2016. In total, we compiled information from more than a hundred published volumes, with twelve issues per volume.
Two data sets overlap for the period 1901–1903 and are not fully consistent. Where inconsistent, we use the values from the weather record for Honolulu and the Hawaiian Islands.
The monthly reports of the Weather Bureau include a section that summarizes miscellaneous phenomena, such as high winds, thunderstorms, earthquakes, meteors, and snow. These allow us to record and tally the total number of snow days per year. The entries are based on visual observations. Several of the descriptions under “Miscellaneous Phenomena” use ambiguous wording, which leads to three separate estimates: minimum, high, and best estimate number of snow days per year. shows how wording was translated into numerical counts for snow values for the minimum and high estimate. The best estimate is judged individually for each entry. If the description reports that snow is “observed” on two specific dates separated by three or fewer days, then we assume that snow cover is continuous for our best estimate. For example, the November 1922 issue reports:
Snow on Mauna Kea observed from Honomu on the 7th and from Volcano Observatory on the 6th, 7th, 9th, 10th, 13th-15th, 17th, 19–21st, 24th, 25th, 27th, and 28th. Snow on Mauna Loa observed from Volcano Observatory on the 6th, 7th, 9th, 10th, 13th, and 14th.
Table 1. Translation of wording into numerical counts in days. X represents the number of days within the month.
Despite several gaps between dates given, we consider, for our best estimate, this month as having twenty-three continuous days of snow cover on Maunakea because it would be unlikely for fresh snow to fall and disappear that frequently within a short duration and the interruptions are possibly because of obstructed viewing.
Beginning in 1955, the journal becomes less comprehensive. Although the climatological data from 1955 to 1957 include weather summaries, none of these monthly reports mention the occurrence of snow. Between 1894 and 1954, there have only been four calendar years without a single day of snow: 1912, 1945, 1947, and 1948. Because the likelihood of three nearly consecutive years without snow is very low, there may be a reporting bias for 1945–1947.
In its December 1957 Climatological Data for Hawaii issue, the Weather Bureau announced that the comprehensive weather story carried in each issue of Climatological Data would be discontinued. However, some of the following monthly issues included “Special Weather Summaries.” The mention of snow is not seen until January 1967 when it is described as an outstanding weather event of the month. The years 1967–1972 are the last period with documented snowfall, but these reports are still incomplete with missing summaries for a number of months. Hence, we omit this period from our analysis, and focus on the continuous sixty-one-year period from 1883 to 1953. Tabulated values that resulted from this compilation are archived in electronic form (Martin and Schorghofer Citation2018).
In its June 1968 Climatological Data for Hawaii issue, the Weather Bureau announced: “Because the summits of Mauna Loa and Mauna Kea are still untenanted […], and Haleakala has been occupied only in recent years, the absence of a report of snow on these peaks does not necessarily indicate that snow did not occur.” From 1973 onward the climate reports by the Weather Bureau no longer include weather summaries with which to track snowfall.
Data validation
To validate our snowfall data counts, we crosschecked our results with the snowfall statistics of Price (Citation1962) for 1915–1958. Price worked at the Weather Bureau in Honolulu, so the data underlying his statistics should be the same as in the Bureau’s monthly publication. and show the number of years with snow for each month compared with our counts for the same forty-four-year period. Price (Citation1962) provides these statistics for Maunaloa and Haleakala, but not for Maunakea. The numbers represent the number of years during the forty-four-year period with snow occurrences in the respective month.
Table 2. Number of months with snow occurrences on Haleakala during the forty-four-year period from 1915 to 1958. Our raw count represents the total number of snow days, while the adjusted count excludes reports of snow that were not from a nearby station.
Table 3. Number of months with snow occurrences on Maunaloa during a forty-four-year period (1915–1958). Our raw count represents the total number of snow days, while the adjusted count adds sole reports of snow on Maunakea.
Our raw counts for Haleakala exceed those given by Price (Citation1962). We adjusted the counts by excluding observations of snow on the summit of Haleakala that did not originate from any nearby station. Only those reported by the Haleakala Ranger Station, Haleakala Ranch, and Haiku Experiment Station were included. These adjusted counts are also included in . With this approach our numbers match the statistics of Price (Citation1962), with the exception of November where reports describe snowfall in November 1917 and 1931.
For Maunaloa, our monthly frequency values are considerably below Price’s (). A way to increase the counts is to assume that if it had snowed on Maunakea, then it had snowed on Maunaloa as well. We reviewed the reports again and searched for instances where the Monthly Weather Review reported snow on Maunakea but not Maunaloa. For our adjusted count, we added these events to our first counts and the numbers became close to those of Price’s snowfall statistics.
Snow-cover history and statistics
shows the number of snow days per year on Maunakea from 1893 to 1972 gathered from our sources. The year with the largest number of cumulative days with snow cover was 1922 with 172 days (nearly half a year), followed by 1923 and 1925 with 140 and 124 days of snow, respectively. Snow was especially abundant from 1922 to 1940, but relatively rare from 1908 to 1921. On February 4, 1922, snow reached down to 8,500 feet (2,591 m a.s.l.) and that year snow was visible into July and reappeared in October.
Figure 1. Number of days with snow cover per year on Maunakea from 1893 to 1972. The solid black line represents the best estimate and the shaded region stretches from the minimum estimate to the high estimate.
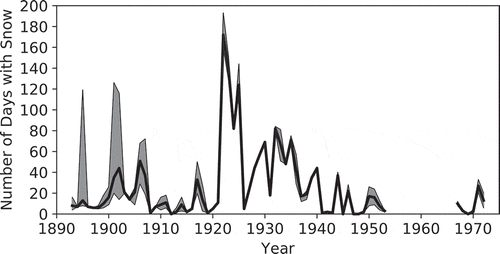
For the half-century 1901–1950, the best estimate average number of days with snow cover is thirty-one on Maunakea (minimum estimate 27 d, high estimate 39 d), twenty-four on Maunaloa, and 4.4 on Haleakala. The median number of days with snow cover—nineteen per year on Maunakea, ten on Maunaloa (unadjusted and therefore potentially underestimated), and one on Haleakala (unadjusted and therefore potentially overestimated)—is lower than the average number of days because of infrequent years with prolonged snow cover. In the first half of the twentieth century, Maunakea was without snow during only four years.
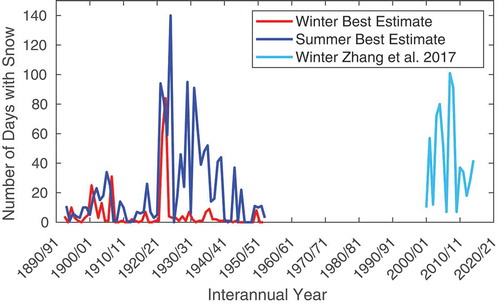
shows that snow cover (but not necessarily snowfall) is most common in the months December through March, and least common August through October. For the winter half of the year, November through April, the average from 1900/01 to 1949–1950 was twenty-five days (median 15 d) and for the summer half of the year, May through October, the average from 1901 to 1950 was five days (median 1 d), with multiple months of summer snow in both 1922 and 1923.
Table 4. Best estimate monthly average number of days with snow cover on Maunakea for the entire study period 1893–1953 and for the half century 1901–1950.
Zhang, Hamilton, and Wang (Citation2017) analyzed Moderate Resolution Imaging Spectroradiometer (MODIS) satellite data and provided the annual November through April number of days with snow cover and snow-cover area from 2000 to 2015 (fifteen winters). Their data provide days with missing data and days with complete cloud cover but deemed likely to have snow cover on Maunakea. compares our snow-cover winter and summer data from 1893 to 1853 with the satellite-based snow-cover winter data from 2000 to 2015 (Zhang, Hamilton, and Wang Citation2017). The snow-cover data for the twentieth and twenty-first centuries are based on drastically different methodologies (visual versus satellite observations), so they have to be compared with caution. The winter averages are twenty-five days and twenty days, respectively, and given the difference in methodology and the short duration of the satellite data, these averages are indistinguishable based on the fifteen-year short period of the satellite data alone.
Figure 2. Best estimate number of snow-cover days for winter (November–April) and summer (May–October) from 1893 to 1953, and the best-estimate number of snow-cover days per winter from 2000–2001 to 2014–2015.
Hualālai (2,521 m a.s.l.) is the third highest volcano on the Island of Hawaiʻi, and the fourth highest in the Hawaiian chain. Historical narratives mention snow in 1859, 1862, 1864, and 1866 (Schorghofer, Kantar, and Nogelmeier Citation2014). During the period documented in our study, snow was reported on Hualālai in February 1903, January 1911, February 1936, and February 1955.
Rainfall on the Hawaiian Islands is modulated by the Pacific Decadal Oscillation (PDO; Diaz et al. Citation2016; Frazier et al. Citation2018). We compared the snow-cover timeseries with the PDO Index, using monthly values from 1900 to 1953. Correlation between snow cover and the Mantua (http://research.jisao.washington.edu/pdo/PDO.latest.txt) or NCEI (https://www.ncdc.noaa.gov/teleconnections/pdo/) version of the PDO index is not significant at 0.07 and −0.03, respectively.
For semi-quantitative data with large variability it is difficult to reliably identify a long-term trend, and only the most obvious of trends could be considered compelling. On Maunakea, snow was relatively rare from 1908 to 1921 compared to the average for the first half of the twentieth century. Even if one argued that observation bias led to fewer reports of snow at the beginning or end of the documented interval, this period of unusually low precipitation remains. Within the accuracy of the available data, no overall trend can be established for the first half of the twentieth century or even from the beginning of the twentieth century to now. Similarly, no significant trend is found for the tabulated annual snow-cover data for Maunaloa and Haleakalā (not shown here). At approximately the first half of the nineteenth century, Maunakea was covered with snow a significant portion of the year (Schorghofer, Kantar, and Nogelmeier Citation2014), a qualitative difference to the snow-cover statistics of the twentieth and twenty-first centuries.
Relation between snow cover and ground thermal balance
Perennially frozen ground (permafrost) is found in cinder cones near the summit of Maunakea (Woodcock, Furumoto, and Woollard Citation1970; Woodcock Citation1974; Schorghofer, Leopold, and Yoshikawa Citation2017). Snow cover could have played an important role in maintaining this permafrost, because snow has a much higher albedo than barren ground so it absorbs less short-wave radiation. At tropical latitudes, where solar radiation is intense even in winter, the difference in surface albedo can be expected to have a strong impact on the ground thermal regime. Moreover, the infrared emissivity of snow is higher than for other land surfaces, leading to increased radiative cooling (Warren Citation1982). In addition, near-surface soil moisture content is enhanced under a melting snow cover and even after the snow has disappeared, resulting in energy loss (cooling) because of latent heat transfer (evaporation). Alternatively, the thermal insulation effect of snow protects the ground from low winter temperatures, so snow can also be detrimental to permafrost conditions (Zhang Citation2005). In Hawaiʻi, the seasonal temperature amplitude is small, and hence the thermal insulation effect is expected to be a lesser factor than at high latitudes.
Satellite observations
Daily global snow cover and albedo are available from MODIS with a nominal 500 m spatial resolution on the Terra satellite (Hall and Riggs Citation2016). The actual resolution over Hawaiʻi is 463 m. We have downloaded daily MODIS satellite images using wget and curl command-line utilities, and processed the hdf-formatted data with Matlab.
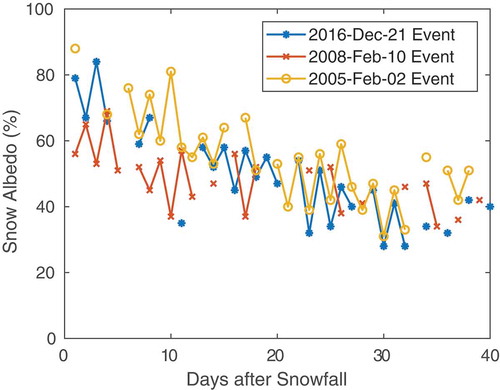
Snow albedo values are provided directly by the MODIS satellite data. We only used albedo values for pixels with a snow-cover fraction of more than 75 percent, and the maximum albedo among all the pixels may best represent the albedo of a completely snow-filled pixel. shows the albedo after three major snowfall events. The albedo of the fresh snow is roughly 80 percent, and after one month the albedo is approximately 40 percent. This behavior is similar to the albedometer measurements by Cline (Citation1997) in the Front Range of Colorado. For comparison, the Solar Radiation Atlas of Hawaiʻi (Giambelluca et al. Citation2014) provides the albedo value of Maunakea’s barren (snow-free) surface as 4 percent. Clear-sky conditions are common on Maunakea, so the albedo effect can be expected to be significant in this low-latitude environment.
Figure 3. Maximum albedo of snow cover as a function of snow age following three major snowfall events on Maunakea. The date for the first day of each time series is given in the legend.
Effect of snow cover on ground temperature
Ground-temperature sensors were installed for several years as part of a permafrost study (Schorghofer, Leopold, and Yoshikawa Citation2017). To determine the relation between snow cover and ground temperature, we use temperatures from preexisting “borehole 5” from 1 m depth, which is located near the current ice body in Puʻuwēkiu (Summit Cone Crater). In the early 1970s the top of the permafrost was about 0.4 m below the surface (Woodcock Citation1974), whereas in 2016 the top of the same ice body had retreated to approximately 1.4 m depth.
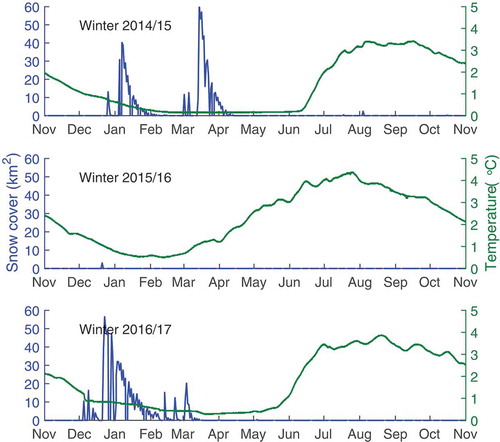
shows the total area of snow on Maunakea, as determined from MODIS satellite data. We use pixels with an areal fraction (percent of snow per pixel) of 50–100 percent and quality flag values of two or smaller for our analysis. No systematic measurements of snow depth are available, but an expansive and long-lasting snow blanket will be associated with a massive snowfall event, and therefore an initially thick snow cover. Also shown in the figure is temperature at 1 m depth during the same three-year period. Almost no snow was present in the winter of 2015–2016 and the ground temperature at 1 m depth rose months earlier than after the two winters with significant snow; the ground temperature also reached a higher maximum summer temperature. This suggests that winter snow cover causes the ground at 1 m depth to be colder even into summer, and therefore favors continuous freezing conditions at depth.
Figure 4. Snow cover and ground temperature at 1 m depth during three years. Following the winter without significant snow, the ground warmed faster and reached a higher temperature than in years with significant snow cover.
The ground temperature time series is, so far, only three years long. Interannual variability other than snow cover could contribute to the interannual variability in summer ground temperature. Air temperature data are available from a weather station near the summit, operated by the Canada-France-Hawai‘i Telescope (CFHT) and the Gemini Observatory (mkwc.ifa.hawaii.edu/archive/wx/cfht/). The air-temperature sensor is 8 m above the ground. The data, stored in 1 min intervals, were corrected for drifting time stamps and missing minutes, but the impact of these corrections was negligible. The air temperature was higher during the winter without snow cover, but this may be a direct consequence of the snow cover and does not reveal the causal relations. shows air-temperature averages for May–July, a snow-free period leading up to the annual maximum temperature at 1 m depth. Interannual variations of air temperature in this time window are not responsible for the difference in summer ground temperature, strengthening the case that the winter snow cover is the cause.
Table 5. Ground and air temperature on Maunakea after winters with and without snow cover. Snow days are based on MODIS satellite observations. Ground temperature is based on hourly in situ measurements near a permafrost body, and air temperature is based on CFHT weather tower data. The temperature of the ground was higher following the winter without significant snow, although air temperature was not.
Conclusions
Snow-cover data for the Hawaiian Islands goes back as early as 1893 and is available continuously until 1953, and sporadically thereafter. The first half of the twentieth century best-estimate statistics imply an average of thirty-one days of snow cover per year on Maunakea, most commonly from December to March. Snow was even reported in this time period on Hualālai.
On Maunakea, snow was relatively rare in 1908–1921 compared to the average for the first half of the twentieth century and also compared to modern satellite-based observations in 2000–2015. Within the accuracy of the available data, there is no century-long trend in snow cover.
Reflectance data from MODIS satellite observations confirm that the albedo of snow on Maunakea is initially high and decays only slowly over time. Hence, the albedo effect of snow on the energy balance of the ground is expected to be significant in this environment. Indeed, following winters with significant snow cover, ground temperature at 1 m depth increases later and to a lower summer maximum, which shows that snow cover has a positive effect on permafrost conditions. If snow will become less frequent on Maunakea during the twenty-first century, this will, in addition to climate warming, be detrimental to permafrost health.
Acknowledgments
We thank Jessica Kirkpatrick, Marie McKenzie, and Chunxi Zhang for insightful discussions.
Disclosure statement
No potential conflict of interest was reported by the authors.
Additional information
Funding
References
- Abbe, C. ed. 1901. Observations at Honolulu. Monthly Weather Review 29:1–3.
- Ashlock, P., and W. Gange. 1983. A remarkable new micropterous Nysius species from the aeolian zone of Mauna Kea, Hawai‘i Island (Hemiptera: Heteroptera: Lygaeidae). International Journal of Entomology 25 (1):47–55.
- Blumenstock, D. I., and S. Price. 1994. Climate of the States: Hawaii. In A natural history of the Hawaiian Islands: Selected readings II, ed. E. A. Kay, 94–114. Honolulu, HI: University of Hawaii Press.
- Climatological Data Publications. 1905-2016. NOAA national centers for environmental information. 112 volumes. https://www.ncdc.noaa.gov/IPS/cd/cd.html
- Cline, D. W. 1997. Snow surface energy exchanges and snowmelt at a continental, midlatitude Alpine site. Water Resources Research 33:689–701. doi:10.1029/97WR00026.
- Diaz, H. F., E. R. Wahl, E. Zorito, T. W. Giambelluca, and J. K. Eischeid. 2016. A five-century reconstruction of Hawaiian Islands winter rainfall. Journal of Climate 29:5661–73. doi:10.1175/JCLI-D-15-0815.1.
- Ehlmann, B. L., R. E. Arvidson, B. L. Jolliff, S. S. Johnson, B. Ebel, N. Lovenduski, J. D. Morris, J. A. Byers, N. O. Snider, and R. E. Criss. 2005. Hydrologic and isotopic modeling of Alpine Lake Waiau, Mauna Kea, Hawai‘i. Pacific Science 59:1–15. doi:10.1353/psc.2005.0005.
- Englund, R., D. Polhemus, F. Howarth, and S. Montgomery. 2002. Range, habitat, and ecology of the wekiu bug (Nysius wekiuicola), a rare insect species unique to Mauna Kea, Hawaii. Final Report. Contribution No. 2002-023 to the Hawaii Biological Survey.
- Frazier, A. G., O. Elison Timm, T. W. Giambelluca, and H. F. Diaz. 2018. The influence of ENSO, PDO and PNA on secular rainfall variations in Hawai‘i. Climate Dynamics 51:2127–40. doi:10.1007/s00382-017-4003-4.
- Giambelluca, T. W., X. Shuai, M. L. Barnes, R. J. Alliss, R. J. Longman, T. Miura, Q. Chen, A. G. Frazier, R. G. Mudd, L. Cuo, et al. 2014. Evapotranspiration of Hawai‘i. Final report submitted to the U.S. Army Corps of Engineers—Honolulu District, and the Commission on Water Resource Management, State of Hawai‘i.
- Hall, D. K., and G. A. Riggs. 2016. MODIS/Terra Snow Cover Daily L3 Global 500m Grid, Version 6. [2000.02.24-2017.12.31]. Boulder, Colorado USA. NASA National Snow and Ice Data Center Distributed Active Archive Center. doi:10.5067/MODIS/MOD10A1.006.
- Leopold, M., A. Morelli, and N. Schorghofer. 2016. Subsurface architecture of two tropical alpine desert cinder cones that hold water. Journal of Geophysical Research 121:1148–60.
- Lydecker, R. C. 1903–1904. Hawaiian climatological data. Monthly Weather Review 31(10)–32(4). 2 volumes.
- Lyons, C. J. 1893–1903. Weather record for Honolulu and the Hawaiian Islands. Vol. 11. Hawaiian Weather Bureau. http://hdl.handle.net/2027/nyp.33433012589051
- Lyons, C. J. 1901–1903. Hawaiian climatological data. Monthly Weather Review 29(5)–31(12). 3 volumes.
- Martin, J., and N. Schorghofer. 2018. Historical snow cover data for Hawaii [Data set]. Zenodo. doi:10.5281/zenodo.1496660.
- Price, S. 1962. Snowfall in Hawaii. Weatherwise 15:278. doi:10.1080/00431672.1962.9925137.
- Schorghofer, N., E. Kantar, and P. M. Nogelmeier. 2014. Snow on the summits of Hawaiʻi Island: Historical sources from 1778 to 1870. Hawaiian Journal of History 48:89–113.
- Schorghofer, N., M. Leopold, and K. Yoshikawa. 2017. State of high-altitude permafrost on tropical Maunakea volcano, Hawaii. Permafrost and Periglacial Processes 28:685–97. doi:10.1002/ppp.v28.4.
- Warren, S. G. 1982. Optical properties of snow. Reviews of Geophysics 20:67–89. doi:10.1029/RG020i001p00067.
- Woodcock, A. H. 1974. Permafrost and climatology of a Hawaii volcano crater. Arctic and Alpine Research 6:49–62. doi:10.2307/1550369.
- Woodcock, A. H., A. S. Furumoto, and G. P. Woollard. 1970. Fossil ice in Hawaii? Nature 226:873–873. doi:10.1038/226873a0.
- Yoshikawa, K. 2013. Permafrost in our time. Valencia, CA: Bang Printing.
- Zhang, C., K. Hamilton, and Y. Wang. 2017. Monitoring and projecting snow on Hawaii Island. Earth’s Future 5:436–48. doi:10.1002/eft2.2017.5.issue-5.
- Zhang, T. 2005. Influence of the seasonal snow cover on the ground thermal regime: An overview. Reviews of Geophysics 43 (RG4002):23. doi:10.1029/2004RG000157.