
 ?Mathematical formulae have been encoded as MathML and are displayed in this HTML version using MathJax in order to improve their display. Uncheck the box to turn MathJax off. This feature requires Javascript. Click on a formula to zoom.
ABSTRACT
We conducted a 2 m snow pit study in July 2017 at the East GRIP (Greenland Ice-Core Project; northeastern Greenland) deep ice-coring site. We collected snow samples at intervals of 0.05 m and analyzed their iron (Fe) and rare earth element (REE) concentrations. Pronounced seasonal variations in trace elements were observed during 2012–2017. The results indicated that the dissolved Fe (DFe), total dissolved Fe (TDFe), and total dissolved REEs (TDREEs) largely originated from mineral dust, which peaked in winter to early spring. In particular, the 2014–2015 Holuhraun eruption (31 August 2014 to 27 February 2015) can be clearly observed in the data at a depth of 90–125 cm. This event not only provided abundant acidic material (sulphate), but also released a large amount of DFe. Therefore, these results provide a possible way to use Greenland deep ice core data to construct a much longer history and better understand the relationship between eruptions and the release of iron in future studies.
Introduction
Ice cores from the Greenland and Antarctic ice sheets provide valuable information about the large-scale climate and environmental processes of the late Quaternary (Mayewski and Bender Citation1995; EPICA Community Members Citation2004; North GRIP (Greenland Ice-Core Project) Members Citation2004). Atmospheric phosphorus has been recorded in Greenland ice cores (Kjær et al. Citation2013; Astrid et al. Citation2015). In addition, detailed process information, such as past iron fluxes to the ocean and changes in dust iron solubility, is recorded in Antarctic ice cores (Vallelonga et al. Citation2013; Spolaor et al. Citation2013). The North GRIP ice core was dated back to the middle of the Last Interglacial, which is known as the Eemian period (North GRIP Members Citation2004). Because the Eemian (130–115 ka) was substantially warmer than today, having the full record of the Eemian would enable us to study the detailed climatic and environmental changes that occur in a warmer climate (i.e., interglacial and Holocene periods), which are helpful for predicting future global changes (NEEM Community Members Citation2013).
Aeolian dust transport, which increases during glacial cold periods, is expected to enhance the supply of nutrient elements to the biosphere (Ram, Stolz, and Koenig Citation1997; Svensson, Biscaye, and Grousset Citation2000; Ruth et al. Citation2007). Trace nutrient Fe limits phytoplankton growth in approximately 30%–40% of the world’s oceans (high-nitrate low-chlorophyll (HNLC) regions) (Mark et al. Citation2009; Boyd and Ellwood Citation2010). Volcanic ash and subsequent aerosol deposition to the surface ocean provide a source of Fe (Langmann et al. Citation2010; Ayris and Delmelle Citation2012; Bau, Tepe, and Mohwinkel Citation2013). Increased productivity in both the modern and ancient oceans has been linked to volcanism; however, direct observations of ash deposition and biogeochemical responses are scarce due to the intermittent and unpredictable nature of these events (Cather Citation2009; Langmann et al. Citation2010). Nevertheless, the observed decreases in atmospheric CO2 following the large eruptions of Agung (1963) and Pinatubo (1991) have been interpreted in terms of the fertilizing effects of ash-derived Fe on ocean productivity (Sarmiento Citation1993; Watson Citation1997).
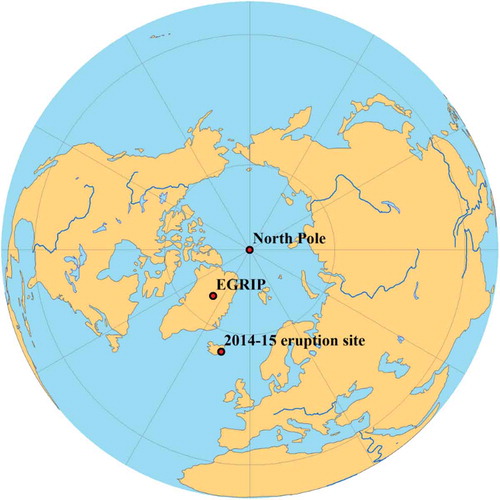
The 2014–2015 eruption of Holuhraun in Iceland commenced on 29 August 2014 and lasted for approximately 4 h, producing less than 1 million m3 of lava, before the onset of the main basaltic effusive eruption on 31 August 2014, which lasted six months and ended on 28 February 2015. Long-range periodic impacts on air quality were reported in the UK, Ireland, Finland, the Netherlands, and Austria (Gíslason et al. Citation2015; Schmidt et al. Citation2015; Twigg et al. Citation2016). In addition, dating these eruption events is important for the accurate absolute dating of the ice core. However, few studies have focused on the Fe records associated with eruption events in snow and ice. The ongoing East GRIP project provides the opportunity to collect snow samples to study the relationship between Fe and the eruption record. The snow pit site is located at the site of the new East GRIP project (75°37′N, 35°59′W, 2702 m asl) in northeastern Greenland (). To fully interpret the chemical data obtained from the East GRIP deep ice core, it is necessary to assess the seasonal variations in the chemical components of the present-day snow. In this article, we present the results of a snow pit study conducted at the East GRIP site in July 2017 to investigate the relationship between the Holuhraun eruption and Fe and rare earth elements (REEs) deposited in the snow.
Figure 1. Snow pit sites at the East GRIP (EGRIP) camp in Greenland and the 2014–2015 eruption site in Iceland.
Methodology
Snow pit sample collection and chemical analysis
A 2.0 m snow pit was excavated at the East GRIP site in June 2017, northeastern Greenland (). The reconstruction of the annual layer thickness from the 67 m shallow ice core at the East GRIP site indicated that the accumulation rate is 0.11 m/yr (ice equivalent) (Vallelonga et al. Citation2014). The snow samples were frozen and transported to the State Key Laboratory of Cryospheric Science (SKLCS), Lanzhou, China, in July 2017. A total of forty samples with a 5 cm resolution (representing approximately two months) were analyzed for their contents of dissolved Fe (DFe) and total dissolved Fe (TDFe), including total dissolved S (TDS) and total dissolved rare earth elements (TDREEs). The dissolved Fe, including both the dissolved phase and colloidal fraction, <0.2 or 0.45 μm in seawater, has been widely used to gauge the biological availability of Fe to algae (Shiller Citation2003). In this study, DFe, the operationally defined measurements of filtrates that passed through 0.45 µm filters, mainly represent the dissolved phase. The TDFe and TDREEs (following acidification to 1% using Optima double-distilled HNO3, Thermo Fisher Optima) were acidified for at least six weeks (approximately two months). The TDFe was defined as the fraction of iron in solution after more than three months in storage at a pH 1.9 as “‘total-dissolvable iron’” (Ross and Sedwick 2001). Samples for trace element analysis were directly collected in acid-cleaned (10% trace metal-grade HNO3) 500 ml Nalgene bottles (LDPE). The concentrations of Fe and 14 REEs were determined via inductively coupled plasma sector field mass spectrometry (ICP-SFMS) using an Element 2 instrument from Thermo Fisher at the Climate Change Institute, University of Maine (Du et al. Citation2019a). This instrument was equipped with a Cetac Model ASX-260 autosampler. Interferences were minimized via the implementation of an ESI Apex desolvating sample introduction system and a PFA-ST nebulizer with a sample uptake of 100 μl/min (Du et al. Citation2019b). The instrument was used in low-resolution mode to measure REEs. The detection limits were calculated as three times the standard deviation of the response of the instrument to a solution of ultra-pure water spiked with 1% HNO3. The blanks (deionized water blanks) and instrument detection limits (DLs) of the REEs are listed in Osterberg et al. (Citation2006). The process blanks of DFe, TDFe, and TDS in this study were 0.0286 ± 0.028 ng/g, 0.0488 ± 0.039 ng/g, and 0.1067 ± 0.094639 ng/g, respectively. These values were significantly below their respective minima in the snow samples. The process blanks of La, Ce, Pr, Nd, Sm, Eu, Gd, Tb, Ho, Dy, Er, Tm, Yb, and Lu were 0.00236 ± 0.00097 pg/g, 0.00458 ± 0.00373 pg/g, 0.00058 ± 0.00016 pg/g, 0.00242 ± 0.00107 pg/g, 0.00156 ± 0.00022 pg/g, 0.00334 ± 0.00116 pg/g, 0.00486 ± 0.00298 pg/g, 0.00151 ± 0.00203 pg/g, 0.00085 ± 0.00047 pg/g, 0.00040 ± 0.00041 pg/g, 0.000403 ± 0.00041 pg/g, 0.00052 ± 0.00044 pg/g, 0.00049 ± 0.00040 pg/g, and 0.00062 ± 0.00022 pg/g, respectively. Most of the values were below the minima in the snow samples except Tb, Tm, and Lu. The detailed measurement method can be found in a previous study (Osterberg et al. Citation2006). The δ18O and δD values were measured on a Picarro L1102-i cavity ring-down spectrometer (CRDS) using a high-throughput Picarro-A0212 vaporizer. Micro-particle concentrations were measured in the snow samples using an Accusizer 780A counter by Du et al. (Citation2019c).
Results and discussion
Seasonal variations in the Fe concentrations in the East GRIP snow pit
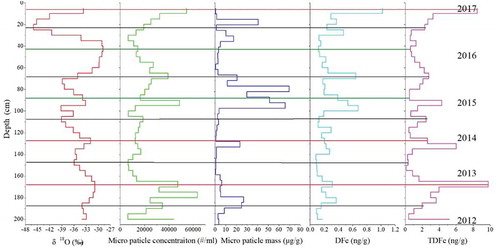
shows the vertical profiles of the stable water isotopes (δ18O and δD) and deuterium excess (D-excess) of the samples from the East GRIP snow pit (Du et al. Citation2019c). Seasonal variations in the δ18O and δD were clearly observed in the depth profile, which indicated that the 2.0 m pit included snow depositions corresponding to five δ18O and δD maxima and minima from 2012 to 2017 (Du et al. Citation2019c). The δ18O and δD values reached their minima during winter. The δ18O values varied between −45.00% and −28.84% and had a mean of −34.76%. shows a comparison of the δ18O values as well as the dust, DFe, and TDFe concentrations in a continuous profile. The DFe variations present a similar trend to the dust variations, thus highlighting a clear seasonality in the deposition of dust (Fe). The DFe concentrations varied from 0.079 to 1.020 ng g−1 (average 0.252 ng g−1), and the TDFe concentrations varied from 0.148 to 9.791 ng g−1 (average 2.173 ng g−1). The dust micro-particle concentrations in the East GRIP snow pit have a positive correlation with the TDFe concentrations (R2 = 0.52, P = .01) and no significant correlation with the DFe (R2 = 0.23, P = .01) concentrations. This relationship indicates that the TDFe concentrations are linked to the dust source (local or long-distance transport from potential dust sources). In contrast, DFe has other volcanic or anthropogenic sources. Additionally, three abnormal peaks occurred in 2013, 2014, and 2017 from spring to summer, up to a maximum in summer, with high δ18O values (, red lines), indicating that there is a local dust source from the ice-free area around the East Greenland ice sheet.
Figure 2. Vertical profiles of stable water isotopes and D-excess. Black and red lines represent winter and summer layers, respectively; the data were obtained from Du et al. (Citation2019c).
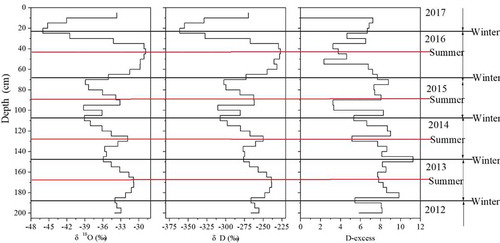
Figure 3. Vertical profiles of δ18O, micro-particle, mass, dissolved Fe, and total dissolved Fe concentrations (black and red lines represent winter and summer layers, respectively). The δ18O, micro-particle, and mass data were obtained from Du et al. (Citation2019c).
Seasonal variations in the rare earth element concentrations in the East GRIP snow pit
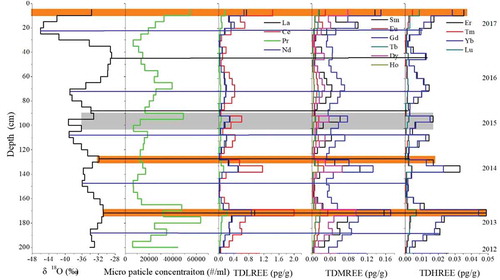
REEs are present as particles during atmospheric transport. Therefore, the contents of REEs in atmospheric particulate matter can reflect the characteristics of the original site of provenance (Wegner et al. Citation2012). REE concentrations in snow/ice from polar ice cores have been used to trace dust sources in previous studies (Abbott et al. Citation2012; Gabrielli et al. Citation2010; Wegner et al. Citation2012). We present a continuous record of the REE concentrations measured in the East GRIP snow pit to trace the provenance based on REE patterns, focusing on determining if they originated from the 2014–2015 Holuhraun eruption. Based on their concentration differences, the fourteen REEs were divided into three groups based on atomic weight (light REEs: La, Ce, Pr, and Nd; medium REEs: Sm, Eu, Gd, Tb, Dy, and Ho; and heavy REEs: Er, Tm, Yb, and Lu). shows that the patterns of light REEs (La, Ce, Pr, and Nd) and medium REEs (Sm, Eu, Gd, Tb, Dy, and Ho) are significantly similar. Because the concentration of heavy REEs, including Er, Tm, Yb, and Lu, was very low, the concentration patterns of heavy REEs as a function of snow depth differed slightly from the light and medium REE patterns. Correlations were calculated between the dust micro-particle and ΣREE concentrations to understand the relationship between them (light REEs: R2 = 0.479, P = .01; medium REEs: R2 = 0.96, P = .01; and heavy REEs: R2 = 0.507, P = .01). As shown in the REE distribution patterns in , the REE concentrations exhibited significant seasonal variations in accordance with the dust micro-particle level (orange areas). Meanwhile, the dust micro-particle concentrations were positively correlated with fourteen REE concentrations as a function of depth, with the peak occurring at 90–125 cm because of the signal of the Holuhraun eruption during 2014 (grey area). The peak in REEs at approximately 90–125 cm also corresponded to the DFe (TDFe) peak (). Moreover, the peaks in REEs and DFe (TDFe) may have been related to seasonal dust cycles. Therefore, these results suggest that REEs are a good proxy for distinguishing dust characteristics from different sources. More importantly, the 2014–2015 Holuhraun eruption not only released copious amounts of REEs, but also provided enriched DFe (TDFe) concentrations, which deposited onto the Greenland ice sheet.
Figure 4. The δ18O and micro particle concentrations (Du et al. Citation2019c). as well as total dissolved REEs (total dissolved light REE: TDLREE, total dissolved medium REE: TDMREE, total dissolved heavy REE: TDHREE), in the East GRIP snow pit (black and blue lines represent winter and summer layers, respectively).
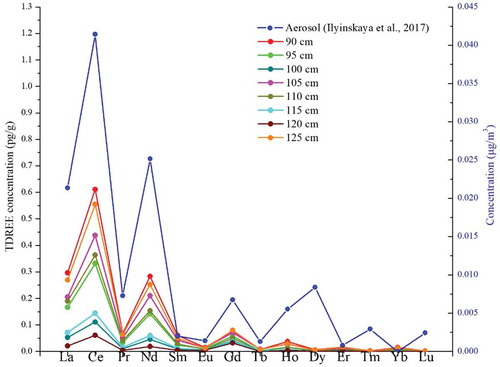
To further demonstrate that ash aerosols from the 2014–2015 Holuhraun eruption event were recorded at the East GRIP snow pit, we compared our results with aerosol particulate matter samples from the 2014–2015 Holuhraun plume, which were collected in the field (Iceland) by Ilyinskaya et al. (Citation2017) during 21– 22 January 2015 (). The detailed aerosol sample collection and measurement methods can be found in their study (Ilyinskaya et al. Citation2017). The average REE pattern of the aerosols exhibited similar variations with those of the snow samples corresponding to the 2014–2015 Holuhraun eruption. For example, the ∑REE values in the aerosol and snow samples corresponding to the 2014–2015 Holuhraun eruption had a good relationship (R2 = 0.74–0.95, P = .01). In particular, the light REEs (La, Ce, Pr, and Nd) in the East GRIP snow pit samples had similar trends with the aerosol samples because the abundance of light REEs is much higher in minerals from the continental crust (Wedepohl Citation1995). Therefore, this result demonstrates that ash aerosols from the 2014–2015 Holuhraun plume may be transported to the East Greenland ice sheet.
Figure 5. The concentrations of the TDREEs between the East GRIP snow pit (left) and the aerosol samples (Ilyinskaya et al. Citation2017, right) during the Holuhraun eruption.
The relationship between the 2014–2015 Holuhraun eruption and the iron record
The 2014–2015 Holuhraun eruption in the central highlands of Iceland emitted ∼8 Tg of SO2 into the troposphere over six months (Gauthier et al. Citation2016). Over the next six months, a lava field with a volume of 1.2 km3 and an area of 86 km2 was produced before the eruption ended on 27 February 2015 (Bonny et al. Citation2018; Schmidt et al. Citation2015). The SO2 emissions caused a frequent and persistent deterioration of the air quality in Iceland with regard to SO2 and impacted the chemistry of snow and rain precipitation around Iceland (Gíslason et al. Citation2015; Galeczka et al. Citation2016; Stefánsson et al. Citation2017). However, the SO2 volume released into the atmosphere from the 2014–2015 event was lower than that of the Laki eruption in 1783–1784 (Thordarson et al. Citation2003). For example, the concentration was 1159 ng/g in the ice corresponding to 1783–1784 in the Greenland NEEM ice core (Zheng Citation2015), while the
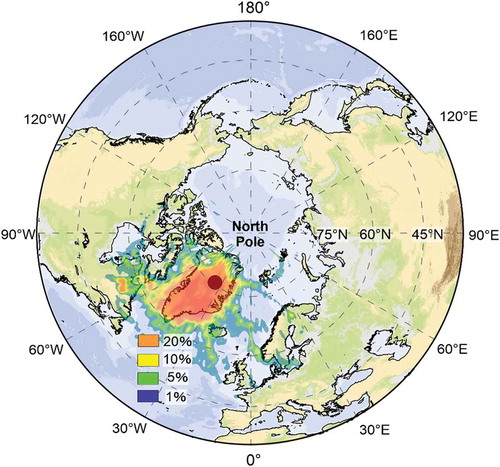
concentration was 354 ng/g in the East GRIP snow pit corresponding to the 2014–2015 Holuhraun eruption. To obtain information on long-distance volcanic ash of this eruption event, the HYSPLIT model was used (https://ready.arl.noaa.gov/gdas1.php). The five-day backward trajectories were initialized every 6 h. The back-trajectory analysis for air mass paths was set at a low level (500 m above ground level). The results show that approximately 5%–10% of the air mass was from Iceland. That is, the Holuhraun eruption signal was transported to the location of the East GRIP snow pit ().
Figure 6. Five-day backward trajectories of air masses arriving at the East GRIP site during the 2014–2015 eruption period (31 August 2014 to 27 February 2015).
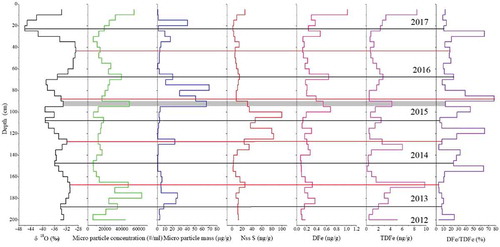
The non-sea salt (nss) S concentrations from 90–125 cm were three times greater than those before the 2014–2015 Holuhraun eruption, which is a clear signal that the Holuhraun eruption was recorded in this snow pit. However, the peaks in TDFe at 135–125 cm and 95–90 cm did not correspond to the elevated nss S concentrations, which may be due to seasonal variations rather than volcanic signals. Moreover, a lag (approximately 5–10 cm) was identified between the peaks in DFe and nss S during the 2014–2015 Holuhraun eruption. However, there was a close relationship between the TDFe and dust micro-particle concentrations. Therefore, this result indicates that, except for the 2014–2015 Holuhraun eruption, the seasonal variations in mineral dust from atmospheric dry and wet depositions may be from another Fe source. There is an interesting phenomenon in which the peaks of the micro-particle mass during the 2014–2015 Holuhraun eruption lag behind those of the dust micro-particles, indicating that the gas (SO2) and mineral dust particle deposition rates of this eruption differed from those of atmospheric transport. shows a high DFe concentration during the 2014–2015 Holuhraun eruption (grey bars); the maximum DFe concentration during this event was 7–8 times greater than that before the Holuhraun eruption, although it did not correspond to elevated nss S concentrations. Thus, the DFe concentration lagged behind the nss S variation. A previous study indicated that acids formed from anthropogenic pollutants (including acidic sulphate coatings) and aerosol interactions enhanced the supply of bioavailable Fe in ocean ecosystems (Li et al. Citation2017). Therefore, this phenomenon can be explained because SO2 is more readily deposited onto snow than ash particles. Moreover, as SO2 was converted to H2SO4, ash particles from the 2014–2015 Holuhraun eruption mixed with H2SO4. Finally, the lag in the DFe peak may have occurred due to this process. In particular, the differences in the magnitudes of nss S and DFe imply that different eruption types and atmospheric conditions are important factors that control the amount of DFe in snow.
Figure 7. Vertical profiles of δ18O, micro-particle concentration, micro-particle mass, total dissolved non-sea salt S (Nss S), dissolved Fe (DFe), and total dissolved Fe (TDFe) concentrations and Fe fraction solubility (DFe/TDFe) (black and red lines represent winter and summer layers, respectively).
The magnitude of the fractional solubility of aerosol iron is important for global Fe biogeochemical models, and it can be calculated using the same equation used by Winton et al. (Citation2016): fractional Fe solubility = DFe/TDFe×100%, where DFe is the dissolved Fe fraction, and TDFe is the TDFe fraction. The fractional Fe solubility in the East GRIP snow pit ranged from 3.2% to 77.7%, with an average of 20.5%. The fractional Fe solubility was significantly higher during the 2014–2015 Holuhraun eruption than before the eruption. The maximum Fe solubility (77.7%) during the 2014–2015 Holuhraun eruption was twenty times greater than that before the eruption (). The average high DFe/TDFe values corresponded to high DFe concentrations during the eruption. These results indicate that this eruption provided considerable DFe, further demonstrating that eruption events may affect Fe solubility because the SO2 emissions may result in an acidic environment. A recent study demonstrated that continuous observations of Fe2+ species in Greenland ice cores exhibit well-defined Fe2+ peaks concurrent with volcanic sulphate peaks (Burgay et al. Citation2019). Therefore, it is important to assess Fe sources from eruptions at regional vs global scales.
Conclusions
High-resolution sampling at 0.05 m intervals enabled the identification of detailed seasonal chemical characteristics in surface snow pit samples in July 2017 at the East GRIP site. Distinct seasonal variations in the dissolved Fe (DFe) and total dissolved Fe (TDFe) were observed; the DFe concentrations varied from 0.079 to 1.020 ng g−1 (average 0.252 ng g−1), and the TDFe concentrations varied from 0.148 to 9.791 ng g−1. The concentrations of Fe and rare earth elements (REEs) peaked in late winter to early spring and were of Aeolian dust origin. The peaks in S from 90 to 125 cm in the 2.0-m-deep East GRIP snow pit corresponded to the Holuhraun eruption (31 August 2014 to 27 February 2015). The peaks in the dust concentration lagged behind those in the S concentration, showing that the acidic gases (SO2) and mixed aerosols produced different depositional patterns and DFe variations in the samples. The 2014–2015 Holuhraun eruption resulted in significant increases in the DFe and TDFe concentrations, demonstrating that eruptions can produce large amounts of bio-available Fe. This information will provide a basis with which to interpret the relationship between eruptions and the Fe depositional history in future East GRIP deep ice cores.
Disclosure statement
No potential conflict of interest was reported by the authors.
Additional information
Funding
References
- Abbott, P. M., S. M. Davies, J. P. Steffensen, N. J. G. Pearce, M. Bigler, S. J. Johnsen, I. K. Seierstad, A. Svensson, and S. Wastegård. 2012. A detailed framework of Marine Isotope Stages 4 and 5 volcanic events recorded in two Greenland ice-cores. Quaternary Science Reviews 36:59–77. doi:10.1016/j.quascirev.2011.05.001.
- Astrid K. H., Dallmayr, R., Gabrieli, J., Goto‐Azuma, K., Hirabayashi, M., Svensson, A. and Vallelonga, P. 2015. Greenland ice cores constrain glacial atmospheric fluxes of phosphorus. Journal of Geophysical Research: Atmospheres 120 (20):10,810–10,822. doi:10.1002/2015JD023559.
- Ayris, P., and P. Delmelle. 2012. Volcanic and atmospheric controls on ash iron solubility: A review. Physics and Chemistry of the Earth, Parts A/B/C 45-46:103–12. doi:10.1016/j.pce.2011.04.013.
- Bau, M., N. Tepe, and D. Mohwinkel. 2013. Siderophore-promoted transfer of rare earth elements and iron from volcanic ash into glacial meltwater, river and ocean water. Earth and Planetary Science Letters 364:30–36. doi:10.1016/j.epsl.2013.01.002.
- Bonny, E., T. Thordarson, R. Wright, A. Höskuldsson, and I. Jónsdóttir. 2018. The volume of lava erupted during the 2014 to 2015 eruption at Holuhraun, Iceland: A comparison between satellite‐and ground‐based measurements. Journal of Geophysical Research: Solid Earth. doi:10.1029/2017JB015008.
- Boyd, P. W., and M. J. Ellwood. 2010. The biogeochemical cycle of iron in the ocean. Nature Geoscience 3 (10):675–82. doi:10.1038/ngeo964.
- Burgay, F., T. Erhardt, D. Della Lunga, C. M. Jensen, A. Spolaor, P. Vallelonga, and C. Barbante. 2019. Fe2+ in ice cores as a new potential proxy to detect past volcanic eruptions. Science of the Total Environment 654:1110–17. doi:10.1016/j.scitotenv.2018.11.075.
- Cather, S. M. D. N. 2009. Climate forcing by iron fertilization from repeated ignimbrite eruptions: The icehouse–silicic large igneous province (SLIP) hypothesis. Geosphere 5 (3):315–24. doi:10.1130/GES00188.1.
- Du, Z., C. Xiao, M. J. Handley, P. A. Mayewski, C. Li, S. Liu, X. Ma, and J. Yang. 2019a. Fe variation characteristics and sources in snow samples along a traverse from Zhongshan Station to Dome A, East Antarctica. Science of the Total Environment 675:380–89. doi:10.1016/j.scitotenv.2019.04.139.
- Du, Z., C. Xiao, Q. Zhang, C. Li, F. Wang, K. Liu, and X. Ma. 2019c. Climatic and environmental signals recorded in the EGRIP snowpit, Greenland. Environmental Earth Sciences 78 (5):170. doi:10.1007/s12665-019-8177-4.
- Du, Z., C. Xiao, W. Zhang, M. J. Handley, P. A. Mayewski, Y. Liu, and X. Li. 2019b. Iron record associated with sandstorms in a central Asian shallow ice core spanning 1956–2004. Atmospheric Environment 203:121–30. doi:10.1016/j.atmosenv.2019.01.033.
- Edwards, R., and P. Sedwick. 2001. Iron in East Antarctic snow: Implications for atmospheric iron deposition and algal production in Antarctic waters. Geophysical Research Letters 28 (20):3907–10. doi:10.1029/2001GL012867.
- EPICA CM. 2004. Eight glacial cycles from an Antarctic ice core. Nature 429: 623–28. doi:10.1038/nature02599.
- Gabrielli, P., A. Wegner, J. R. Petit, B. Delmonte, P. De Deckker, V. Gaspari, H. Fischer, U. Ruth, M. Kriews, C. Boutron, et al. 2010. A major glacial-interglacial change in aeolian dust composition inferred from rare earth elements in Antarctic ice. Quaternary Science Reviews 29 (1–2):265–73. doi:10.1016/j.quascirev.2009.09.002.
- Galeczka, I., G. Sigurdsson, E. S. Eiriksdottir, E. H. Oelkers, and S. R. Gislason. 2016. The chemical composition of rivers and snow affected by the 2014/2015 Bárðarbunga eruption, Iceland. Journal of Volcanology and Geothermal Research 316:101–19. doi:10.1016/j.jvolgeores.2016.02.017.
- Gauthier, P. J., O. Sigmarsson, M. Gouhier, B. Haddada, and S. Moune. 2016. Elevated gas flux and trace metal degassing from the 2014-2015 fissure eruption at the Bárðarbunga volcanic system, Iceland. Journal of Geophysical Research Solid Earth 121:1610–30. doi:10.1002/2015JB012111.
- Gíslason, S. R., G. Stefánsdóttir, M. A. Pfeffer, S. Barsotti, T. Jóhannsson, I. Galeczka, E. Bali, O. Sigmarsson, A. Stefánsson, N. S. Keller, et al. 2015. Environmental pressure from the 2014–15 eruption of Bárðarbunga volcano, Iceland. Geochemical Perspectives Letters 1:84–93. doi:10.7185/geochemlet.1509.
- Ilyinskaya, E., A. Schmidt, T. A. Mather, F. D. Pope, C. Witham, P. Baxter, T. Jóhannsson, M. Pfeffer, S. Barsotti, A. Singh, et al. 2017. Understanding the environmental impacts of large fissure eruptions: Aerosol and gas emissions from the 2014–2015 Holuhraun eruption (Iceland). Earth and Planetary Science Letters 472:309–22. doi:10.1016/j.epsl.2017.05.025.
- Kjær, H. A., P. Vallelonga, A. Svensson, M. E. L. Kristensen, C. Tibuleac, and M. Bigler. 2013. Continuous flow analysis method for determination of dissolved reactive phosphorus in ice cores. Environmental Science & Technology 47 (21):12325–32. doi:10.1021/es402274z.
- Langmann, B., K. Zakšek, M. Hort, and S. Duggen. 2010. Volcanic ash as fertiliser for the surface ocean. Atmospheric Chemistry and Physics 10 (8):3891–99. doi:10.5194/acp-10-3891-2010.
- Li, W., L. Xu, X. Liu, J. Zhang, Y. Lin, X. Yao, H. Gao, D. Zhang, J. Chen, W. Wang, et al. 2017. Air pollution–Aerosol interactions produce more bioavailable iron for ocean ecosystems. Science Advances 3 (3):e1601749. doi:10.1126/sciadv.1601749.
- Mark M. C., M. M. Mills, E. P. Achterberg, R. J. Geider, J. LaRoche, M. I. Lucas, E. L. McDonagh. 2009. Large-scale distribution of Atlantic nitrogen fixation controlled by iron availability. Nature Geoscience 2(867). doi:10.1038/ngeo667.
- Mayewski, P. A., and M. Bender. 1995. The GISP2 ice core record—Paleoclimate highlights. Reviews of Geophysics 33 (S2):1287–96. doi:10.1029/95RG00498.
- NEEM Community Members. 2013. Eemian interglacial reconstructed from a Greenland folded ice core. Nature 493 (7433):489–94.
- North GRIP. 2004. High-resolution record of Northern Hemisphere climate extending into the last interglacial period. Nature 431 (147). doi:10.1038/nature02805et.
- Osterberg, E. C., M. J. Handley, S. B. Sneed, P. A. Mayewski, and K. J. Kreutz. 2006. Continuous ice core melter system with discrete sampling for major ion, trace element, and stable isotope analyses. Environmental Science & Technology 40 (10):3355–61. doi:10.1021/es052536w.
- Ram, M., M. Stolz, and G. Koenig. 1997. Eleven year cycle of dust concentration variability observed in the dust profile of the GISP2 Ice core from central Greenland: Possible solar cycle connection. Geophysical Research Letters 24 (19):2359–62. doi:10.1029/97GL02521.
- Ruth, U., M. Bigler, R. Röthlisberger, M.-L. Siggaard-Andersen, S. Kipfstuhl, K. Goto-Azuma, M. E. Hansson, S. J. Johnsen, H. Lu, and J. P. Steffensen. 2007. Ice core evidence for a very tight link between North Atlantic and east Asian glacial climate. Geophysical Research Letters 34 (3). doi: 10.1029/2006GL027876.
- Sarmiento, J. L. 1993. Atmospheric CO2 stalled. Nature 365 (6448):697–98. doi:10.1038/365697a0.
- Schmidt, A., S. Leadbetter, N. Theys, E. Carboni, C. S. Witham, J. A. Stevenson, C. E. Birch. 2015. Satellite detection, long-range transport, and air quality impacts of volcanic sulfur dioxide from the 2014–2015 flood lava eruption at Bárðarbunga (Iceland). Journal of Geophysical Research: Atmospheres 120 (18):9739–57. doi:10.1002/2015JD023638.
- Shiller, A. M. 2003. Syringe filtration methods for examining dissolved and colloidal trace element distributions in remote field locations. Environmental Science & Technology 37:3953. doi:10.1021/es0341182.
- Spolaor, A., P. Vallelonga, G. Cozzi, J. Gabrieli, C. Varin, N. Kehrwald, P. Zennaro, C. Boutron, and C. Barbante. 2013. Iron speciation in aerosol dust influences iron bio-availability over glacial‐interglacial timescales. Geophysical Research Letters 40 (8):1618–23. doi:10.1002/grl.50296.
- Stefánsson, A., D. R. Hilton, Á. E. Sveinbjörnsdóttir, P. Torssander, J. Heinemeier, J. D. Barnes, S. Ono, S. A. Halldórsson, J. Fiebig, and S. Arnórsson. 2017. Isotope systematics of Icelandic thermal fluids. Journal of Volcanology and Geothermal Research 337:146–64. doi:10.1016/j.jvolgeores.2017.02.006.
- Svensson, A., P. E. Biscaye, and F. E. Grousset. 2000. Characterization of late glacial continental dust in the Greenland Ice Core Project ice core. Journal of Geophysical Research: Atmospheres 105 (D4):4637–56. doi:10.1029/1999JD901093.
- Thordarson, T., S. Self, D. J. Miller, G. Larsen, and E. G. Vilmundardóttir. 2003. Sulphur release from flood lava eruptions in the Veidivötn, Grímsvötn and Katla volcanic systems, Iceland. In Volcanic Degassing, ed. C. Oppenheimer, D. M. Pyle, and J. Barclay, 213:103–21. London: Geological Society of London Special Publications.
- Twigg, M. M., E. Ilyinskaya, S. Beccaceci, D. C. Green, M. R. Jones, B. Langford, S. R. Leeson, J. J. N. Lingard, G. M. Pereira, H. Carter, et al. 2016. Impacts of the 2014–2015 Holuhraun eruption on the UK atmosphere. Atmospheric Chemistry & Physics 16 (17):11415–31. doi:10.5194/acp-16-11415-2016.
- Vallelonga, P., C. Barbante, G. Cozzi, J. Gabrieli, S. Schüpbach, A. Spolaor, and C. Turetta. 2013. Iron fluxes to Talos Dome, Antarctica, over the past 200 kyr. Climate of the Past 9 (2):597–604. doi:10.5194/cp-9-597-2013.
- Vallelonga, P., K. Christianson, R. B. Alley, S. Anandakrishnan, J. E. M. Christian, D. Dahl-Jensen, V. Gkinis, C. Holme, R. W. Jacobel, N. B. Karlsson, et al. 2014. Initial results from geophysical surveys and shallow coring of the Northeast Greenland Ice Stream (NEGIS). The Cryosphere 8 (4):1275–87. doi:10.5194/tc-8-1275-2014.
- Watson, A. J. 1997. Volcanic iron, CO2, ocean productivity and climate. Nature 385 (6617):587–88. doi:10.1038/385587b0.
- Wedepohl, K. H. 1995. The composition of the continental crust. Geochimica et Cosmochimica Acta 59 (7):1217–32. doi:10.1016/0016-7037(95)00038-2.
- Wegner, A., P. Gabrielli, D. Wilhelms-Dick, U. Ruth, M. Kriews, P. De Deckker, C. Barbante, G. Cozzi, B. Delmonte, and H. Fischer. 2012. Change in dust variability in the Atlantic sector of Antarctica at the end of the last deglaciation. Climate of the Past 8 (1):135–47. doi:10.5194/cp-8-135-2012.
- Winton, V., R. Edwards, B. Delmonte, A. Ellis, P. S. Andersson, A. Bowie, N. A. N. Bertler, P. Neff, and A. Tuohy. 2016. Multiple sources of soluble atmospheric iron to Antarctic waters. Global Biogeochemical Cycles 30 (3):421–37. doi:10.1002/2015GB005265.
- Zheng, J. 2015. Archives of total mercury reconstructed with ice and snow from Greenland and the Canadian High Arctic. Science of the Total Environment 15 (509–510):133–144. doi:10.1016/j.scitotenv.2014.05.07.