
ABSTRACT
Pollen grains are commonly found in ice cores, particularly those from mountain glaciers at low to middle latitudes. Because the release of pollen from flowers has a seasonality and varies among the plant species, pollen concentrations in ice cores are useful for distinguishing annual or seasonal layers and inferring past vegetation near glaciers. We analyzed major pollen grains in an 87-m-deep ice core drilled at the top of the Grigoriev Ice Cap (4563 m.a.s.l.) in the Tien Shan Mountains, Kyrgyz Republic. Microscopy showed that mainly five pollen taxa were contained in the ice core. Their abundance fluctuated with the depth of the core, indicating their seasonal deposition on the ice cap, while the seasonality of the stable isotopes was not particularly clear because of melting and refreezing signatures. Based on the pollen profiles, annual layers were determined back in time to 1780 AD at a depth of 63.6 m; at greater depth, they could not be distinguished due to ice layer thinning in the glacier. The pollen assemblages have gradually changed during the last 220 years and were particularly distinctive in the deeper part, suggesting the drastic change of vegetation in this region during the Holocene.
Introduction
The Tien Shan Mountains are among the major mountain systems in central Asia and extend more than 2000 km across the vast arid region of the central part of the Eurasia continent. Despite less atmospheric moisture in this region, the mountains rising above 4000 m.a.s.l. can trap water vapor and have developed a number of glaciers (Aizen et al. Citation2007). The glaciers supply vital water for life in the surrounding forest, steppe, and desert, and thus have played an important role in the ecosystems and human settlements through the long history of central Asia (Yang et al. Citation2006). Studies show that recent climate changes have occurred in this region, resulting in glacier contractions and water shortages (Aizen et al. Citation1997; Barnett, Adam, and Lettenmaier Citation2005; Sorg et al. Citation2012; Farinotti et al. Citation2015). For better projection of future climate changes and water resources in this region, reconstruction of the past environment in mountainous areas is important.
Ice cores drilled from glaciers provide a means to reconstruct the past environment. A number of ice cores have been recovered from glaciers in central Asia during the last three decades, and their records have shown a long environmental history covering hundreds to a thousand years or the entire Holocene (Thompson et al. Citation1989, Citation1997; Aizen et al. Citation2016). For example, fluctuations in oxygen stable isotopes, annual ice thickness, mineral concentration, and soluble ions are used as proxies of air temperature, precipitation, dust storms, and anthropogenic pollution in this region, respectively (Grigholm et al. Citation2015). Such records have improved our understanding of the climate and hydrological systems of central Asia during the Holocene.
Although ice cores are valuable natural proxies of the past environment in this region, dating of annual layers remains challenging. The seasonality of oxygen stable isotopes and/or soluble ions, which have commonly been used to determine annual layers of polar ice cores, is not always applicable to ice cores in this region because they often contain refrozen ice layers, which form as a result of higher air temperature or solar radiation during summer (Fujita et al. Citation1996; Takeuchi et al. Citation2009; Okamoto et al. Citation2011). The seasonality of stable isotopes and soluble ions can be disturbed by percolating melt water, thus not allowing for the identification of annual layers in ice cores.
Pollen grains are commonly found in ice cores in central Asia and have been used as annual or seasonal markers to determine annual layers (Nakazawa et al. Citation2005; Uetake et al. Citation2006; Okamoto et al. Citation2011). They are released from the flowers of herbs and trees and are transported to distant areas by wind and deposited on glacier surfaces in the mountains. Because various vegetation types expand around the mountains, abundant and various pollen grains have been preserved in glaciers in central Asia. Their abundance often exceeds 100 grains per liter of ice melt water (Nakazawa et al. Citation2005). Because pollen grains are released from flowers that bloom during a certain season of year, their vertical profiles in ice cores are useful to distinguish annual or seasonal layers (Nakazawa et al. Citation2004, Citation2005, Citation2011, Citation2015; Festi et al. Citation2015, Citation2017). Furthermore, pollen grains are influenced very little by percolating melt water; thus, their fluctuation can be compared to those of stable isotopes or soluble ions for ice cores with melt features (Uetake et al. Citation2006). For example, the pollen profiles of Betulaceae, Pinus, and Artemisia, which usually occur during May, June, and August, respectively, have enabled determination of annual layers over 85 years (1915–2000) in the upper 48 m of an ice core of the Belukha Glacier in the Altai Mountains, Russia (Okamoto et al. Citation2011). Furthermore, as pollen has been commonly used as a proxy of paleoclimate in lake sediments, pollen assemblages in ice cores may also be indicative of vegetation surrounding the glacier during the past (Liu, Yao, and Thompson Citation1998; Yang et al. Citation2008; Brugger et al. 2018). In the Tien Shan Mountains, a number of studies of pollen in lake sediments, surface soil layers, and its dispersal processes have been conducted (Beer et al. Citation2007; Pan et al. Citation2013; Huang et al. Citation2015); however, there is a lack of information on pollen deposited on glaciers in the highest part of the mountains. Pollen in glacial ice could provide valuable information to understand the dispersal process of airborne pollen as well as the paleo-environment in this region.
In 2007, we drilled an ice core on the Grigoriev Ice Cap in the inner part of the Tien Shan Mountains in Kyrgyz Republic (Takeuchi et al. Citation2014). Because of the unclear seasonality of the stable isotope or dust concentration of the ice core, annual layers have not yet been determined. Pollen grains possibly enable identification of annual layers in the ice core. In this study, we quantified the major pollen grains in the Grigoriev ice core and dated it using their vertical profiles. The decadal change in the pollen assemblages is also discussed as an indicator of vegetation around the glacier.
Study site and methods
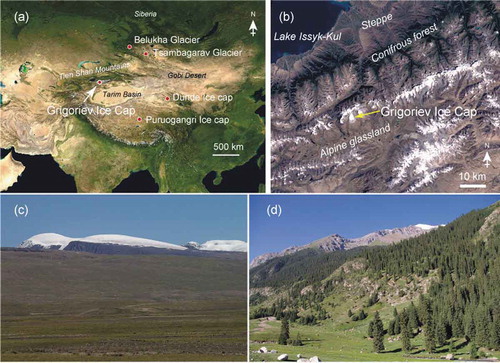
The ice core was drilled at the top of the Grigoriev Ice Cap (41°58ʹ33ʺN, 77°54ʹ48ʺE) in Kyrgyz Republic (). The ice cap is in the Teskey Ala-too Range in the inner Tien Shan, an area extending southward from Lake Issyk-Kul. The ice cap covers a small summit approximately 8 km2 in area. The top of the summit is a flat snowfield at an elevation of 4563 m.a.s.l. Our two-year automatic meteorological measurement at the top of the ice cap (2005–2007) showed that the annual precipitation is approximately 290 mm, which is equivalent to 643 mm of snow accumulation (surface snow density was assumed to be 451 kg m−3; Fujita et al. Citation2011). The vegetation around the glacier mainly consists of alpine grassland extending mostly along the southern side of the ice cap at elevation of 3000–3600 m.a.s.l. ()). The lower part of the Terskey Ala-too Mountains is mostly characterized by a coniferous forest dominated by Picea schrenkiana, extending to the northern side of the ice cap at elevation of 1500–3000 m.a.s.l. (Beer et al. Citation2007, )). This forest is the potential source of the pollen grains in the ice core. The ice core was recovered from the surface to the bedrock of the ice cap at a depth of 86.87 m. The tritium peak corresponding to the atmospheric nuclear test in 1963 AD was found at a depth of 18.4 m. The bottom soil and three prominent dust layers near the bottom were dated using radiocarbon, which showed early to middle Holocene ages ranging from c.a. 6000 to 12,500 cal. year before the present (Takeuchi et al. Citation2014; ).
Figure 1. Location map (a) and satellite image (b) of the Grigoriev Ice Cap in Kyrgyz Republic, central Asia. The location map is from a global map provided by NASA earth observatory. The satellite image was acquired on August 25, 2001, by Landsat 7 Enhanced Thematic Mapper Plus. Photographs of the dominant vegetation near the glacier include alpine grassland (c) and coniferous forest (d). Images: (a) and (b): NASA; (c) and (d): author Nozomu Takeuchi.
The ice core was transported in a frozen state to the ice core laboratory at the Research Institute for Humanity and Nature in Kyoto, Japan, following drilling. In the laboratory, the core was cut every 4–5 cm for the upper 50 m and 1–4 cm below 50 m, which was adapted to the layer thinning with depth. The total number of samples was 2,067. Each sample was used for analyses of oxygen stable isotopes and particle concentration (Takeuchi et al. Citation2014). A part of these samples was also used for pollen analysis.
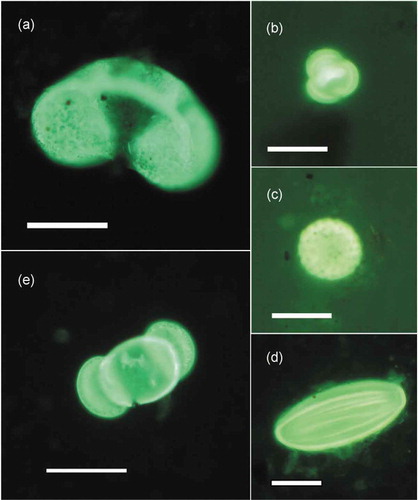
Identification of the pollen types was performed to that taxonomical level with a phase-contrast and fluorescence microscope at 400x magnification (BH-51, Olympus, Japan) using standard identification keys (Moore, Webb, and Collison Citation1991). We found five major pollen types in the ice core; namely, Artemisia, Picea, Pinus, Chenopodiaceae, and Ephedra (). These pollens were chosen for analysis in this study since they have already been used as annual or seasonal markers to determine annual layers in other ice cores in Central Asia (Nakazawa et al. Citation2005; Uetake et al. Citation2006; Okamoto et al. Citation2011). Pollen grain counting was conducted for the five types basically following the method of Nakazawa et al. (Citation2004, Citation2005). We found other pollen types, which were counted as others although their counts in each sample were too small (less than two counts per 10 mL) to represent annual layer boundary. At total of 10 mL of the melted samples was filtered through a 0.45-µm pore size hydrophilic membrane filter (JHWP01300, Millipore, Japan), and the pollen grains on the filter were then counted using the fluorescence microscope. All of the five types of pollen grains have strong fluorescence under ultraviolet excitation and can be identified using their standard pollen keys in the fluorescence. To simplify the analytical process and prevent pollen loss, the samples were subjected to neither chemical treatment nor centrifugation. Although this is a non-standard palynological method, it is efficient for analysis of a large number of ice core samples and is sufficient to identify the taxonomical level of five pollen types. However, this method may prevent the identification of some pollen types to be counted, and results may not be comparable with pollen data analyzed with a standard method. Furthermore, although there is some evidence of variation in pollen fluorescence with time (Yeloff and Hunt Citation2005), the fluorescence is unlikely to be decayed significantly in this study since the pollen had been preserved in ice in a frozen state.
Figure 2. Photograph of five major pollen grains of the Grigoriev ice core observed with a fluorescence microscope: (a) Picea; (b) Artemisia; (c) Chenopodiaceae; (d) Ephedra; and (e) Pinus. Scale bars are 50 µm for (a) and (b) and 20 µm for (c), (d), and (e).
In order to evaluate the dating by the pollen profile and to calculate net annual accumulation of ice on the glacier, annual layer thickness was corrected with a simple ice thinning model (Nye Citation1963). The model relies on a representative surface accumulation rate and a constant vertical thinning rate.
Results
Pollen profiles in the ice core
The pollen profile extracted from the ice core showed that layers with high and low pollen concentrations repeatedly appeared (). The layers with low pollen concentrations probably corresponded to winter accumulation, although there might be other pollen types that could not be counted with the method in this study.
Figure 3. Vertical profiles of total concentrations and five pollen-type concentrations: (a) total; (b) Picea; (c) Artemisia; (d) Chenopodiaceae; (e) Ephedra; (f) Pinus; and (g) oxygen stable isotope from the surface to bedrock (87 m depth) of the Grigoriev ice core. Total includes the five major types and other unidentified pollen types counted in this study.
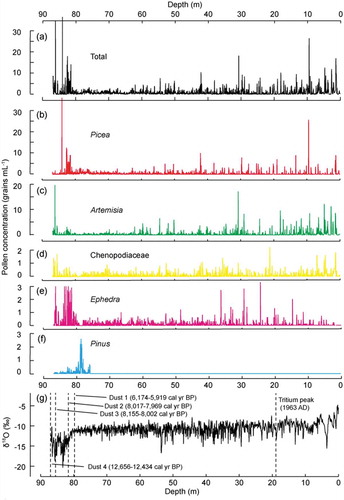
The most abundant pollen type observed in the ice core was Artemisia ()), ranging from 0 to 32.8 grains mL−1 (mean: 0.40 grains mL−1; ) and accounting for 40 percent of the total pollen in the ice core. This type showed peaks from the surface down to the bottom. However, below 64.3 m, the abundance was mostly less than 1 grain mL−1 and the peaks were smaller than those above the depth. In the layers below 80 m, the abundance was generally low (0.0–3.0 grains mL−1), but there was a high peak at 86.3 m (32.8 grains mL−1). Intermediate abundance was found in the ice near the bottom (2.0–8.4 of pollen grains mL−1). The Artemisia type has been commonly found in lake sediments and surface soils in the Tien Shan Mountains, and it is usually the most dominant in herb pollen (Beer et al. Citation2007; Huang et al. Citation2015). The source plant Artemisia sp. is distributed in the lower desert/steppe zone of the Tien Shan Mountains (below 1500 m; Huang et al. Citation2015). However, it is not only one single species contributing to this pollen type. The Artemisia pollen was significantly more abundant compared to that of the other herb pollen of the desert/steppe (Chenopodiaceae and Ephedra) in the ice core. Therefore, the Artemisia pollen may be derived from the adjacent alpine grassland of the ice cap.
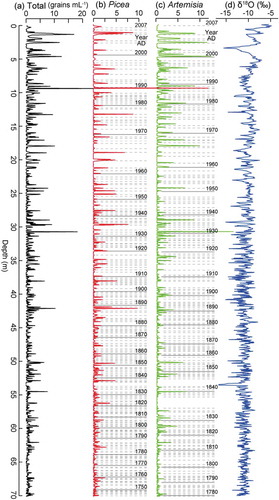
Figure 4. Vertical profiles of (a) total, (b) Picea, and (c) Artemisia-type pollen concentrations, and (d) the oxygen stable isotope in the upper 70 m of the Grigoriev ice core. Dashed horizontal lines mark annual boundaries determined by each pollen type, and full horizontal lines show the boundaries identified every ten years. Total includes the five major types and other unidentified pollen types counted in this study.
Picea-type pollen was the second most abundant pollen and ranged from 0 to 36.1 grains mL−1 (mean: 0.43 grains mL−1; ). It accounted for 37.1 percent of the pollen counted in this study. It also showed peaks from the surface to the bottom. The depth of each peak did not exactly coincide with those of Artemisia. Abundance became low and peaks were smaller below 60 m. In the layers below 80 m, the abundance slightly increased, and some higher peaks (10–40 grains mL−1) appeared between 81.0 and 83.2 m depth. Picea pollen is most likely from Picea schrenkiana, which is the most dominant coniferous tree in the Tien Shan Mountains and is distributed on the slope of the northern side of the Grigoriev Ice Cap (Beer et al. Citation2007; Pan et al. Citation2013; Huang et al. Citation2015).
Although the Artemisia and Picea pollen were the major pollen types in the ice core, two other types of herb pollen were also commonly found: Chenopodiaceae and Ephedra. Chenopodiaceae-type pollen occurred from the surface to the bottom of the ice core. It ranged from 0 to 2.2 grains mL−1 (mean: 0.09 grains mL−1). Peaks were broad and did not correspond to those of Artemisia and Picea. Ephedra-type pollen showed a distinctive profile from that of the other three pollen types. It ranged from 0 to 9.0 grains mL−1 (mean: 0.13 grains mL−1). The abundance was generally less than 1 grain mL−1 in the layers of the upper part of the ice core (above 80 m), but high concentration peaks (2–4 grains mL−1) frequently appeared in the layers near the bottom. These two pollen types have been commonly found in lake sediments and surface soils in the Tien Shan Mountains (Beer et al. Citation2007; Huang et al. Citation2015) and were likely derived from the lower arid steppe expanding in elevation between 1600–2000 m.a.s.l.
Pinus-type pollen was found only in the ice below 75.8 m. As mentioned earlier, Picea is the dominant coniferous tree in the Tien Shan Mountains, but no Pinus tree is present in the modern forest in this region (Beer et al. Citation2007; Pan et al. Citation2013; Huang et al. Citation2015). This Pinus pollen may be derived from distant forests or from adjacent forests that had Pinus trees in the past.
There were some extreme peaks in each pollen type; for example, 25.7 grains mL−1 at 9.48 m for Picea and 17.2 grains mL−1 for Artemisia (). This is possibly caused by significant melt over multiple years. However, the extreme peaks appeared for only a single pollen type; thus, they are probably due to exceptional production and deposition of the pollen type.
Annual layer counting using pollen grains
The profiles show that Picea and Artemisia pollen have generally clear peaks, likely corresponding to their flowering season (). In contrast, the Chenopodiaceae and Ephedra types did not always show clear peaks, probably because of the longer distance from the source area of the pollen, longer flowering period, or inclusion of multiple species, which were not identified in this study (). Concentrations of Picea and Artemisia pollen grains were also much greater than those of Chenopodiaceae and Ephedra, suggesting an abundant supply of the two pollen types on the ice cap. An observational study in the Tien Shan Mountains has shown that the dispersal of Picea pollen (Picea schrenkiana) is concentrated over one or two weeks during May or June (Pan et al. Citation2013). The Artemisia flowering season near the glaciers is typically during August or September (Nakazawa et al. Citation2005). Although the profile of stable isotopes showed partially unclear seasonal signals, a significant positive correlation between Picea pollen and the stable isotope (r = 0.3, P = 0.02 < 0.05) suggests that the Picea peaks appear in summer and have a seasonal cycle. Artemisia pollen did not correlate significantly with Picea or the stable isotope. This is probably due to different timing of seasonal fluctuation between Artemisia pollen and the stable isotope.
In this study, we used these two pollen profiles to determine the boundaries of the annual layers of the ice core. The annual layer boundary was defined as the beginning of pollen deposition on the ice cap; i.e., the boundaries were determined by the samples above 0.2 grains mL−1 of pollen concentration that were placed just above the sample less than 0.2 grains mL−1. The boundaries were automatically determined for the two pollen types. The threshold was determined by the pollen concentration that best divides the apparent pollen peaks.
As a result, we identified 267 and 229 annual layers from the surface to 70 m depth using Picea and Artemisia pollen profiles, respectively ( and ). The depths of the two pollen boundaries did not agree with each other. The Artemisia-rich layers generally appeared above the Picea-rich layers above 50 m (). This is likely due to the different flowering season of each pollen. The disagreement of annual layers of the two pollen types may be caused by less pollen production of either species in some years. The thickness of annual layers became thinner as the depth increased. This is probably due to vertical layer thinning by ice compression. The relationship between depth and time determined by the two pollen types is shown in . Although the boundaries of the two types of pollen did not agree, the depth-time relationship agreed well above 50 m. The tritium maximum of the atmospheric nuclear bomb experiment in 1963 AD was detected at 19.1 m in this ice core (Takeuchi et al. Citation2014), which was dated as 1963 AD and 1962 AD by Picea and Artemisia pollen, respectively. The differences in years between the two pollen datings were 3, 2, 0, 4, 5 years at 10, 20, 30, 40, and 50 m, respectively, suggesting that both types of pollen dated the annual layer with an uncertainty less than five years above 50 m. However, the difference became greater below 50 m; it was 10 and 26 years at 55 and 60 m.
Figure 5. Detailed vertical profiles of Picea- and Artemisia-type pollen concentrations, and oxygen stable isotopes from 15 to 25 m (a) and from 55 to 65 m (b) of the Grigoriev ice core. Dashed horizontal lines mark annual boundaries and full horizontal lines show the boundaries identified every ten years.
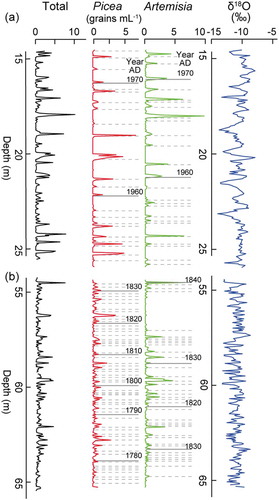
Figure 6. Depth and year (AD) relationships of the Grigoriev ice core determined by two pollen signals and by an ice thinning model with the assumption of different annual accumulations (250, 300, and 350 mm w.e. year−1).
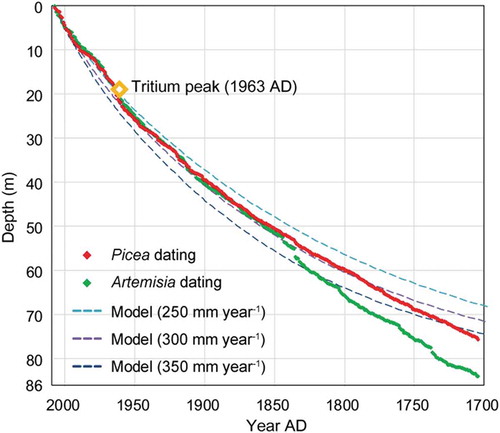
Depth-time relationships obtained from an ice thinning model using three assumptions of annual accumulation (250, 300, and 350 mm water equivalent (w.e.) year−1) are also shown in . As compared with the pollen dating curves, the model calculation with the assumption of 300 mm w.e. year−1 of annual accumulation appeared to fit the pollen dating. However, Artemisia dating was out of the model curve below 50 m. There were fewer Artemisia-rich layers below 50 m, which may be due to less deposition of the pollen during this time period ()). Therefore, we finally used the Picea pollen profile to determine the annual layers in this ice core. Picea pollen was also out of the model curve below 64 m. This is probably due to the detection limit of pollen seasonality with the ice cutting interval used in this part. In order to detect the pollen seasonality, the cutting interval should be small enough compared to the annual layer thickness. However, the annual layers exponentially became thinner in the deeper part of the glacier due to ice compression. In this study, we cut the ice core with an interval of 4 cm at a depth from 60 m to 70 m, which was probably too large to detect the seasonal signals of pollen deposition in this part of the core. Therefore, we concluded that Picea pollen dating is useful in this ice core above 64 m, which corresponds to the years from 2007 to 1780 AD.
Discussion
Comparison of the pollen assemblage to ice cores of central Asia
The pollen assemblage of the Grigoriev ice core can be characterized by the dominance of the Artemisia and Picea types with minor content of Chenopodiaceae and Ephedra and other pollen types. This assemblage is distinctive from those of other ice cores reported in central Asia. For example, Pinus and Betula pollen dominates the Belukha ice core of the Altai Mountains, approximately 1100 km northeast of the Grigoriev Ice Cap (; Nakazawa et al. Citation2005). There is abundant tree pollen in the Belukha ice core area because of the vast Siberian boreal forests expanding north of Belukha Glacier. The Tsambagarav ice core in the same Altai Mountains, however, showed less tree pollen and dominance of the Artemisia type (Brugger et al. Citation2018a). Because the Tsambagarav Glacier is in the Mongolian Altai, southeast of the Belukha Glacier and distant from the boreal forest, the pollen assemblage is dominated by herb pollen rather than tree pollen.
The three major types of herb pollen in the Grigoriev ice core—Artemisia, Chenopodiaceae, and Ephedra—were also abundant in the Dunde ice core from the Qillian Mountains 2000 km east of the Grigoriev Ice Cap (Liu, Yao, and Thompson Citation1998). The Dunde Ice Cap is surrounded by arid desert, similar to the Tien Shan Mountains. The low abundance of tree pollen in the Dunde ice core is probably because of the decreased forest area around the ice cap compared to that of the Tien Shan Mountains. These types of herb pollen were also abundant in the Puruogangri ice core on the Tibetan Plateau, which shares similar geographic conditions to those of the Dunde ice core (; Yang et al. Citation2008). These geographical variations in pollen assemblage of the ice cores in central Asia suggest that the pollen in ice cores are generally derived from regional areas and potentially indicative of past vegetation around a glacier.
The pollen assemblage in the Grigoriev ice core is likely a mixture of pollen originating from different altitudinal zones of the Tien Shan Mountains. As compared to the pollen assemblage in the soil surface in the Tien Shan Mountains, the assemblage of the ice core generally agrees with that in forests and low land steppes, although the pollen deposition process is different between soil and glaciers. Pollen in soil is more from sources at extra-local to regional scales, but that on glaciers is from sources of regional scale. A study of the soil surface showed that Picea pollen was abundant in the forest of the mountain slopes near the ice cap (Beer et al. Citation2007) because the spruce trees are abundant locally. Artemisia and Chenopodiaceae are the pollen types commonly observed in deposits in the desert steppe zone below 1800 m elevation (Huang et al. Citation2015). Although this type of steppe zone is present near Issy-Kul Lake north of the ice cap ()), Artemisia is unlikely only from this low land steppe because the abundance was greater than that of the Chenopodiaceae. The Artemisia pollen was probably derived from the adjacent alpine grassland of the glacier because the plant also grows widely there. A study showed that the soil surface of high alpine grassland (>2800 m) of the Tien Shan Mountains is dominated by Cyperaceae pollen (Huang et al. Citation2015); however, it was rarely observed in the ice core and has much lower abundance than that of Artemisia and Chenopodiaceae. Furthermore, Cyperaceae is also minor in other ice core assemblages in central Asia. Thus, this pollen may have not been blown over the glaciers in the upper mountains, although it is dominant in the grassland. A lake sediment core of the Tien Shan Mountains showed Artemisia and Chenopodiaceae dominance in layers of the last 2,000 years (Huang et al. Citation2015). Although these pollen grains in the sediment are common to those in the ice core, they were likely derived from different vegetation zones in the Tien Shan Mountains; i.e., lower steppe for the lake sediment and lower steppe and alpine grassland for the ice core.
Validation of pollen dating using the relationship between stable isotopes and observed air temperatures
Uncertainty in the dating, particularly a disagreement between two pollen peaks in the ice, occurs for several reasons. Fujita et al. (Citation2011) showed a significant decrease in the snow surface level because of summer melting at the drilling site of the Grigoriev Ice Cap, although all melt water was refrozen in the snow layer. Such surface melting would eliminate the seasonal peaks of different pollen taxa. Nakazawa et al. (Citation2005) suggested that strong winter storms may cause erosion of the surface snow, resulting in a lack of winter layers. Nevertheless, results showed that the pollen dating was consistent with the tritium maximum layer and agreed well with the depth-time curve obtained with an ice thinning model, suggesting that the effects of melt or erosion of the surface snow on the pollen profiles were small enough to preserve their seasonal signals.
To validate the annual layer counting using pollen, we calculated annual mean oxygen isotopes and compared them to annual mean air temperature derived from local instrumental observation (). The instrumental air temperature used was a record from the city of Almaty, 165 km northwest of the Grigoriev Ice Cap, from 1888 to 2002 (Cherednichenko et al. Citation2015). Stable isotopes in ice cores drilled in central Asia vary for many reasons, including moisture source, amount effect, and air temperature (Aizen et al. Citation2006, Citation2016). However, observations have shown that stable isotopes of precipitation in the Tien Shan Mountains are closely correlated with air temperature (Tian et al. Citation2007). Therefore, the annual mean isotope would be correlated with local air temperature if the dating is correct. Both the annual mean isotopic value and the annual mean air temperature at Almaty (from January to December) were normally distributed (Shapiro-Wilk normality test, isotope: W = 0.9883, P = 0.3701 > 0.05; temperature: W = 0.9838, P = 0.1724 > 0.05). As in the previous study (Tian et al. Citation2007), we applied a Pearson’s correlation test between the annual mean isotopic value and the annual mean air temperature, and found a significant positive correlation (r = 0.3386, df = 114, P = 0.000 < 0.01; )). The error of timescale for the correlation was ignored in this test. This significant correlation suggests that the annual layers determined by the pollen profile are reliable.
Figure 7. Inter-annual variations for the last 120 years in stable isotopes on the basis of pollen annual layer counting (a) and instrumental air temperature at Almaty (b) and a correlation plot between them (c).
Inter-annual variations in the stable isotopes and net accumulation of ice (mass balance in water equivalent) based on pollen dating over the last 230 years are shown in . The stable isotopes as a proxy of air temperature showed gradual warming during the twentieth century and a significant increase after 1990. These also indicated that air temperature was nearly steady from the late eighteenth century to the nineteenth century, except for a small cooling event during the 1830s. The net accumulation shows a fluctuation over the last 230 years with a mean of 298 mm w.e. year−1. It shows a relatively high net accumulation in the mid-twentieth century, which agrees with an instrumental precipitation data at the Tien-shan Meteorological Station (Fujita et al. Citation2011). However, the net accumulation was not statistically correlated with the precipitation data (1930–2002 AD), probably due to the effect of melt water runoff on the ice cap.
Figure 8. Inter-annual variations for the last 220 years in oxygen stable isotopes (a) and net accumulation (b) of the Grigoriev ice core based on pollen annual counting. The thin and thick lines indicate annual and five-year running mean, respectively.
Temporal variations in pollen grains as indicators of past vegetation
The decadal mean of the pollen assemblages shows that Artemisia pollen gradually increased while Picea pollen decreased over the last 220 years, indicating recent vegetation change around the ice cap. The mean percentage of Artemisia was 36 percent during the nineteenth century, but increased to 50 percent during the twentieth century ()). The decadal mean of total pollen flux on the glacier ranged from 11 to 42 × 104 grains m−2 year−1 (mean: 24 × 104 grains m−2 year−1) before the twentieth century, but increased after the 1980s, ranging from 29 to 65 × 104 grains m−2 year−1 (mean: 50 × 104 grains m−2 year−1; )). Therefore, this change in the pollen assemblage was probably because of an increase in the Artemisia pollen flux, which may be a result of the expansion of grassland near the ice cap. The expansion appears to have been caused by an increase in precipitation and climatic warming during the late twentieth century.
Figure 9. Decadal pollen assemblages (a) and total pollen flux (b) in the Grigoriev ice core. Pollen assemblages in the ice at the four dust layers near the bottom are also shown (a). The dust layer numbers correspond to those in . Total pollen flux includes the five major types and other unidentified pollen types counted in this study.
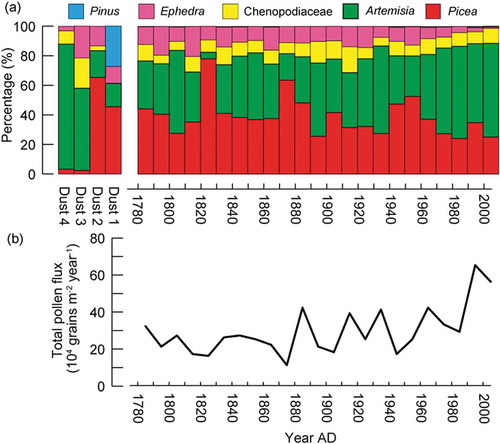
In the deeper part of the ice core, there was a distinctive pollen assemblage from that of the modern ()), suggesting that different vegetation had expanded during the early to mid-Holocene. The pollen assemblage in the 10 cm of ice above the two upper dust layers (Dust 1 at 79.53 m and Dust 2 at 81.79 m), which have been dated as 6174–5919 cal. year BP and 8017–7969 cal. year BP, respectively (Takeuchi et al. Citation2014), showed abundant Picea pollen, accounting for approximately 70 percent ()), suggesting less alpine grassland around the ice cap. Furthermore, Pinus pollen was only abundant in the Dust 1 layer at 79.53 m, suggesting the presence of a different atmospheric circulation pattern or vegetation in this region at the time. A pollen assemblage in the ice above the lower dust layer (85.52 m in depth), dated as 8155–8002 cal. year BP, and that in ice above the bottom soil, dated as 12,656–12,434 cal. year BP, showed that limited Picea, but abundant Artemisia pollen grains, occurred in the ice. This suggests that the coniferous forest had not yet expanded during the early Holocene in the Tien Shan Mountains. However, since we used only limited volume of ice samples, identified pollen at a low taxonomical level, and analyzed it with non-standard palynological methodology in this study, these interpretations of the vegetation change may be too partial. Analysis of pollen in this ice core with a palynological standard would offer significant potential to reconstruct past vegetation in the region in a future study.
Conclusions
Examination of major pollen grains in the Grigoriev ice core drilled in the inner Tien Shan Mountains, Kyrgyz Republic, shows that they mainly consist of five taxa, which likely originated from different vegetation zones in the region. Picea and Artemisia pollen are the most dominant taxa in the ice core, and they likely originated from coniferous forest on the north side and alpine grassland on the south side of the ice cap, respectively. Chenopodiaceae and Ephedra pollen are relatively less abundant, and likely originated from the arid steppe meadows expanding on the lower part of the mountain. Picea and Artemisia pollen show clear fluctuations and thus were used for annual layer counting of the ice core. Results show that the annual layers can be counted back in time to 1780 AD at 64 m depth in the ice core using Picea pollen. The dating is verified by the positive correlation between the instrumental records of local air temperatures and annual mean stable isotopes on the basis of the annual layers determined. Decadal variation in the pollen shows an increase in Artemisia pollen deposition after the twentieth century, suggesting recent expansion in the ice cap forefields. The pollen assemblage near the bottom of the ice core suggests less expansion of coniferous forest and alpine grassland during the early and mid-Holocene, respectively.
Acknowledgments
We thank two anonymous reviewers for their comments, which significantly improved the manuscript.
Additional information
Funding
References
- Aizen, E. M., V. B. Aizen, N. Takeuchi, P. A. Mayewski, B. Grigholm, D. R. Joswiak, S. A. Nikitin, K. Fujita, M. Nakawo, A. Zapf, et al. 2016. Abrupt and moderate climate changes in the mid-latitudes of Asia during the Holocene. Journal of Glaciology 62 (233):411–39. doi:10.1017/jog.2016.34.
- Aizen, V. B., E. M. Aizen, D. R. Joswiak, K. Fujita, N. Takeuchi, and S. A. Nikitin. 2006. Climatic and atmospheric circulation pattern variability from ice-core isotope/geochemistry records (Altai, Tien Shan and Tibet). Annals of Glaciology 43:49–60. doi:10.3189/172756406781812078.
- Aizen, V. B., E. M. Aizen, J. M. Melack, and J. Dozier. 1997. Climatic and hydrologic changes in the Tien Shan, Central Asia. Journal of Climate 10:1393–404. doi:10.1175/1520-0442(1997)010<1393:CAHCIT>2.0.CO;2.
- Aizen, V. B., V. A. Kuzmichenok, A. B. Surazakov, and E. M. Aizen. 2007. Glacier changes in the Tien Shan as determined from topographic and remotely sensed data. Global and Planetary Change 56 (3–4):328–40. doi:10.1016/j.gloplacha.2006.07.016.
- Barnett, T. P., J. C. Adam, and D. P. Lettenmaier. 2005. Potential impacts of a warming climate on water availability in snow-dominated regions. Nature 438:303–09. doi:10.1038/nature04141.
- Beer, R., W. Tinner, G. Carraro, and E. Grisa. 2007. Pollen representation in surface samples of the Juniperus, Picea and Juglans forest belts of Kyrgyzstan, central Asia. The Holocene 17 (5):599–611. doi:10.1177/0959683607078984.
- Brugger, S. O., E. Gobet, M. Sigl, D. Osmont, T. Papina, N. Rudaya, M. Schwikowski, and W. Tinner. 2018a. Ice records provide new insights into climatic vulnerability of Central Asian forest and steppe communities. Global and Planetary Change 169:188–201. doi:10.1016/j.gloplacha.2018.07.010.
- Cherednichenko, A., A. Cherednichenko, E. N. Vilesov, and V. S. Cherednichenko. 2015. Climate change in the City of Àlmaty during the past 120 years. Quaternary International 358:101–05. doi:10.1016/j.quaint.2014.12.035.
- Farinotti, D., L. Longuevergne, G. Moholdt, D. Duethmann, T. Mölg, T. Bolch, S. Vorogushyn, and A. Güntner. 2015. Substantial glacier mass loss in the Tien Shan over the past 50 years. Nature Geoscience 8 (9):716. doi:10.1038/ngeo2513.
- Festi, D., L. Carturan, W. Kofler, G. Dalla Fontana, F. de Blasi, F. Cazorzi, E. Bucher, V. Mair, P. Gabrielli, and K. Oeggl. 2017. Linking pollen deposition and snow accumulation on the Alto dell’Ortles glacier (South Tyrol, Italy) for sub-seasonal dating of a firn temperate core. The Cryosphere 11 (2):937. doi:10.5194/tc-11-937-2017.
- Festi, D., W. Kofler, E. Bucher, L. Carturan, V. Mair, P. Gabrielli, and K. Oeggl. 2015. A novel pollen-based method to detect seasonality in ice cores: A case study from the Ortles glacier, South Tyrol, Italy. Journal of Glaciology 61 (229):815–24. doi:10.3189/2015JoG14J236.
- Fujita, K., K. Seko, Y. Ageta, P. Jianchen, and Y. Tandong. 1996. Superimposed ice in glacier mass balance on the Tibetan Plateau. Journal of Glaciology 42 (142):54–460. doi:10.1017/S0022143000003440.
- Fujita, K., N. Takeuchi, S. A. Nikitin, A. B. Surazakov, S. Okamoto, V. B. Aizen, and J. Kubota. 2011. Favorable climatic regime for maintaining the present-day geometry of the Gregoriev Glacier, Inner Tien Shan. The Cryosphere 5:539–49. doi:10.5194/tc-5-539-2011.
- Grigholm, B., P. A. Mayewski, S. Kang, Y. Zhang, U. Morgenstern, M. Schwikowski, S. Kaspari, V. Aizen, E. Aizen, N. Takeuchi, et al. 2015. Twentieth century dust lows and the weakening of the westerly winds over the Tibetan Plateau. Geophysical Research Letters 42 (7):2434–41. doi:10.1002/2015GL063217.
- Huang, X. Z., C. Z. Chen, W. N. Jia, C. B. An, A. F. Zhou, J. W. Zhang, M. Jin, D. S. Xia, F. H. Chen, and E. C. Grimm. 2015. Vegetation and climate history reconstructed from an alpine lake in central Tienshan Mountains since 8.5 ka BP. Palaeogeography, Palaeoclimatology, Palaeoecology 432:36–48. doi:10.1016/j.palaeo.2015.04.027.
- Liu, K. B., Z. Yao, and L. G. Thompson. 1998. A pollen record of Holocene climatic changes from the Dunde ice cap, Qinghai-Tibetan Plateau. Geology 26 (2):135–38. doi:10.1130/0091-7613(1998)026<0135:APROHC>2.3.CO;2.
- Moore, P. D., J. A. Webb, and M. E. Collison. 1991. Pollen analysis. Oxford: Blackwell Scientific Publications.
- Nakazawa, F., K. Fujita, N. Takeuchi, T. Fujiki, J. Uetake, V. Aizen, and M. Nakawo. 2005. Dating of seasonal snow/firn accumulation layers using pollen analysis. Journal of Glaciology 51 (174):483–90. doi:10.3189/172756505781829179.
- Nakazawa, F., K. Fujita, J. Uetake, M. Kohno, T. Fujiki, S. M. Arkhipov, T. Kameda, K. Suzuki, and Y. Fujii. 2004. Application of pollen analysis to dating of ice cores from lower‐latitude glaciers. Journal of Geophysical Research: Earth Surface 109 (F4). doi:10.1029/2004JF000125.
- Nakazawa, F., K. Konya, T. Kadota, and T. Ohata. 2015. Depositional and summer snow melting features in 2007–2011 on the upstream side of Potanin Glacier, Mongolian Altai, reconstructed by pollen and oxygen isotope analysis. Environmental Earth Sciences 74 (3):1851–59. doi:10.1007/s12665-015-4436-1.
- Nakazawa, F., T. Miyake, K. Fujita, N. Takeuchi, J. Uetake, T. Fujiki, V. Aizen, and M. Nakawo. 2011. Establishing the timing of chemical deposition events on Belukha glacier, Altai Mountains, Russia, using pollen analysis. Arctic, Antarctic, and Alpine Research 43 (1):6–72. doi:10.1657/1938-4246-43.1.66.
- Nye, J. F. 1963. Correction factor for accumulation measured by the thickness of the annual layers in an ice sheet. Journal of Glaciology 4:785–88. doi:10.1017/S0022143000028367.
- Okamoto, S., K. Fujita, H. Narita, J. Uetake, N. Takeuchi, T. Miyake, F. Nakazawa, V. B. Aizen, S. A. Nikitin, and M. Nakawo. 2011. Reevaluation of the reconstruction of summer temperatures from melt features in Belukha ice cores, Siberian Altai. Journal of Geophysical Research: Atmospheres 116:D2. doi:10.1029/2010JD013977.
- Pan, Y., S. Yan, H. Behling, and G. Mu. 2013. Transport of airborne Picea schrenkiana pollen on the northern slope of Tianshan Mountains (Xinjiang, China) and its implication for paleoenvironmental reconstruction. Aerobiologia 29 (2):161–73. doi:10.1007/s10453-012-9270-2.
- Sorg, A., T. Bolch, M. Stoffel, O. Solomina, and M. Beniston. 2012. Climate change impacts on glaciers and runoff in Tien Shan (Central Asia). Nature Climate Change 2:725–31. doi:10.1038/nclimate1592.
- Takeuchi, N., K. Fujita, V. B. Aizen, C. Narama, Y. Yokoyama, S. Okamoto, K. Naoki, and J. Kubota. 2014. The disappearance of glaciers in the Tien Shan mountains in Central Asia at the end of Pleistocene. Quaternary Science Reviews 103:6–33. doi:10.1016/j.quascirev.2014.09.006.
- Takeuchi, N., T. Miyake, F. Nakazawa, H. Narita, K. Fujita, A. Sakai, M. Nakawo, Y. Fujii, K. Duan, and T. Yao. 2009. A shallow ice core re-drilled on the Dunde Ice Cap, western China: Recent changes in the Asian high mountains. Environmental Research Letters 4 (4):45207. doi:10.1088/1748-9326/4/4/045207.
- Thompson, L. G., E. Mosley-Thompson, M. E. Davis, J. F. Bolzan, J. Dai, T. Yao, N. Gundestrup, X. Wu, L. Klein, and Z. Xie. 1989. Holocene–Late Pleistocene climatic ice core records from Qinghai–Tibetan Plateau. Science 246:474–77. doi:10.1126/science.246.4926.109.
- Thompson, L. G., T. Yao, M. Davis, K. A. Henderson, E. Mosley-Thompson, P.-N. Lin, J. Beer, H.-A. Synal, J. Cole-Dai, and J. F. Bolzan. 1997. Tropical climate instability: The last glacial cycle from a Qinghai-Tibetan ice core. Science 276:1821–25. doi:10.1126/science.276.5320.1821.
- Tian, L., T. Yao, K. MacClune, J. W. C. White, A. Schilla, B. Vaughn, and K. Ichiyanagi. 2007. Stable isotopic variations in west China: A consideration of moisture sources. Journal of Geophysical Research 112:D10112. doi:10.1029/2006JD007718.
- Uetake, J., S. Kohshima, F. Nakazawa, K. Suzuki, M. Kohno, T. Kameda, S. Arkhipov, and Y. Fujii. 2006. Biological ice-core analysis of Sofiyskiy glacier in the Russian Altai. Annals of Glaciology 43:70–78. doi:10.3189/172756406781811925.
- Yang, B., L. Tang, A. Bräuning, M. E. Davis, J. Shao, and L. Jingjing. 2008. Summer temperature reconstruction on the central Tibetan Plateau during 1860–2002 derived from annually resolved ice core pollen. Journal of Geophysical Research: Atmospheres 113:D24. doi:10.1029/2008JD010142.
- Yang, X., Z. Liu, F. Zhang, P. D. White, and X. Wang. 2006. Hydrological changes and land degradation in the southern and eastern Tarim Basin, Xinjiang, China. Land Degradation & Development 17 (4):381–92. doi:10.1002/ldr.744.
- Yeloff, D., and C. Hunt. 2005. Fluorescence microscopy of pollen and spores: A tool for investigating environmental change. Review of Palaeobotany and Palynology 133 (3–4):203–19. doi:10.1016/j.revpalbo.2004.10.002.