
ABSTRACT
A pollen record from a lake sediment core from southeastern Prince of Wales Island, Nunavut, Canada (SW08; 72.3177, −97.2678, 104 m a.s.l) provides the first high-resolution July temperature reconstruction for the last 1,000 years for the central Canadian Arctic Archipelago. The vegetation underwent marked transitions during the Little Ice Age (LIA; 1500–1800 CE) and Medieval Climate Anomaly (MCA; 1090–1250 CE), which was primarily observed in the proportion of Cyperaceae, Poaceae, and Salix pollen. Cyperaceae pollen was highest in the samples corresponding to the MCA, whereas Poaceae increased during the LIA. In the last 30 years, Salix and Betula pollen increased. The mean July temperature reconstruction showed a long-term cooling from 1080–1915 CE with a sustained cold period from 1800–1915 CE prior to twentieth-century warming. A synthesis of paleoclimate records from across the Arctic demonstrates that pollen-based reconstructions record both high and low frequency climate variability, when sampling resolution is sufficient, and can improve regional climate reconstructions.
Introduction
Although considerable progress has been made into understanding the climate of the past 2,000 years, large-scale reconstructions continue to be hindered by poor spatial coverage, dating uncertainties, and low-temporal resolution data (Christiansen and Ljungqvist Citation2017). These problems are especially noticeable in the Arctic because annually-resolved records (ice cores, tree rings, and varves) are spatially limited, and non-annually resolved records often lack the temporal resolution to address decadal- or centennial-scale climate variability. Consequently, there are gaps in our understanding of regional climate variability across the Arctic, particularly in the Canadian Arctic Archipelago and Siberia. Previous studies have demonstrated the value of pollen-based temperature reconstructions to understand past climate variability in the Canadian Arctic (Peros and Gajewski Citation2009; Gajewski Citation2015), but have not produced high-resolution reconstructions (<50 years between samples) for the last 2,000 years. In this study, we demonstrate that pollen-based reconstructions can capture low and high frequency variability as long as the sampling resolution is sufficiently high. Since lake sediments are the only archives available in certain regions of the Arctic, using pollen-based reconstructions can provide important information about multi-decadal to centennial climate variability from these data-poor regions.
There have been several paleoclimate reconstructions of the Common Era for the Arctic region (Overpeck et al. Citation1997; Kaufman et al. Citation2009; Shi et al. Citation2012; Hanhijärvi, Tingley, and Korhola Citation2013; Tingley and Huybers Citation2013; McKay and Kaufman Citation2014; Nicolle et al. Citation2018; Werner et al. Citation2018), but these have been primarily based on ice core, tree ring, and varve records since these can be annually-resolved. Although there are broad-scale similarities between these reconstructions, there are important differences in the timing and magnitude of the reconstructed conditions. This is due to the kinds of records used (whether they preserve all frequencies accurately), the reconstruction method applied, and the selection of sites retained for analysis. Reconstructions based solely on annually-resolved records may underestimate low frequency variability (Christiansen and Ljungqvist Citation2017; Cook et al. Citation1995; Xing et al. Citation2016) and are limited to specific regions of the Arctic. Pollen and chironomid records from lake sediments have been successfully used to reconstruct Holocene climates in northern North America (MacDonald et al. Citation2009; Peros and Gajewski Citation2009; Porinchu, MacDonald, and Rolland Citation2009; Rolland et al. Citation2009; Clegg et al. Citation2010, Citation2011; Luoto and Helama Citation2010; Gajewski Citation2015), and lakes are widely distributed; however, dating the sediments can produce large uncertainties, resulting in less precise chronologies. Varved sediments may alleviate this problem, but microfossils are frequently rare in these kinds of sediments (e.g., Courtney Mustaphi and Gajewski Citation2013). All of these problems have led to a sparse geographical distribution of the proxy records, particularly in Siberia and the Canadian Arctic, causing spatial underrepresentation and regional biases when attempting large-scale temperature reconstructions (Christiansen and Ljungqvist Citation2017).
This study presents a quantitative temperature reconstruction for the last 1,000 years from Prince of Wales Island, Nunavut, based on fossil pollen assemblages. Pollen records preserve low frequency variability with the temporal resolution of the sampling governing the high frequency variability. There are no quantitative paleoclimate records from this region, so these new data provide information about this understudied region. We also combine these results with others from the literature and describe millennial and centennial climate variability across the Arctic.
Site description
Prince of Wales Island is located in the central High Arctic, Nunavut, Canada. Lake SW08 (unofficial name; 72.3177, −97.2678, 104 m a.s.l; ) is located in a drumlin field ~20 km inland from the eastern coast of Prince of Wales Island. The lake has an area of ~128,850 m2. Although the site is located primarily on sandstone bedrock, glacial activity likely deposited carbonate-rich till throughout the area (Dyke and Morris Citation1988). The vegetation is defined as a dry prostrate-shrub tundra (Walker et al. Citation2002). The nearest weather station is 275 km to the northeast in Resolute Bay, Nunavut, where the mean July temperature (1948–1980) is 4.2 ± 1.2°C (Environment and Climate Change Canada Citation2018).
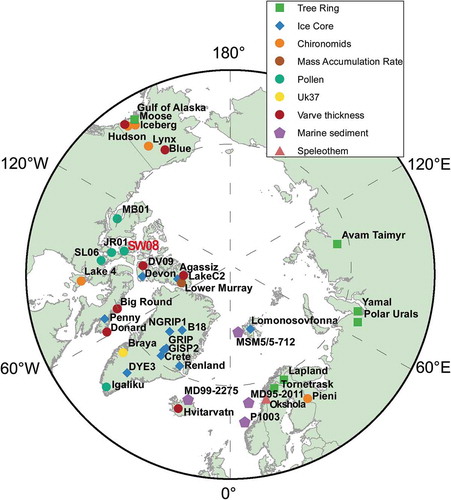
Figure 1. Sites with paleoclimate reconstructions of the past 1,000–2,000 years used in this study. Lake sediment records are denoted by a circle and color-coded by proxy type. The new record from this study is indicated in red (SW08).
Methods
A sediment core was extracted from Lake SW08 in July 2017 using a plastic tube fitted with a piston. The sediment-water interface was preserved in the tube by adding sodium polyacrylate, and the core was shipped back to the University of Ottawa and refrigerated at 4°C.
In the laboratory, the core was extruded and changes in stratigraphy, texture, and color were noted. Loss-on-ignition was measured at 0.5 cm intervals using a LECO Thermogravimetric Analyzer to estimate organic and carbonate weight percent. Samples throughout the core were analyzed for biogenic silica using a wet chemical digestion technique (DeMaster Citation1981; Parsons, Maita, and Lalli Citation1984; Conley and Schelske Citation2001). Sediment samples were digested in 1% sodium carbonate (Na2CO3) for 5 hours in an 85°C water bath. Subsamples were taken at 2, 3, 4, and 5 hours and analyzed using spectrophotometry. Reference samples of known BSi content were processed alongside each batch to ensure experimental control (Tamo Citation2019).
Fossil pollen were analyzed at 0.5 cm resolution, where possible, from the top 25 cm of the core. Pollen was extracted using a heavy-liquid separation technique (Zabenskie, Peros, and Gajewski Citation2006). Two cubic centimeters of sediment were subsampled and two Lycopodium tablets (batch #938934; 10,678 grains/tablet) were added to enable the estimation of the absolute concentration of pollen and spores. Samples were washed in 10 percent HCl and 10 percent KOH prior to heavy-liquid separation using sodium polytungstate (SPT; density: 1.9 g/cm3). The samples were treated with hydrofluoric acid and acetolysis before being transferred to vials with silicone oil (2,000 cs) for permanent storage. At least 300 grains were counted for each level, except at 0.5, 1.5, 6.0, 8.0, and 12.5 cm where pollen concentrations were too low to reach this total. In two cases, at 10.0 and 16.5 cm, there was no material left to count after processing.
Chronology
The core was dated using 210Pb for the uppermost sediments and 14C for the remainder of the core. Eight bulk sediment samples were processed by MyCore Scientific Inc. (Ottawa, Ontario) to analyze the 210Pb activity and ages were determined using a constant rate of supply model (CRS) (Appleby and Oldfield Citation1978). There was no terrestrial organic matter visible in the cores, so six 0.5 cm samples of aquatic moss fragments were sent to the André E. Lalonde Accelerator Mass Spectrometry Laboratory at the University of Ottawa for 14C analysis. The results were calibrated using OxCal v4.2.4 (Bronk Ramsey Citation2009) and the IntCal13 calibration curve (Reimer et al. Citation2013).
Numerical analyses and climate reconstruction
Arctic lake sediments contain pollen that have been transported from the boreal or other forest regions. These long-distance taxa were removed from the pollen sums prior to calculating percentages since they tend to produce a warm bias in paleoclimate reconstructions (Gajewski Citation2015). Three sums were calculated for the pollen stratigraphic diagrams: (1) pollen sums based on only local and regional pollen for use in numerical analyses, (2) based on the entire assemblage (excluding Pediastrum and aquatic pollen) to compute the sum for all taxa, and (3) based on the entire assemblage, including aquatics and Pediastrum, to compare Pediastrum to the pollen assemblages. The pollen assemblages were analyzed using Principal Components Analysis and the scores were plotted with respect to major periods of climate variability in the Arctic (i.e., MCA (1090–1250 CE), LIA (1500–1800 CE)) to examine how the vegetation was altered during each period.
Mean July temperatures were reconstructed from the pollen data using the modern analog technique (MAT) (Overpeck, Webb, and Prentice Citation1985; Sawada Citation2006). The training set used for calibration included Arctic samples (n = 665, Gajewski Citation2015), which were obtained from the North American Modern Pollen Database (Whitmore et al. Citation2005). The calibration set contained local and regional taxa but excluded pollen transported from south of the Arctic (). The average of the closest three analogs was used to estimate past July temperatures, and the squared chord distance between the fossil and all modern samples was analyzed to determine if the fossil level had a good analog.
Table 1. Pollen and spore taxa identified in core SW08. The local and regional taxa were used in numerical analyses. Taxa denoted with an asterisk (*) were part of the modern training set but were not found in the core.
The reconstruction for Lake SW08 was compared to existing records from the Arctic 2k Database (version 1.1.1; McKay and Kaufman Citation2014) and from primary sources (Peros and Gajewski Citation2009; Courtney Mustaphi and Gajewski Citation2013; Lecavalier et al. Citation2017). For this analysis, only records that contained data between 1090 and 1960 CE and had an average sample resolution of less than 100 years were retained (n = 40). The new dataset prepared for this study contains 11 ice core, 18 lake sediment (eight varve, five chironomid, four pollen, and one Uk37 alkenone), four marine sediment, one speleothem, and six tree ring records (Appendix ). To enable comparison between records, those with non-annual resolution were interpolated to 10-year intervals and 10-year block means were calculated for records with annual resolution. Although interpolation will inflate the explained variance of statistical analyses, the dominant trends and relationships should be unaffected by interpolation. Each record was truncated to the common time period for which all records contained data (1090–1960 CE) then standardized by subtracting the mean and dividing by the standard deviation. Two Principal Components Analyses were performed in the program R version 3.5.1 to summarize these data (Oksanen et al. Citation2018; R Core Team Citation2018). The first (PCA1) included all sites in the database but was truncated to their common time period (1090–1960 CE). The second analysis (PCA2) was performed using only records with data covering all of the last 2,000 years (10–1960 CE). Groups were established using cluster analysis with a Euclidean distance measure and Ward’s method of clustering (Kassambara and Mundt Citation2017).
Results
Sedimentary stratigraphy and characteristics
The sediment in core SW08 was very dark gray (10YR 3/1) in the top 7 cm (1900–2017 CE) then became mottled with dark yellowish brown (10YR 3/4) sediment until 12 cm (1650–1900 CE). From 12 to 32 cm, the sediment was uniformly dark yellowish brown (10YR 3/4). Below 32 cm, the sediment was dark grayish brown (10YR 4/2). Organic matter was low throughout the core, never exceeding 6 percent, and carbonate percentages were high, ranging between 22 and 27 percent. Nineteen samples were analyzed for biogenic silica along the core, but no values above detection were measured.
Chronology
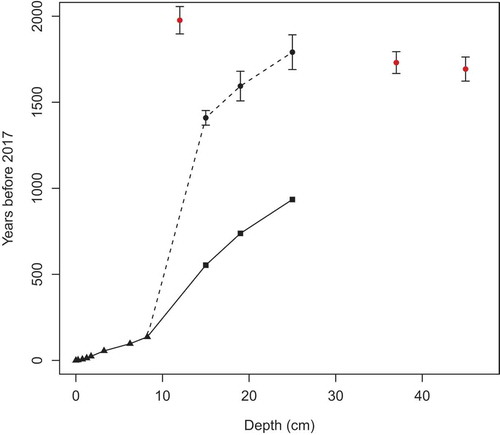
The unsupported 210Pb activity in the uppermost sediment was 134 Bq/kg and reached the supported level of 64 Bq/kg by 3.25 cm at 1962 CE (). The six 14C dates included one anomalously old age and two age reversals at 12, 37 and 45 cm, respectively, which were excluded from age-depth modeling (). The resulting age-depth model was created by linear interpolation of eight 210Pb and three 14C dates; however, this only established a reliable chronology for the top 25 cm of the core (1082 CE). The age-depth curve () shows an unusually large sedimentation rate between 10 and 15 cm. Results such as this are frequently seen in Arctic sediments (MacDonald, Beukens, and Kieser Citation1991; Gajewski et al. Citation2000; Peros and Gajewski Citation2009) and suggest a reservoir effect due to hardwater. Following Peros and Gajewski (Citation2009), a hardwater correction was estimated by calculating the intercept of a linear regression of the accepted radiocarbon dates. The estimated hardwater correction for core SW08 is 856 years, which was subtracted from the remaining calibrated radiocarbon dates to generate an age-depth model whose oldest date at 25 cm is 1082 CE ().
Table 2. 210Pb results and ages based on constant-rate-of-supply (CRS) (Appleby and Oldfield Citation1978) model. The supported activity for all samples was 64.0 Bq/kg.
Table 3. Radiocarbon ages and hardwater-corrected dates. *: Indicates dates rejected and not used in developing the chronology. All dates are based on aquatic mosses extracted from the sediment. Samples were calibrated using OxCal v4.2.4 (Bronk Ramsey Citation2009) and the IntCal13 calibration curve (Reimer et al. Citation2013).
Figure 2. Age-depth curve for core SW08. Triangles are 210Pb ages; Circles are the 14C median calibrated dates with 2σ age range; red circles are 14C dates rejected from age-depth model; Squares are hardwater-corrected 14C dates (see text for details). Solid line represents the corrected age-depth model; dashed line is the age-depth model without hardwater correction.
Pollen stratigraphy
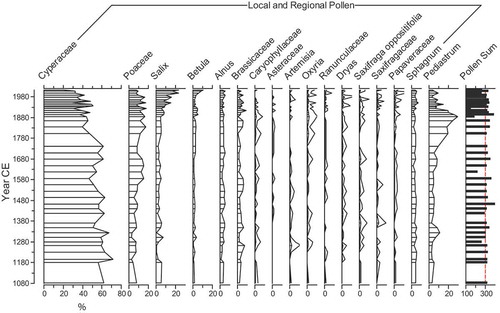
Cyperaceae, Poaceae, and Salix dominated the local and regional pollen (). At the bottom of the core Cyperaceae pollen dominated, comprising up to 70 percent of the assemblage. The general trend of Cyperaceae was a decrease to the present, while Poaceae pollen percentages increased. Both Cyperaceae and Poaceae percentages decreased in the uppermost 5 cm (1930–2017 CE), concurrent with an increase in both Betula and Salix. Other taxa, such as Dryas, Oxyria, Papaver, and Saxifraga oppositifolia, were present, but the percentages were low (<5%). The Oxyria curve was similar to that of Poaceae, but with a lower amplitude of change.
Figure 3. Local and regional pollen in core SW08. The second line in the curves of the rarer taxa is a 5x exaggeration. Sums were calculated based on entire pollen assemblage (local, regional, and long-distance), although the numbers in the final column include all pollen and spores counted.
Pollen transported from forested areas in the south (long-distance pollen), such as Pinus and Picea, remained relatively constant throughout the core (). Betula, which probably originated from the Low Arctic tundra, showed a similar trend as Salix, with a rapid increase in uppermost 2 cm (1970–2017 CE).
Figure 4. Long-distance, local, and regional pollen percentages, pollen concentrations, accumulation rates, and mean July temperature (°C) reconstruction for core SW08. Sums were calculated based on entire pollen assemblage (local, regional and long-distance). On the temperature reconstruction, grey lines are the standard deviation of the three best analogs and the red line is a loess curve (span = 0.25) fitted to the reconstruction.
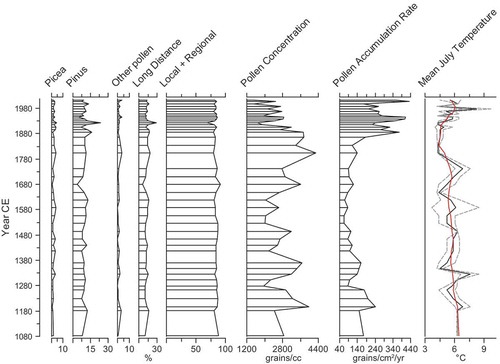
Pollen concentration fluctuated between 2,000 and 4,000 grains cm−3 during the period between 1080–1700 CE. Concentration was highest in the 1800s CE, corresponding to an increase in Poaceae and decrease in Cyperaceae pollen, and then decreased for the last 100 years. Pollen accumulation rates (grains cm−2 yr−1) were high in the earliest samples (1080–1250 CE), then low until 1885 CE when they increased until the present ().
The green coccal algae Pediastrum was present throughout the core, and comprised mainly of the species P. boryanum var. longicorne. Percentages averaged around 8% and then increased between 6 and 12 cm (1650–1920 CE). The increase, which peaked at 30% at 8 cm (1885 CE), occurred during a decrease in Cyperaceae and increase in Poaceae. Tardigrade eggs were also present throughout the core; however, abundances were not recorded.
Ordination of pollen assemblages from SW08
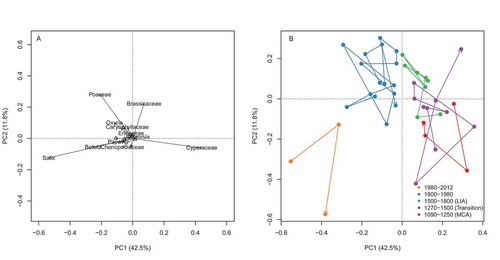
The pollen stratigraphy was analyzed with a principal component analysis of all taxa used in the July temperature reconstruction. Component 1 explains 42.5 percent of the variance and component 2 explains 11 percent (). Cyperaceae is positively correlated, while Salix and Betula are both negatively correlated with the first axis. Brassicaceae and Poaceae are both positively correlated with the second axis. The scores of the first component were positive until the last 200 years and negative thereafter. The scores show a temporal separation on the biplot. Scores from the MCA and late twentieth/twenty-first century were negative on the second component and positive (MCA) or negative (twentieth century) on the first component. Scores from 1500–1980 CE tended to be positive on the second component.
Figure 5. Principal Component Analysis (PCA) for SW08 pollen percentages. Only taxa used in the July temperature reconstruction were included in the PCA (). Panel (a) shows the loadings and (b) shows the scores coloured by year CE and grouped by climatic periods identified in the literature.
Climate reconstruction
Reconstructed July temperatures ranged from 4.5 to 8.0°C and showed a cooling trend of about 1.5°C from 1080–1915 CE and with lowest temperatures (4.5°C) reconstructed between 1800 and 1915 CE. Temperatures rose over the last 100 years to between 5 and 6°C, which is comparable to MCA values ().
Gajewski (Citation2015) determined that a good analog has a dissimilarity value of less than 0.2 in the modern dataset used for these analyses; in the present study, all fossil levels were considered good analogs. The sites chosen as the best analogs were generally from Boothia Peninsula (n = 24), Banks Island (n = 12), and Somerset Island (n = 5). One analog was found on Baffin Island and one on Cornwallis Island.
Discussion
Environmental change on Prince of Wales Island, Nunavut
As is typical in the Arctic, the sediment core from SW08 was inorganic and sedimentation rates were low. This led to difficulties establishing a chronology, which was further complicated by the likely presence of a freshwater reservoir effect due to hardwater. Given the consistently high carbonate values throughout the core, applying a reservoir correction was deemed appropriate for this site to enable the derivation of a chronology. The reservoir correction calculated here is comparable to others for Arctic (e.g., MacDonald, Beukens, and Kieser Citation1991; Snyder et al. Citation1994; Peros and Gajewski Citation2009) and temperate lakes (e.g., Ascough et al., Citation2011; Philippsen Citation2013; Zhou et al. Citation2015).
The pollen assemblages were dominated by herbaceous taxa Cyperaceae and Poaceae, but also contained smaller percentages of other typical Arctic plants (). Gajewski (Citation2002) described regional differences between High Arctic modern pollen assemblages, which were dominated by Poaceae, Caryophyllaceae, and Papaver, and Middle Arctic sites dominated by Cyperaceae and Artemisia. The decrease in Cyperaceae and increase in Poaceae over time at this site, therefore, suggests a shift from warmer to colder and perhaps drier conditions. This interpretation is further supported by changes in less abundant taxa, such as the increase in Caryophyllaceae and Oxyria observed throughout the core, as well as by the temperature reconstruction.
Transitions in the local and regional pollen assemblages () corresponded to reconstructed changes in climate for the circum-Arctic region (Overpeck et al. Citation1997; Kaufman et al. Citation2009; Shi et al. Citation2012; McKay and Kaufman Citation2014; Nicolle et al. Citation2018; Werner et al. Citation2018). Samples corresponding to the MCA (~1090–1250 CE) and LIA (~1500–1800 CE) form two groups on the biplot and those corresponding to the transition period (~1270–1500 CE) overlap these zones. Samples representing the post-LIA (1800–1980 CE) are grouped together, suggesting a sustained period when the vegetation was characteristic of the High Arctic. In the samples from 1980–2012 CE Salix and Betula were important components of the pollen composition, which is unprecedented in relation to the last 1,000 years.
Reconstructed temperatures were similar (6.0–6.5°C; ) during the two warm periods (1090–1250 and 1980–2012 CE); however, the vegetation composition differed. Cyperaceae dominated the earliest samples, which may correspond with the end of the MCA, while samples from the last 100 years saw an increase in Salix and Betula pollen. Several studies have discussed the impacts of modern warming on Arctic vegetation, particularly in relation to the northward expansion of shrubs such as Alnus, Betula, and Salix (Tape, Sturm, and Racine Citation2006; Post et al. Citation2009; Myers-Smith et al. Citation2011). Both Salix arctica and Salix richardsonii currently grow on Prince of Wales Island (Aiken et al. Citation2007) and have likely become more abundant with warming temperatures as documented elsewhere in the Arctic (Hill and Henry Citation2010). Alnus and Betula do not presently grow on Prince of Wales Island, but their increased production in the south could cause more pollen to be transported to the High Arctic, as shown by the increase in pollen percentages as well as pollen accumulation rates after 1980 CE. The increase in shrubs over the last 30 years may also be related to precipitation or hydrological changes, as most regions of the Arctic have experienced increased precipitation over the last 30 years (Hinzman et al. Citation2005). Unfortunately, precipitation reconstructions are less reliable and there are currently no comprehensive analyses of Holocene precipitation across the Arctic (Miller et al. Citation2010; Briner et al. Citation2016; Linderholm et al. Citation2018). Moreover, precipitation patterns are more spatially variable than temperature because they are primarily controlled by cyclonic activity, topography, and atmospheric circulation (Edlund and Alt Citation1989).
Lower temperatures in the reconstruction were indicated by changes in the vegetation and supported by concurrent changes in algal production. Although diatom productivity could not be assessed using BSi, probably due to post-depositional diatom dissolution (Ryves et al. Citation2006; Paull, Finkelstein, and Gajewski Citation2017), the abundance of Pediastrum was inversely correlated with the July temperature reconstruction. The dominant species, Pediastrum boryanum var. longicorne, is generally associated with cold, dystrophic waters (Jankovská and Komárek Citation2000; Komárek and Jankovská Citation2003), so its increase between 1800 and 1915 CE () is consistent with the reconstruction of colder conditions. Pollen concentration decreased during the late 1800s (), suggesting reduced terrestrial productivity. Although few studies have been conducted on the use of Pediastrum as a bioindicator, the increase in algal abundance suggests within lake processes were affected during the Little Ice Age.
High temporal-resolution pollen-based reconstructions from the CAA
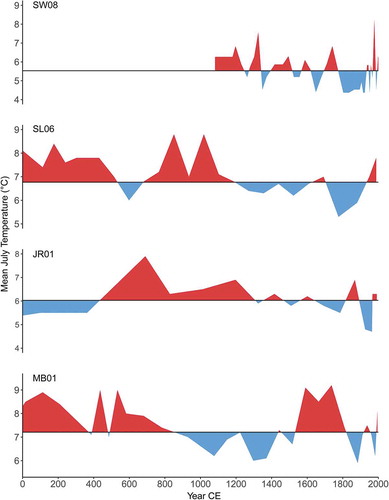
There are several pollen-based temperature reconstructions in the Canadian Arctic spanning the entire Holocene and these have been recently quantitatively summarized by region (Gajewski Citation2015). Although previous studies produced longer records (up to 10,000 years), the results from Lake SW08 are the only reconstruction with high-temporal resolution data (<50 years between samples) for the Common Era. Other reconstructions with an average temporal resolution of less than 100 years between data points (SL06 and MB01, Peros and Gajewski Citation2009) and one slightly lower resolution record (JR01, Zabenskie and Gajewski Citation2007) showed some between-site congruence with SW08 (). Two of the sites (SL06 and MB01) recorded warmer temperatures during most of the first millennium, and the longer records showed a centennial-scale cooling trend in the Common Era. All four sites reconstructed a relative cooling between 1800 and 1930 CE when temperatures decreased by 0.5–1.5°C from the mean of the last 1,000 years for each record. Although each site experienced a cold period of similar amplitude, the duration varied between sites. SW08 and SL06 recorded a longer sustained cold period from 1800–1930 CE and 1775–1950 CE, respectively. At SL06, this period was an intensification of colder conditions that began at ~1100 CE, whereas at SW08 there was more variability prior to 1800 CE.
Figure 6. Pollen-based temperature reconstructions in the Central and Western Arctic. The horizontal line is the mean for each record based on a reference period from 1000–2000 CE. Note: the reconstructions for SL06, JR01, and MB01 differ from the original publications because they were redone using the new modern database from Gajewski (Citation2015).
Synthesis of circum-Arctic paleoclimate records of the past 2000 years
Temperature reconstructions of the past 2000 years averaged across the circum-Arctic region (Kaufman et al. Citation2009; Shi et al. Citation2012; McKay and Kaufman Citation2014; Nicolle et al. Citation2018; Werner et al. Citation2018) are affected by data selection and availability, as well as by the averaging methodologies applied. The Past Global Changes (PAGES) Arctic 2k working group database consists of 56 proxy records (version 1.1.1; McKay and Kaufman Citation2014). Since this database emphasizes annually-resolved records such as tree rings, ice cores, and varves, and these sites are regionally-restricted, reconstructions that are based on only these proxies may be biased (Birks and Birks Citation2006; Christiansen and Ljungqvist Citation2017). Notably lacking from the Arctic 2k database are quantitative pollen-based reconstructions, which contributes to the underrepresentation of data from the western and central Canadian Arctic Archipelago (CAA). We therefore updated the database with the addition of three pollen-based reconstructions (SW08, this study; SL06 and MB01, Peros and Gajewski Citation2009), a varve record not previously used (DV09; Courtney Mustaphi and Gajewski Citation2013), and an updated version of the Agassiz ice core record (Lecavalier et al. Citation2017), for a total of 40 records. We examined the influence of both increasing the spatial coverage of the proxy network and including lower resolution pollen records. Following Kaufman et al. (Citation2009), the average of the records standardized relative to their common period (1090–1960 CE) was computed. These results were compared to the average for all the records (SD with respect to 980–1800 CE) from Kaufman et al. (Citation2009) to analyze the influence of adding more proxy records to the reconstruction (). The curves closely paralleled each other during the last 500 years, but diverged slightly prior to 1500 CE. Although the differences are subtle, the average from this study tends to be warmer than the Kaufman et al. (Citation2009) average, except during the LIA.
Figure 7. (A) Comparison of the average of all the records (n = 40) relative to their common period (1090–1960 CE; orange line) computed for this study and the average for all the records (standard deviation with respect to 980–1800 CE; blue line) from Kaufman et al. (Citation2009). The solid gray line shows the number of records used to compute the average for this study over time (orange line). (B) Average for this study with (orange line) and without (blue line) additional records from the Canadian Arctic Archipelago. (C) Average for this study (orange line) and the PaiCo reconstruction (blue) from McKay and Kaufman (Citation2014). Note: McKay and Kaufman (Citation2014) is a reconstruction of annual temperature anomalies, whereas the averages from this study and Kaufman et al. (Citation2009) are standardized values (z-scores).
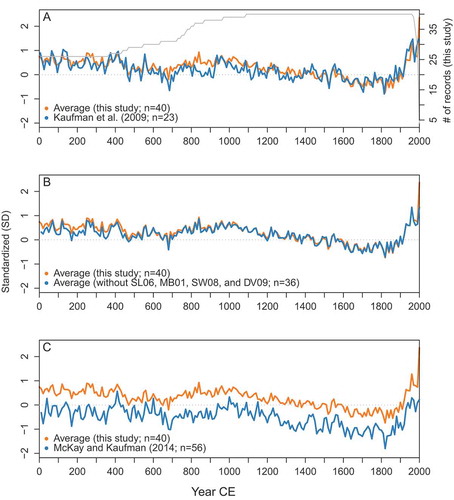
The averages of the records with and without those from the CAA were similar after ~650 CE, before which they were slightly higher (). McKay and Kaufman (Citation2014) also applied the PaiCo method (Hanhijärvi, Tingley, and Korhola Citation2013) in another reconstruction. The results are similar to the average for this study, but applying the PaiCo method produced consistently colder temperatures and higher variance (). However, the PaiCo method does not retain the magnitude of proxy values, so the variance produced may be artificial.
These results demonstrate that the additional records modify the reconstruction but also preserve the temporal trends despite the potential chronological errors and lower resolution. The magnitude of differences are slight since only four new records were included; however, they do demonstrate that inclusion of lake sediment records, which retain lower frequency variability, can be used to increase the spatial extent of the database especially in data poor regions like northern Canada and Asia ().
The available records (; ) were analyzed using a Principal Component Analysis to determine the spatial and temporal coherence of the data. A first analysis (PCA1) was performed on 40 records that contained data for the past 1,000 years (1090–1960 CE). The first component of PCA1 explains 16% of the variance, the second 13 percent, and the third explains 8 percent (). The scores were grouped based on a cluster analysis of the matrix of reconstructions using a Euclidean distance dissimilarity measure and Ward’s method, which identified four temporal groups: 1090–1260 CE, 1270–1570 CE, 1580–1910 CE, and 1920–1960 CE.
Figure 8. Principal Component Analysis (PCA) of proxy climate records from the Arctic. (A) Records from 1090–1960 CE (PCA1) showing the loadings colored by proxy type. (B) Scores grouped by clusters established using Ward’s method. (C) Records from 10–1960 CE (PCA2) showing loadings colored by proxy type (same legend as in panel A). (D) Scores grouped by clusters established using Ward’s method. Note the different axis scales.
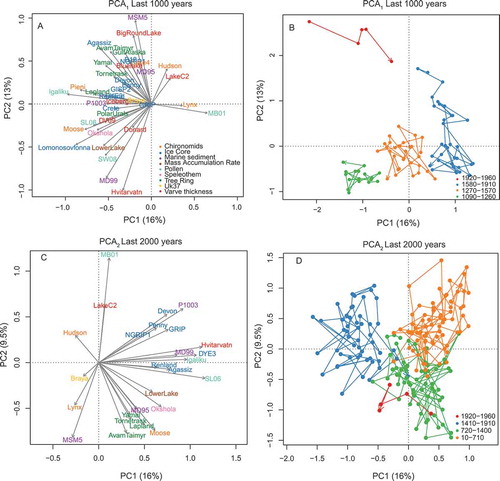
To assess whether the relationships were the same over a longer timescale, a second study (PCA2) compared records with data for the last 2000 years (10–1960 CE). There were fewer records (n = 26) spanning this longer time period: four tree ring, seven ice core, four marine sediment, one speleothem, and 10 lake sediment records (see for proxy type). The first component explains 16 percent of the variance, the second 9.5 percent, and the third 8 percent. Four temporal groups were again identified by a cluster analysis: 10–710 CE, 720–1400 CE, 1410–1910 CE, and 1920–1960 CE.
The first component in both analyses shows a long-term trend that reverses at 1920 CE. In both cases, all but a few records are similarly loaded suggesting that the first component reflects variability that affected the entire Arctic at the same time. On both timescales, the records that have the highest correlation with the first component are in the North Atlantic (); however, the spatial coherence is greater in PCA2 and includes more ice cores and records from the CAA. Ice core records are generally weakly correlated with the first component in PCA1 except for those that are in units of temperature (Agassiz and Lomonosovfonna). The higher correlation of uncalibrated ice core records with the first component in PCA2 suggests the raw δ18O values may have a more common signal of longer-term climate variability. In addition to temperature, the isotopic signals in ice cores are influenced by the seasonality of precipitation and changes in circulation patterns and thus moisture transport (Krinner and Werner, Citation2003; Masson-Delmotte et al. Citation2005; Werner et al. Citation2001). Although there is a linear relationship between modern surface temperature and isotopic composition, changes in the hydrological regime over time could alter this relationship, thereby biasing reconstructions based on raw δ18O values.
Figure 9. (A) Maps of the loadings from PCA1 and associated scores over time for component 1 and (B) component 2. (C) Maps of loadings from PCA2 and associated scores over time for component 1 and (D) component 2.
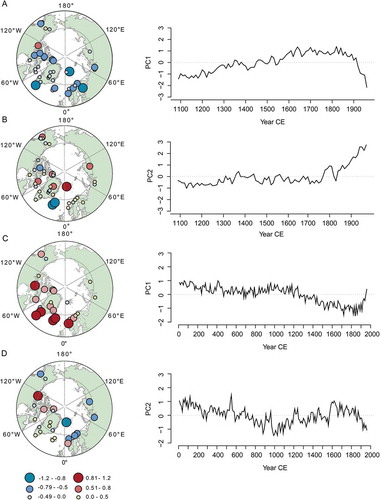
Subsequent components in both PCAs show modifications to the dominant trends that occurred in various records. Records that are highly loaded on the second component of PCA1 have either a strong manifestation of the MCA or modern warming. For example, MD99-2275, Lower Murray Lake, SW08, and Moose Lake are all positively correlated with this component and show warming of 1–2°C between 1100 and 1300 CE. On the other hand, records from Big Round Lake and MSM5/5–712 both show a stronger signal of 20th-century warming but a relative weak medieval warming in the last 1,000 years. Sites located around Iceland (Hvitarvatn and MD99-2275) show a stronger manifestation of the MCA, which may be due to the influence of an intensified Atlantic Meridional Overturning Circulation (AMOC) due to changes in the North Atlantic Oscillation (NAO) at that time (Trouet et al. Citation2009). The long-term temporal pattern of the second component of PCA2 is similar to that of the first component, but it includes several multi-decadal deviations from the long-term trend that correspond to periods of increased volcanism. These occur from 520–570 CE, 900–970 CE, 1190–1250 CE, and 1600–1680 CE. The first peak, for example, corresponds to a period of perceived global climate anomalies between 536–550 CE which has been attributed to major volcanic eruptions in both the southern and northern hemispheres (Sigl et al. Citation2015).
The PCA also indicates that pollen records can capture both low and high frequency variability, although they are highly dependent on the sampling resolution. For example, SW08 and SL06 are in agreement with several other different proxy types (e.g., Lomonosovfonna, MD99-2275, and Lower Murray Lake) over the last 1,000 years, and show a warm MCA, a cool LIA, and the 20th century warming. Although MB01 does not show the same patterns as other records in the last 1,000 years, perhaps due to the lower sampling resolution or to regional differences in climate evolution, it does document the long-term Neoglacial cooling trend over the last 2,000 years.
Conclusion
High-resolution pollen data provide new information about climate variability in the Arctic and help put recent vegetation changes in the context of the last 1,000 years. The pollen-based reconstruction from Prince of Wales Island, Nunavut, Canada is sampled at a higher temporal resolution than previous studies and shows more variability than previous Holocene-scale reconstructions (Zabenskie and Gajewski Citation2007; Peros and Gajewski Citation2009). Our reconstruction of temperature provides evidence for sustained colder conditions in the 1800s and unprecedented vegetation change in the last 30 years.
Obtaining quantitative, rather than index-based, reconstructions will enable the production of large-scale reconstructions without standardizing the data so that a more realistic amplitude of change can be produced. Although this has recently been done for the Agassiz ice core (Lecavalier et al. Citation2017) and several tree ring records (Grudd Citation2008; Helama et al. Citation2009), those proxies are regionally limited, so separating proxy-based bias from regional patterns may be difficult. Lake sediments are the only archive with sufficient spatial representation across the Arctic and changes in pollen assemblages have consistently shown direct association with climate (Gajewski Citation2002, Citation2015). We demonstrate that pollen-based paleoclimate reconstructions can provide important regional information that preserve the low and high frequency temporal trends when added to existing databases of proxy records. Despite chronological limitations, the addition of pollen and other lake sediment records into a circum-Arctic analysis of spatial and temporal climate variability is necessary to reduce spatial gaps in the proxy network to produce a robust circum-Arctic climate reconstruction.
Acknowledgments
We would like to thank Amarualik Uluriak and Ross Pudluck for help in the field.
Disclosure statement
No potential conflict of interest was reported by the authors.
Additional information
Funding
References
- Aiken, S. G., M. J. Dallwitz, L. L. Consaul, C. L. McJannet, R. L. Boles, G. W. Argus, J. M. Gillett, P .J. Scott, R. Elven, M. C. LeBlanc, et al. 2007. Flora of the Canadian arctic archipelago: Descriptions, illustrations, identification, and information. Accessed March 18, 2019 http://nature.ca/aaflora/data.
- Appleby, P. G., and F. Oldfield. 1978. The calculation of lead-210 dates assuming a constant rate of supply of unsupported 210Pb to the sediment. Catena 5 (1):1–8. doi:10.1016/S0341-8162(78)80002-2.
- Ascough, P. L., G. T. Cook, H. Hastie, E. Dunbar, M. J. Church, Á. Einarsson, T. H. McGovern, and A. J. Dugmore. 2011. An Icelandic freshwater radiocarbon reservoir effect: Implications for lacustrine 14C chronologies. The Holocene 21 (7):1073–80. doi:10.1177/0959683611400466.
- Berner, K. S., N. Koç, F. Godtliebsen, and D. Divine. 2011. Holocene climate variability of the Norwegian Atlantic Current during high and low solar insolation forcing. Paleoceanography and Paleoclimatology 26:2.
- Bird, B. W., M. B. Abbott, B. P. Finney, and B. Kutchko. 2009. A 2000 year varve-based climate record from the central Brooks Range, Alaska. Journal of Paleolimnology 41 (1):25–41. doi:10.1007/s10933-008-9262-y.
- Birks, H. H., and H. J. B. Birks. 2006. Multi-proxy studies in palaeolimnology. Vegetation History and Archaeobotany 15 (4):235–51. doi:10.1007/s00334-006-0066-6.
- Briffa, K. R., V. V. Shishov, T. M. Melvin, E. A. Vaganov, H. Grudd, R. M. Hantemirov, M. Eronen, and M. M. Naurzbaev. 2008. Trends in recent temperature and radial tree growth spanning 2000 years across northwest Eurasia. Philosophical Transactions of the Royal Society of London B: Biological Sciences 363 (1501):2269–82. doi:10.1098/rstb.2007.2199.
- Briner, J. P., N. P. McKay, Y. Axford, O. Bennike, R. S. Bradley, A. de Vernal, D. Fisher, P. Francus, B. Fréchette, K. Gajewski, et al. 2016. Holocene climate change in Arctic Canada and Greenland. Quaternary Science Reviews 147:340–64. doi:10.1016/j.quascirev.2016.02.010.
- Bronk Ramsey, C. 2009. Bayesian analysis of radiocarbon dates. Radiocarbon 51 (1):337–60. doi:10.1017/S0033822200033865.
- Christiansen, B., and F. C. Ljungqvist. 2017. Challenges and perspectives for large-scale temperature reconstructions of the past two millennia. Reviews of Geophysics 55 (1):40–96. doi:10.1002/rog.v55.1.
- Clegg, B. F., G. H. Clarke, M. L. Chipman, M. Chou, I. R. Walker, W. Tinner, and F. S. Hu. 2010. Six millennia of summer temperature variation based on midge analysis of lake sediments from Alaska. Quaternary Science Reviews 29 (23–24):3308–16. doi:10.1016/J.QUASCIREV.2010.08.001.
- Clegg, B. F., R. Kelly, G. H. Clarke, I. R. Walker, and F. S. Hu. 2011. Nonlinear response of summer temperature to Holocene insolation forcing in Alaska. Proceedings of the National Academy of Sciences 108 (48):19299–304. doi:10.1073/pnas.1110913108.
- Conley, D. J., and C. L. Schelske. 2001. Biogenic silica. In Tracking environmental change using lake sediments. Volume 3: Terrestrial, algal, and siliceous indicators, ed. J. P. Smol, H. J. B. Birks, and W. M. Last, 281–93. Dordrecht, The Netherlands: Kluwer.
- Cook, E. R., K. R. Briffa, D. M. Meko, D. A. Graybill, and G. Funkhouser. 1995. The “segment length curse” in long tree-ring chronology development for palaeoclimatic studies. The Holocene 5 (2):229–37. doi:10.1177/095968369500500211.
- Cook, T. L., R. S. Bradley, J. S. Stoner, and P. Francus. 2009. Five thousand years of sediment transfer in a high arctic watershed recorded in annually laminated sediments from Lower Murray Lake, Ellesmere Island, Nunavut, Canada. Journal of Paleolimnology 41 (1):77. doi:10.1007/s10933-008-9252-0.
- Courtney Mustaphi, C. J., and K. Gajewski. 2013. Holocene sediments from a coastal lake on northern Devon Island, Nunavut, Canada. Canadian Journal of Earth Sciences 50 (5):564–75. doi:10.1139/cjes-2012-0143.
- D’Andrea, W. J., Y. Huang, S. C. Fritz, and N. J. Anderson. 2011. Abrupt Holocene climate change as an important factor for human migration in West Greenland. Proceedings of the National Academy of Sciences 108 (24):9765–69. doi:10.1073/pnas.1101708108.
- DeMaster, D. J. 1981. The supply and accumulation of silica in the marine environment. Geochimica et Cosmochimica Acta 45 (10):1715–32. doi:10.1016/0016-7037(81)90006-5.
- Divine, D., E. Isaksson, T. Martma, H. A. J. Meijer, J. Moore, V. Pohjola, R. S. W. van den Wal, and F. Godtliebsen. 2011. Thousand years of winter surface air temperature variations in Svalbard and northern Norway reconstructed from ice-core data. Polar Research 30 (1):7379. doi:10.3402/polar.v30i0.7379.
- Dyke, A. S., and T. F. Morris. 1988. Drumlin fields, dispersal trains, and ice streams in Arctic Canada. Canadian Geographer/Le Géographe Canadien 32 (1):86–90. doi:10.1111/j.1541-0064.1988.tb00860.x.
- Edlund, S. A., and B. T. Alt. 1989. Regional congruence of vegetation and summer climate patterns in the Queen Elizabeth Islands, Northwest Territories, Canada. Arctic 42 (1): 3–23.
- Environment and Climate Change Canada. 2018. Monthly Data Report for 1947 - Resolute Bay. http://climate.weather.gc.ca/index_e.html.
- Esper, J., E. R. Cook, and F. H. Schweingruber. 2002. Low-frequency signals in long tree-ring chronologies for reconstructing past temperature variability. Science 295 (5563):2250–53. doi:10.1126/science.1066208.
- Fisher, D. A., R. M. Koerner, J. C. Bourgeois, G. Zielinski, C. Wake, C. U. Hammer, H. B. Clausen, N. Gundestrup, S.Johnsen, K. Goto-Azuma, et al. 1998. Penny ice cap cores, Baffin Island, Canada, and the Wisconsinan Foxe Dome connection: Two states of Hudson Bay ice cover. Science 279 (5351):692–95. doi:10.1126/science.279.5351.692.
- Fisher, D. A., R. M. Koerner, W. S. B. Paterson, W. Dansgaard, N. Gundestrup, and N. Reeh. 1983. Effect of wind scouring on climatic records from ice-core oxygen-isotope profiles. Nature 301 (5897):205. doi:10.1038/301205a0.
- Gajewski, K. 2002. Modern pollen assemblages in lake sediments from the Canadian Arctic. Arctic, Antarctic, and Alpine Research 34 (1):26–32. doi:10.2307/1552505.
- Gajewski, K. 2015. Quantitative reconstruction of Holocene temperatures across the Canadian Arctic and Greenland. Global and Planetary Change 128:14–23. doi:10.1016/j.gloplacha.2015.02.003.
- Gajewski, K., R. J. Mott, J. C. Ritchie, and K. Hadden. 2000. Holocene vegetation history of Banks Island, Northwest Territories, Canada. Canadian Journal of Botany 78 (4):430–36. doi:10.1139/b00-018.
- Grootes, P. M., and M. Stuiver. 1997. Oxygen 18/16 variability in Greenland snow and ice with 10−3‐ to 105‐year time resolution. Journal of Geophysical Research: Oceans 102 (C12):26455–70. doi:10.1029/97JC00880.
- Grudd, H. 2008. Torneträsk tree-ring width and density AD 500–2004: A test of climatic sensitivity and a new 1500-year reconstruction of north Fennoscandian summers. Climate Dynamics 31 (7–8):843–57. doi:10.1007/s00382-007-0358-2.
- Hanhijärvi, S., M. P. Tingley, and A. Korhola. 2013. Pairwise comparisons to reconstruct mean temperature in the Arctic Atlantic Region over the last 2,000 years. Climate Dynamics 41 (7–8):2039–60. doi:10.1007/s00382-013-1701-4.
- Helama, S., M. Timonen, J. Holopainen, M. G. Ogurtsov, K. Mielikäinen, M., Eronen, M. Lindholm, and J. Meriläinen. 2009. Summer temperature variations in Lapland during the Medieval Warm Period and the Little Ice Age relative to natural instability of thermohaline circulation on multi-decadal and multi-centennial scales. Journal of Quaternary Science 24 (5):450–56. doi:10.1002/jqs.1291.
- Hill, G. B., and G. H. R. Henry. 2010. Responses of High Arctic wet sedge tundra to climate warming since 1980. Global Change Biology 17 (1):276–87. doi:10.1111/j.1365-2486.2010.02244.x.
- Hinzman, L. D., N. D. Bettez, W. R. Bolton, F. S. Chapin, M. B. Dyurgerov, C. L. Fastie, B. Griffith, R. D. Hollister, A. Hope, H. P. Huntington, et al. 2005. Evidence and implications of recent climate change in Northern Alaska and other Arctic regions. Climatic Change 72 (3):251–98. doi:10.1007/s10584-005-5352-2.
- Jankovská, V., and J. Komárek. 2000. Indicative value of Pediastrum and other coccal green algae in palaeoecology. Folia Geobotanica 35 (1):59–82. doi:10.1007/BF02803087.
- Kassambara, A., and F. Mundt. 2017. Package ‘factoextra’. Extract and Visualize the Results of Multivariate Data Analyses 76. http://www.sthda.com/english/rpkgs/factoextra
- Kaufman, D. S., D. P. Schneider, N. P. McKay, C. M. Ammann, R. S. Bradley, K. R. Briffa, G. H. Miller, B. L. Otto-Bliesner, J. T. Overpeck, B. M. Vinther, et al. 2009. Recent warming reverses long-term Arctic cooling. Science 325 (5945):1236–39. doi:10.1126/science.1173983.
- Komárek, J., and V. Jankovská. 2003. Review of the green algal genus Pediastrum: Implication for pollen-analytical research. Blumea 48 (2):288.
- Krinner, G., and M. Werner. 2003. Impact of precipitation seasonality changes on isotopic signals in polar ice cores: A multi-model analysis. Earth and Planetary Science Letters 216 (4):525–38. doi:10.1016/S0012-821X(03)00550-8.
- Lamoureux, S. F., and R. S. Bradley. 1996. A late Holocene varved sediment record of environmental change from northern Ellesmere Island, Canada. Journal of Paleolimnology 16 (2):239–55. doi:10.1007/BF00176939.
- Larsen, D. J., G. H. Miller, Á. Geirsdóttir, and T. Thordarson. 2011. A 3000-year varved record of glacier activity and climate change from the proglacial lake Hvítárvatn, Iceland. Quaternary Science Reviews 30 (19–20):2715–31. doi:10.1016/j.quascirev.2011.05.026.
- Lecavalier, B. S., D. A. Fisher, G. A. Milne, B. M. Vinther, L. Tarasov, P. Huybrechts, D. Lacelle, B. Main, J. Zheng, J. Bourgeois, and A. S. Dyke. 2017. High Arctic Holocene temperature record from the Agassiz ice cap and Greenland ice sheet evolution. Proceedings of the National Academy of Sciences 114 (23):5952–57. doi:10.1073/pnas.1616287114.
- Linderholm, H. W., M. Nicolle, P. Francus, K. Gajewski, S. Helama, A. Korhola, O. Solomina, Z. Yu, P. Zhang, W. J. D'Andrea, et al. 2018. Arctic hydroclimate variability during the last 2000 years. Climate of the Past 14 (4):473–514. doi:10.5194/cp-14-473-2018.
- Linge, H., S.-E. Lauritzen, C. Andersson, J. K. Hansen, R. Ø. Skoglund, and H. S. Sundqvist. 2009. Stable isotope records for the last 10000 years from Okshola cave (Fauske, northern Norway) and regional comparisons. Climate of the Past 5 (4):667–82. doi:10.5194/cp-5-667-2009.
- Loso, M. G., R. S. Anderson, S. P. Anderson, and P. J. Reimer. 2006. A 1500-year record of temperature and glacial response inferred from varved Iceberg Lake, southcentral Alaska. Quaternary Research 66 (1):12–24. doi:10.1016/j.yqres.2005.11.007.
- Luoto, T. P., and S. Helama. 2010. Palaeoclimatological and palaeolimnological records from fossil midges and tree-rings: The role of the North Atlantic Oscillation in eastern Finland through the Medieval Climate Anomaly and Little Ice Age. Quaternary Science Reviews 29 (17–18):2411–23. doi:10.1016/J.QUASCIREV.2010.06.015.
- MacDonald, G. M., D. F. Porinchu, N. Rolland, K. V. Kremenetsky, and D. S. Kaufman. 2009. Paleolimnological evidence of the response of the central Canadian treeline zone to radiative forcing and hemispheric patterns of temperature change over the past 2000 years. Journal of Paleolimnology 41 (1):129–41. doi:10.1007/s10933-008-9250-2.
- MacDonald, G. M., R. P. Beukens, and W. E. Kieser. 1991. Radiocarbon dating of limnic sediments: A comparative analysis and discussion. Ecology 72 (3):1150–55. doi:10.2307/1940612.
- Massa, C., B. B. Perren, E. Gauthier, V. Bichet, C. Petit, and H. Richard. 2012. A multiproxy evaluation of Holocene environmental change from Lake Igaliku, South Greenland. Journal of Paleolimnology 48 (1):241–58. doi:10.1007/s10933-012-9594-5.
- Masson‐Delmotte, V., A. Landais, M. Stievenard, O. Cattani, S. Falourd, J. Jouzel, S. J. Johnsen, D. Dahl‐Jensen, A. Sveinsbjornsdottir, J. W. C. White, and T. Popp. 2005. Holocene climatic changes in Greenland: Different deuterium excess signals at Greenland Ice Core Project (GRIP) and NorthGRIP. Journal of Geophysical Research: Atmospheres 110 (D14). doi:10.1029/2004JD0055750.
- McKay, N. P., and D. S. Kaufman. 2014. An extended Arctic proxy temperature database for the past 2,000 years. Scientific Data 1:140026. doi:10.1038/sdata.2014.26.
- Miller, G. H., J. Brigham-Grette, R. B. Alley, L. Anderson, H. A. Bauch, M. S. V. Douglas, M. E. Edwards, S. A. Elias, B. P. Finney, J. J. Fitzpatrick, et al. 2010. Temperature and precipitation history of the Arctic. Quaternary Science Reviews 29 (15–16):1679–715. doi:10.1016/j.quascirev.2010.03.001.
- Moore, J. J., K. A. Hughen, G. H. Miller, and J. T. Overpeck. 2001. Little Ice Age recorded in summer temperature reconstruction from vared sediments of Donard Lake, Baffin Island, Canada. Journal of Paleolimnology 25 (4):503–17. doi:10.1023/A:1011181301514.
- Myers-Smith, I. H., B. C. Forbes, M. Wilmking, M. Hallinger, T. Lantz, D. Blok, K. D. Tape, M. Macias-Fauria, U. Sass-Klaassen, E. Lévesque, et al. 2011. Shrub expansion in tundra ecosystems: Dynamics, impacts and research priorities. Environmental Research Letters 6 (4):45509. doi:10.1088/1748-9326/6/4/045509.
- Nicolle, M., M. Debret, N. Massei, C. Christophe, D. Divine, J. P. Werner, A. Hormes, A. Korhola, and H. W. Linderholm. 2018. Climate variability in the subarctic area for the last 2 millennia. Climate of the Past 14 (1):101. doi:10.5194/cp-14-101-2018.
- Oksanen, J., F. G. Blanchet, M. Friendly, R. Kindt, P. Legendre, D. McGlinn, P. R. Minchin, et al. 2018. Package ‘vegan’. Community Ecology Package, Version 2.5-3.https://CRAN.R-project.org/package=vegan
- Overpeck, J., K. Hughen, D. Hardy, R. Bradley, R. Case, M. Douglas, B. Finney, K. Gajewski, G. Jacoby, A. Jennings, et al. 1997. Arctic environmental change of the last four centuries. Science 278 (5341):1251–56. doi:10.1126/science.278.5341.1251.
- Overpeck, J., T. Webb, and I. C. Prentice. 1985. Quantitative interpretation of fossil pollen spectra: Dissimilarity coefficients and the method of modern analogs. Quaternary Research 23 (1):87–108. doi:10.1016/0033-5894(85)90074-2.
- Parsons, T., Y. Maita, and C. M. Lalli. 1984. A manual of chemical & biological methods for seawater analysis. Willowdale, ON: Pergamon Press.
- Paull, T. M., S. A. Finkelstein, and K. Gajewski. 2017. Interactions between climate and landscape drive Holocene ecological change in a High Arctic lake on Somerset Island, Nunavut, Canada. Arctic Science 3 (1):17–38. doi:10.1139/as-2016-0013.
- Peros, M., and K. Gajewski. 2009. Pollen-based reconstructions of late Holocene climate from the central and western Canadian Arctic. Journal of Paleolimnology 41 (1):161–75. doi:10.1007/s10933-008-9256-9.
- Philippsen, B. 2013. The freshwater reservoir effect in radiocarbon dating. Heritage Science 1 (1):24. doi:10.1186/2050-7445-1-24.
- Porinchu, D. F., G. M. MacDonald, and N. Rolland. 2009. A 2000 year midge-based paleotemperature reconstruction from the Canadian Arctic archipelago. Journal of Paleolimnology 41 (1):177–88. doi:10.1007/s10933-008-9263-x.
- Post, E., M. C. Forchhammer, M. S. Bret-Harte, T. V. Callaghan, T. R. Christensen, B. Elberling, A. D. Fox, A. Gilg, D. S. Hik, T. T. Høye, et al. 2009. Ecological dynamics across the arctic associated with recent climate change. Science 325 (5946):1355–58. doi:10.1126/science.1173113.
- R Core Team. 2018. R: A language and environment for statistical computing. Vienna, Austria: R Foundation for Statistical Computing. https://www.R-project.org/.
- Reimer, P. J., E. Bard, A. Bayliss, J. W. Beck, P. G. Blackwell, C. B. Ramsey, C. E. Buck, H. Cheng, R. L. Edwards, M. Friedrich, et al. 2013. IntCal13 and Marine13 radiocarbon age calibration curves 0–50,000 years cal BP. Radiocarbon 55 (4):1869–87. doi:10.2458/azu_js_rc.55.16947.
- Rolland, N., I. Larocque, P. Francus, R. Pienitz, and L. Laperrière. 2009. Evidence for a warmer period during the 12th and 13th centuries AD from chironomid assemblages in Southampton Island, Nunavut, Canada. Quaternary Research 72 (1):27–37. doi:10.1016/j.yqres.2009.03.001.
- Ryves, D. B., R. W. Battarbee, S. Juggins, S. C. Fritz, and N. J. Anderson. 2006. Physical and chemical predictors of diatom dissolution in freshwater and saline lake sediments in North America and West Greenland. Limnology and Oceanography 51 (3):1355–68. doi:10.4319/lo.2006.51.3.1355.
- Sawada, M. 2006. An open source implementation of the Modern Analog Technique (MAT) within the R computing environment. Computers & Geosciences 32 (6):818–33. doi:10.1016/J.CAGEO.2005.10.008.
- Schwager, M. 2000. Ice core analysis on the spatial and temporal variability of temperature and precipitation during the late Holocene in North Greenland. Reports on Polar Research 362:1–136. doi:10.2312/BzP_0362_2000.
- Sejrup, H. P., H. Haflidason, and J. T. Andrews. 2011. A Holocene North Atlantic SST record and regional climate variability. Quaternary Science Reviews 30 (21–22):3181–95. doi:10.1016/J.QUASCIREV.2011.07.025.
- Shi, F., B. Yang, F. C. Ljungqvist, and F. Yang. 2012. Multi-proxy reconstruction of Arctic summer temperatures over the past 1400 years. Climate Research 54 (2):113–28. doi:10.3354/cr01112.
- Sicre, M., I. R. Hall, J. Mignot, M. Khodri, U. Ezat, M. Truong, J. Eiríksson, and K. Knudsen. 2011. Sea surface temperature variability in the subpolar Atlantic over the last two millennia. Paleoceanography 26:4. doi:10.1029/2011PA002169.
- Sigl, M., M. Winstrup, J. R. McConnell, K. C. Welten, G. Plunkett, F. Ludlow, U. Büntgen, M. Caffee, N. Chellman, D. Dahl-Jensen, et al. 2015. Timing and climate forcing of volcanic eruptions for the past 2,500 years. Nature 523:543–49. doi:10.1038/nature14565.
- Snyder, J. A., G. H. Miller, A. Werner, A. J. T. Jull, and T. W. Stafford. 1994. AMS-radiocarbon dating of organic-poor lake sediment, an example from Linnévatnet, Spitsbergen, Svalbard. The Holocene 4 (4):413–21. doi:10.1177/095968369400400409.
- Spielhagen, R. F., K. Werner, S. A. Sørensen, K. Zamelczyk, E. Kandiano, G. Budeus, K. Husum, T. M. Marchitto, and M. Hald. 2011. Enhanced modern heat transfer to the Arctic by warm Atlantic water. Science 331 (6016):450–53. doi:10.1126/science.1197397.
- Tamo, C. (2019). Late Holocene environmental change across the Canadian Arctic. MSc Thesis, Université d’Ottawa/University of Ottawa, Ottawa, Canada.
- Tape, K., M. Sturm, and C. Racine. 2006. The evidence for shrub expansion in Northern Alaska and the Pan-Arctic. Global Change Biology 12 (4):686–702. doi:10.1111/j.1365-2486.2006.01128.x.
- Thomas, E. K., and J. P. Briner. 2009. Climate of the past millennium inferred from varved proglacial lake sediments on northeast Baffin Island, Arctic Canada. Journal of Paleolimnology 41 (1):209–24. doi:10.1007/s10933-008-9258-7.
- Tingley, M. P., and P. Huybers. 2013. Recent temperature extremes at high northern latitudes unprecedented in the past 600 years. Nature 496:201. doi:10.1038/nature12050.
- Trouet, V., J. Esper, N. E. Graham, A. Baker, J. D. Scourse, and D. C. Frank. 2009. Persistent positive North Atlantic Oscillation mode dominated the medieval climate anomaly. Science 324 (5923):78–80. doi:10.1126/science.1166349.
- Vinther, B. M., H. B. Clausen, D. A. Fisher, R. M. Koerner, S. J. Johnsen, K. K. Andersen, D. Dahl‐Jensen, S. O. Rasmussen, J. P. Steffensen, and A. M. Svensson. 2008. Synchronizing ice cores from the Renland and Agassiz ice caps to the Greenland Ice Core Chronology. Journal of Geophysical Research: Atmospheres 113:D8. doi:10.1029/2007JD009143.
- Vinther, B. M., H. B. Clausen, S. J. Johnsen, S. O. Rasmussen, K. K. Andersen, S. L. Buchardt, D. Dahl‐Jensen, I. K. Seierstad, M.‐L. Siggaard‐Andersen, J. P. Steffensen, et al. 2006. A synchronized dating of three Greenland ice cores throughout the Holocene. Journal of Geophysical Research: Atmospheres 111:D13. doi:10.1029/2005JD006921.
- Vinther, B. M., P. D. Jones, K. R. Briffa, H. B. Clausen, K. K. Andersen, D. Dahl-Jensen, and S. J. Johnsen. 2010. Climatic signals in multiple highly resolved stable isotope records from Greenland. Quaternary Science Reviews 29 (3–4):522–38. doi:10.1016/j.quascirev.2009.11.002.
- Walker, D. A., W. A. Gould, H. A. Maier, and M. K. Raynolds. 2002. The Circumpolar Arctic Vegetation Map: AVHRR-derived base maps, environmental controls, and integrated mapping procedures. International Journal of Remote Sensing 23 (21):4551–70. doi:10.1080/01431160110113854.
- Werner, J. P., D. V. Divine, F. C. Ljungqvist, T. Nilsen, and P. Francus. 2018. Spatio-temporal variability of Arctic summer temperatures over the past 2 millennia. Climate of the Past 14 (4):527. doi:10.5194/cp-14-527-2018.
- Werner, M., M. Heimann, and G. Hoffmann. 2001. Isotopic composition and origin of polar precipitation in present and glacial climate simulations. Tellus B: Chemical and Physical Meteorology 53 (1):53–71. doi:10.3402/tellusb.v53i1.16539.
- Whitmore, J., K. Gajewski, M. Sawada, J. W. Williams, B. Shuman, P. J. Bartlein, T. Minckley, A. E. Viau, T. Webb III, S. Shafer, et al. 2005. Modern pollen data from North America and Greenland for multi-scale paleoenvironmental applications. Quaternary Science Reviews 24 (16–17):1828–48. doi:10.1016/J.QUASCIREV.2005.03.005.
- Wiles, G. C., R. D. D’Arrigo, D. Barclay, R. S. Wilson, S. K. Jarvis, L. Vargo, and D. Frank. 2014. Surface air temperature variability reconstructed with tree rings for the Gulf of Alaska over the past 1200 years. The Holocene 24 (2):198–208. doi:10.1177/0959683613516815.
- Xing, P., X. Chen, Y. Luo, S. Nie, Z. Zhao, J. Huang, and S. Wang. 2016. The extratropical northern hemisphere temperature reconstruction during the last millennium based on a novel method. PloS One 11 (1):e0146776. doi:10.1371/journal.pone.0146776.
- Zabenskie, S., and K. Gajewski. 2007. Post-glacial climatic change on boothia peninsula, Nunavut, Canada. Quaternary Research 68 (2):261–70. doi:10.1016/j.yqres.2007.04.003.
- Zabenskie, S., M. Peros, and K. Gajewski. 2006. The use of heavy-liquid in the separation of pollen from Arctic lake sediments. Canadian Association of Palynologists 29:5–7.
- Zhou, A., Y. He, D. Wu, X. Zhang, C. Zhang, Z. Liu, and J. Yu. 2015. Changes in the radiocarbon reservoir age in Lake Xingyun, Southwestern China during the Holocene. PloS One 10 (3):e0121532. doi:10.1371/journal.pone.0121532.
APPENDIX
Table A1. List of reconstructions included in the synthesis study. Sites in bold are included in both PCA1 (1090–1960 CE) and PCA2 (10–1960 CE).