
ABSTRACT
Understanding the Tibetan Plateau’s role in environmental change has gained increasing scientific attention in light of warming and changes in land management. We examine changes in greenness over the Tibetan Plateau using the Normalized Difference Vegetation Index (NDVI) from the Global Inventory Monitoring and Modeling Study (GIMMS3g) to identify significant changes over the entire plateau, six ecoregions, and protected areas based on a multiyear time series of July imagery from 1982 to 2015. We also test whether there have been changes in human populations in protected areas. There has been relatively little change in mean NDVI over the Tibetan Plateau or ecoregions, however, there were significant changes at the pixel level. There are sixty-nine protected areas on the Tibetan Plateau; sixty-two protected areas had no significant change in mean NDVI and seven protected areas experienced a significant increase in NDVI. There has been an increase in population within protected areas from 2000 to 2015; however, mean populations significantly increased in two protected areas and significantly decreased in four protected areas. Results suggest a slow greening of the Tibetan Plateau, ecoregions, and protected areas, with a more rapid greening in northern Tibet at the pixel level. Most protected areas are experiencing minor changes in NDVI independent of human population.
Introduction
In the twenty-first century, understanding the Tibetan Plateau’s role in the global climate and environmental change has gained increasing scientific attention in light of global warming (Cui and Graf Citation2009; Zhu et al. Citation2016). Recently, the Chinese government has created a number of protected areas on the Tibetan Plateau, with some of the world’s largest protected areas created on the Tibetan Plateau since 2000 (Tang et al. Citation2006; UNEP-WCMC and IUCN Citation2018). Indeed, the three protected areas of Qiangtang (321,252 km2), Sanjinangyuan (303,608 km2), and Kekexili (49,532 km2) combine to cover an area larger than France. However, relatively little is known about the impacts of climate change on protected areas of the Tibetan Plateau or the impacts of humans (Buckley, Zhou, and Zhong Citation2016; Huang et al. Citation2016).
Since 2001, a number of studies have noted that there has been a significant warming trend over the Tibetan Plateau, and this may have impacted the productivity of vegetation on the Tibetan Plateau (Wang et al. Citation2008; Peng et al. Citation2012; Zhu et al. Citation2016). Weather stations indicate that since the 1960s, temperature has increased by about 1.8°C over the Tibetan Plateau and rainfall has generally increased over the eastern section of the plateau (Wang et al. Citation2008; Sun et al. Citation2013). Climatic changes have been hypothesized as the cause of increased greening of the Qinghai–Tibet Plateau (Sun et al. Citation2013; Zhu et al. Citation2016). Vegetation change has been monitored from the Moderate Resolution Imaging Spectroradiometer (MODIS) and Advanced Very High Resolution Radiometer (AVHRR) sensors using the Normalized Difference Vegetation Index (NDVI), which is calculated as a function of the visible and near-infrared wavelengths. NDVI ranges from 1.0 to −1.0 with positive values (e.g., 0.5) representing high greenness or photosynthetic activity and negative values (e.g., −0.1) representing no vegetation or snow. From 1982 to 2003, annual greenness based on NDVI from AVHRR showed increases on the Tibetan Plateau, especially for shrublands, meadows, grasslands, and deserts (Peng et al. Citation2012). AVHRR and MODIS have also shown decreasing greenness during the growing season from 2000 to 2010, especially in the southwest area of the plateau (Shen et al. Citation2015), and this does not suggest a simple linear greening trend. However, changes in NDVI from these studies have been small (e.g., 0.05), and this may be due to time series analyses that inherently normalize large amounts of remote sensing data over the course of a year or a defined growing season (Peng et al. Citation2012; Shen et al. Citation2015). Alternatively, an assessment of a select time period during times of peak phenology and low snow and cloud cover might provide a more meaningful comparative assessment of change.
Protected areas are widely regarded as one of the most successful measures implemented for the conservation of biodiversity, drawing upon traditional and community-based approaches, governance regimes, scientific and traditional knowledge, and contemporary practices of governments and conservation agencies (IUCN Citation2014; Gillespie, Willis, and Ostermann-Kelm Citation2015). Since the 1980s, China has made great strides in developing their protected areas network from less than 200 designated nature reserves in 1982 to 745 internationally recognized protected areas in 2018 that covered 17 percent of China’s land surface (Cao, Peng, and Liu Citation2015; UNEP-WCMC and IUCN Citation2018). Indeed, this exponential growth in the number and size of protected areas has clearly met the Aichi Biodiversity Targets goals of 17 percent coverage of terrestrial protected areas by 2020 set forth in the 2010 Convention on Biological Diversity (Convention on Biological Diversity Citation2010; Xu et al. Citation2017). A majority of China’s protected areas correspond to the International Union for Conservation of Nature (IUCN) level V (Protected Landscape/Seascape), defined as a protected area where the interaction of people and nature over time has produced an area of distinct character with significant ecological, biological, cultural, and scenic value and where safeguarding the integrity of this interaction is vital to protecting and sustaining the area and its associated nature conservation and other values (UNEP-WCMC and IUCN Citation2018). Most of China’s largest and pristine protected areas or protected areas with low human impact are located on the Tibetan Plateau, yet there is still debate concerning how well managed these protected areas are (Buckley, Zhou, and Zhong Citation2016). Within the Chinese protected area network, Cao, Peng, and Liu (Citation2015) described the inefficiency and inconsistency in how protected areas are managed. Different government sectors across all levels are involved in management, but there is no unified, clear law for how to regulate and implement policy or who is supposed to take responsibility, thus resulting in no clear system of conservation or regulation. Currently there is increasing interest in assessing and strengthening China’s protected areas (Xu et al. Citation2017).
Tibetan hunter-gatherers have been present on the plateau for over 7,000 years, and nomads have been raising livestock on the Tibetan Plateau for 3,000 years (Meyer et al. Citation2017). In recent decades, the Tibetan grasslands have been hypothesized to be experiencing deterioration, attributed to overgrazing by domestic livestock (Du Citation2010; Ouyang et al. Citation2016). Over the last 10 years, China has imposed strict limits on livestock numbers and moved nearly 100,000 nomads off their land to newly built urban centers to improve the grassland health (Qiu Citation2016). Many protected areas in China incorporate core and buffer zones, with humans permitted only in the buffer (Buckley, Zhou, and Zhong Citation2016). It has been suggested that this may be occurring in protected areas with an IUCN category V rating, where the interaction of people and nature is permitted on the Tibetan Plateau (Buckley, Zhou, and Zhong Citation2016). However, few studies have examined changes in population in protected areas and the impacts of population on these protected areas (Du Citation2012; Buckley, Zhou, and Zhong Citation2016).
Remote sensing methods, especially in combination with geographic information systems (GIS), are effective techniques for measuring regional and landscape-level temporal changes over large continuous areas such as the Tibetan Plateau. Remote sensing has been used to map changes in land cover type as well as landscape types and vegetation classes and is often the primary tool for monitoring landscape changes in protected areas (Fraser, Olthof, and Pouliot Citation2009; Gillespie, Willis, and Ostermann-Kelm Citation2015). NDVI represents photosynthetic activity and is associated with biomass, carbon sequestration, plant water stress, and biodiversity (Nagendra et al. Citation2013; Pettorelli Citation2013). Pettorelli et al. (Citation2012) suggested that the NDVI of protected areas, which are generally less impacted by human activities, can be used to track the effect of climate change on natural ecosystem functioning. There have been an increasing number of studies that have used NDVI to study ecosystem dynamics and disturbance within protected areas; however, this has not been undertaken for protected areas on the Tibetan Plateau (Alcaraz-Segura et al. Citation2008; Gillespie, Willis, and Ostermann-Kelm Citation2015).
This research on the Tibetan Plateau has three primary research questions. First, has there been a significant increase in greening on the Tibetan Plateau and ecoregions from 1982 to 2015 based on summer imagery? We expect that there has been a significant increase in greenness across the Tibetan Plateau. Second, has there been a significant increase in greenness within protected areas? Given the protected status of newly formed protected areas since 2001, we would expect greenness to remain constant or possibly increase from 1982 to 2015 based on summer imagery. Third, have there been significant changes in human population in protected areas and, if so, are they related to changes of greening in these protected areas? We would expect that population has remained stable in protected areas since 2001, and protected areas where the population has increased should have a negative impact on greenness, whereas protected areas where population has declined should experience an increase in greenness.
Methods
Study areas
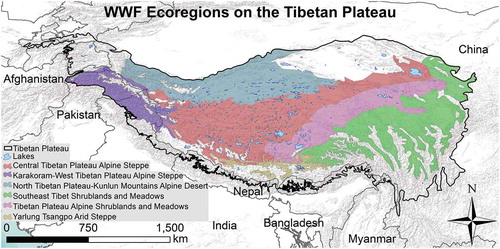
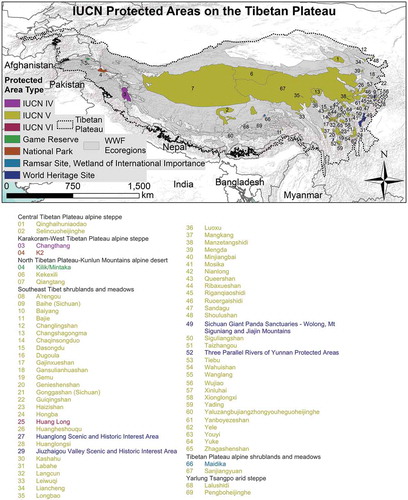
The Tibetan Plateau consists of six main ecoregions: Karakoram–West Tibetan Plateau alpine steppe, Central Tibetan Plateau alpine steppe, Tibetan Plateau alpine shrublands and meadows, Southeast Tibet shrublands and meadows, and North Tibetan Plateau–Kunlun mountains alpine desert, and the Yarlung Zambo arid steppe (Olson et al. Citation2001; ). The Tibetan Plateau contains the highest alpine endemic plant diversity in the world (Yu et al. Citation2018). The vegetation on the Tibetan Plateau is dominated by steppe (23 percent), shrub (20 percent), desert (20 percent), meadow (18 percent), forest (9 percent), barren areas (9 percent; e.g., bare rock and glacier), and water bodies (1 percent, mainly plateau lakes; Peng et al. Citation2012). There are 745 protected areas covering 1.6 million km2 in China and there are sixty-nine terrestrial protected areas in the six main ecoregions on the Tibetan Plateau (UNEP-WCMC and IUCN Citation2018). Most inhabitants live in the eastern and southern sections of the Tibetan Plateau. Nomads live in the central section and few people reside in the high deserts.
Figure 1. Six World Wildlife Fund (WWF) Ecoregions and 3,000-m contours on the Tibetan Plateau.
GIS data
We used 3,000-m elevation from the Shuttle Radar Topography Mission (SRTM version 4) to define the Tibetan Plateau and World Wildlife Fund (WWF) Ecoregions to study regional greening on the Tibetan Plateau (Olson et al. Citation2001; Jarvis et al. Citation2008). An ecoregion is defined as a relatively large unit of land containing a distinct assemblage of natural communities sharing a large majority of species, dynamics, and environmental conditions (Olson et al. Citation2001). We used six main ecoregions within the Tibetan Plateau. Protected area polygons were collected from Protected Planet (UNEP-WCMC and IUCN Citation2018). Data on protected areas included protected area name, IUCN classification, boundaries, and area estimates. We quantified the number of protected areas in each of the six ecoregions (). Population density and distribution data were collected from 2000 to 2015 from LandScan. Available annually since 2000 at a resolution of 1 km × 1 km, LandScan global population provided the finest ambient population data (average population over 24 hours) based on a model incorporating census data, administrative boundary, land cover from Landsat, roads, slope, and nighttime lights (Dobson et al. Citation2000; Bhaduri et al. Citation2007). It overcomes the limitation of spatial resolution and temporal availability of census data, thus providing the best population measurement for a regression model across multiple years and a large spatial extent.
Figure 2. Sixty-nine terrestrial protected areas on the Tibetan Plateau.
Remote sensing
We used time series data on NDVI from the Global Inventory Monitoring and Modeling Study (GIMMS3g.v1) to explore changes in greenness on the Tibetan Plateau, ecoregions, and protected areas. GIMMS3g.v1 data from 1982 to 2015 were acquired from the Global Land Cover Facility. This provided 8 km × 8 km pixel resolution on NDVI from resampled AVHRR imagery (Tucker et al. Citation2005; GIMMS Citation2018). Summer imagery (June, July, August) was examined to identify dates with little to no cloud cover over the study region for the entirety of the time series. A 2-week time period (15 July to 30 July) was identified as the span with the least cloud cover over Tibet for the GIMMS3g data set.
Data analysis
We used composite imagery to identify whether there have been significant changes in NDVI from GIMMS3g at an aggregate level (mean Tibetan Plateau and ecoregions) as well as at the pixel level over both the Tibet Plateau (i.e., above 3,000 m) and its six ecoregions using a linear regression model. We quantified the number of protected areas within each ecoregion and included only terrestrial protected areas and removed protected areas that were primarily lakes from the analysis (e.g., Eling Lake, Zhaling Lake). If reserve boundaries were within two or more ecoregions, we classified the protected areas based on the ecoregion with the largest area within the protected area. We calculated the area in square kilometers of each protected area based on the GIS boundaries from Protected Planet (UNEP-WCMC and IUCN Citation2018). We examined changes in NDVI from GIMMS3g in protected areas to identify whether there have been significant changes in NDVI at both an aggregate level (mean NDVI for protected areas) and at the pixel level over time. Linear regressions were used to identify whether protected areas experienced a significant (p < .05) increase or decrease in greenness (Appendix 1). A population density time series of LandScan data from 2000 to 2015 was examined to determine whether there were significant changes (p < .05) in population in these protected areas at both an aggregate level (mean population for protected areas) and at the pixel level (population per 1 km × 1 km pixel resolution). Trends were determined using linear regressions between years and total population within each protected area. We used a Pearson correlation to identify whether changes in mean NDVI were correlated with changes in mean human population from 2000 to 2015. We also identify whether there were correlations between the number of NDVI pixels that significantly decreased within protected areas and the number of LandScan pixels that significantly increased within protected areas.
Results
NDVI over the Tibetan Plateau and ecoregions
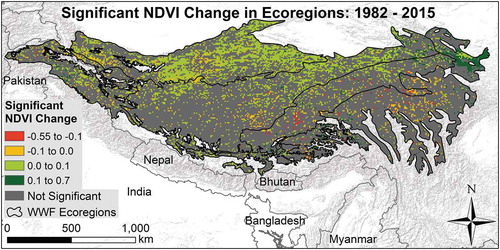
There was relatively little change in NDVI over the entire Tibetan Plateau from 1982 to 2015 (mean 0.018) during July (). There were also no significant changes in mean NDVI over ecoregions based on GIMMS3g.v1. In general, there were small increases in mean NDVI (e.g., 0.03) but these were not statistically significant (). At an 8 km × 8 km pixel resolution, 76 percent of the Tibetan Plateau experienced no significant change in NDVI from 1982 to 2015, 19 percent of pixels experienced a significant increase, and 5 percent of pixels had a significant decrease in NDVI (). There were significant increases in NDVI ranging from 12 percent to 40 percent at the pixel level within ecoregions, with the North Tibetan Plateau–Kunlun mountains alpine desert having the greatest increase in greening (40 percent of ecoregion; ). All ecoregions experienced between a 3 percent to 8 percent decrease in NDVI at the pixel level, with the Southeast Tibet shrublands and meadows having the greater significant decrease in NDVI over a 25,600-km2 area.
Table 1. Changes in NDVI using summer AVHRR imagery (15 July to 30 July) from GIMMS3g over the Tibetan Plateau (above 3,000 m) from 1982 to 2015.
Table 2. Changes in NDVI over six ecoregions on the Tibetan Plateau using summer AVHRR imagery (15 July to 30 July) from 1982, 2000, and 2015. Mean and SD of NDVI and number of pixels with no significant change in NDVI, number of pixels with significant increase in NDVI, and number of pixels with significant decrease from 1982 to 2015.
Figure 3. Changes in NDVI using AVHRR from GIMMS3g between 1982 and 2015 over the Tibetan Plateau and ecoregions.
Protected areas and NDVI
There were sixty-nine protected areas within the six ecoregions, which range in size from 20 km2 to 321,252 km2 (). The Southeast Tibet shrublands and meadows ecoregion had the most protected areas (fifty-seven), followed by Tibetan Plateau alpine shrublands and meadows (three), Karakoram–West Tibetan Plateau alpine steppe (three), Central Tibetan Plateau alpine steppe (two), North Tibetan Plateau–Kunlun mountains alpine desert (two), and the Yarlung Zambo arid steppe (two). There has been a significant increase in mean NDVI within seven protected areas and no significant change in sixty-two protected areas on the Tibetan Plateau from 1982 to 2015 (, ). Two of the three largest protected areas, Kekexili and Qiangtang, experienced a significant increase in NDVI (p < .001), whereas Sanjinangyuan did not experience significant changes in NDVI (p = .633).
Table 3. Protected areas on the Tibetan Plateau with area from Protected Planet GIS polygons, NDVI values in summer 1982 and 2015 from AVHRR imagery from GIMMS3g, protected areas that have had a significant change in NDVI from 1982 to 2015, mean population in protected areas from LandScan in 2015 and significant change in population 2000 to 2015.
Figure 4. Changes in NDVI using AVHRR from GIMMS3g between 1982 and 2015 in protected areas.
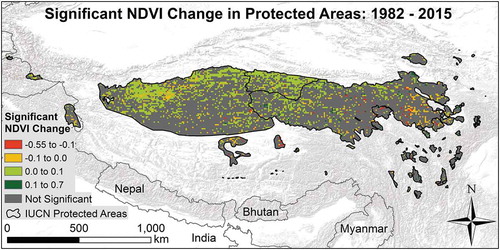
At the pixel level, there were thirty-four protected areas that had no significant change in NDVI (e.g., no significant increase or decrease). There were twenty-two protected areas with a higher proportion of pixels significantly increasing in NDVI compared to decreasing in NDVI and eight protected areas with a higher proportion of pixels decreasing in NDVI than increasing in NDVI (). There were seven protected areas (Gansulianhuashan, Kekexili, Mengda, Wanglang, Maidika, Qiangtang, K2) that had a significant increase in NDVI of 20 percent or greater at the pixel level and one small protected area (Wahuishan) that had a decrease of 20 percent ().
Protected areas and population
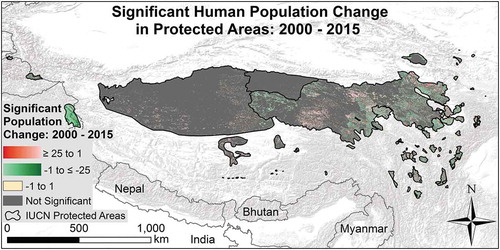
People live in all protected areas on the Tibetan Plateau according to LandScan (). Population changed from 1,232,605 to 1,333,830 people within protected areas from 2000 to 2015 on the Tibetan Plateau. The largest protected areas, Sanjiangyuan National Natural Reserve and Qiangtang, experienced an increase of 270,013 and 41,123 inhabitants respectively according to LandScan data. In contrast, Changthang (−187,921), Liancheng (−16,556), Kekexili (−13,167), and the Sichuan Giant Panda Sanctuaries (−9,283) accounted for the largest population decreases from 2000 to 2015 (Appendix 1). There was no significant change in mean population in sixty-two protected areas, a significant increase in two protected areas (Lalushidi, Shoulushan), and a significant decrease in four protected areas (Changthang, Labahe, Liancheng, Yele; ). At the pixel level, there was a high degree of heterogeneity in the population change within Tibetan protected areas (). There was no correlation (r = −0.014, p > .05) between overall changes in mean NDVI and changes in mean population within the protected areas from 2000 to 2015. There were twenty-four protected areas that contained pixels that significantly decreased in NDVI from 1982 to 2015 (). There was a significant correlation between number of pixels that significantly declined in NDVI and the number of pixels that significantly increased in population from 2000 to 2015 (r = 0.983, p < .001), suggesting that increases in population resulted in decreases in NDVI in these twenty-four protected areas. There were thirty-two protected areas that contained pixels that significantly increased in NDVI from 1982 to 2015. There was no correlation between number of pixels that significantly increased in NDVI and the number of pixels that significantly decreased in population from 2000 to 2015 (r = 0.391, p > .05), suggesting that increases in NDVI were not associated with declines in population in these thirty-two protected areas.
Figure 5. Changes in human population from LandScan inside sixty-nine protected areas on the Tibetan Plateau from 2000 to 2015. The color ramp indicates a significant increase or decrease in population from 2000 to 2015 per 1-km LandScan pixel. Grey areas indicate no significant changes.
Discussion
Tibetan Plateau and ecoregions
Evidence gleaned from satellite observations, long-term ecological stations, and modeling work shows an increase in vegetation growth over the Tibetan Plateau for the last 3 decades (e.g., Zhang et al. Citation2013; Shen et al. Citation2015). This increase in vegetation growth denoted by NDVI or leaf area index is mainly attributed to the warming effect of climate change (Zhu et al. Citation2016) and increases in annual precipitation (Sun et al. Citation2013). Our results using NDVI from the GIMMS3g data set during July also show a general increase in greenness; however, results were not significant when using means from summer imagery. There was also a minor increase in mean NDVI from 1982 to 2015 from the GIMMS3g data set for all six ecoregions, but changes in mean NDVI during the July time period were small (e.g., <0.03) and were not statistically significant. However, at the pixel level, there appears to be significant greening in northern Tibet and no change or significant decreases in NDVI in southeast Tibet. This is different from the results of Shen et al. (Citation2015), who reported only minor changes in NDVI from 1982 to 2010 for northern Tibet. They also showed decreasing greenness using AVHRR NDVI during the growing season from 2000 to 2010 in southwestern Tibet, whereas we found no significant changes in NDVI in the southwestern Tibet from 1982 to 2015. Their results are similar to ours at the pixel level for the Central Tibetan Plateau alpine steppes and Tibetan Plateau alpine shrubland and meadow ecoregion. This suggests that the Tibetan Plateau is greening at a gradual pace during July and there have not been radical changes in mean greenness during this time period. However, there are significant increases in greenness at the pixel level in northern Tibet, possibly due to increases in temperature and precipitation, and no change or significant decreases in greenness in southeastern Tibet.
Protected areas and NDVI
The sixty-nine protected areas on the Tibetan Plateau account for 50.3 percent of the terrestrial area of protected areas in China. None of the protected areas experienced a significant decline in mean NDVI, and most of the protected areas on the Tibetan Plateau (90 percent) have not experienced significant changes in mean greenness since 1982. This stable trend should be viewed as positive from a management and conservation perspective (Pettorelli et al. Citation2012). Protected areas where there was a significant NDVI increase at the pixel level were primarily in the three largest protected areas, with Kekexili experiencing the largest increase in NDVI, suggesting an increase in vegetation growth (Pettorelli et al. Citation2012). Summaries of NDVI values and changes over time are an important first step in assessing protected areas on the Tibetan Plateau (e.g., , Appendix 1). NDVI values for protected areas and individual pixels provide information on dominant vegetation types such as barren areas (−0.01 to 0.01), deserts (0.06 to 0.0.08), steppes (0.14 to 0.17), meadows (0.23 to 0.26), and forests (>0.37; Peng et al. Citation2012). More important, individual pixels within each of the sixty-nine protected areas can be examined within Google Earth to identify areas that significantly increased or decreased in NDVI at an 8-km pixel resolution from 1982 to 2015 (Appendix 2). For instance, significant decreases in NDVI at the pixel level in Selincuoheijinghe protected areas appear to be associated with increased impervious surface area such as the new G109 highway. These time series data sets can be used by natural resource managers in China and the international community to identify areas that experienced significant declines over time.
Protected areas and population
People live in all of the protected areas on the Tibetan Plateau. Indeed, as of 2015 LandScan estimates that there are over 1.3 million people living within protected areas on the Tibetan Plateau and there has been an 8 percent increase since 2000. However, we know of no studies that compare LandScan in Tibet with other population estimates for the same time period, and most population mapping has been undertaken using data sets from before 2001 (Tian et al. Citation2005; Zhuo et al. Citation2009). According to LandScan ambient population estimates, there were 16,633,871 inhabitants in 2000 and 18,125,591 inhabitants in 2015 (Appendix 3). These population estimates seem high compared to estimates of 3.8 million in Tibet and 5.83 million in Qinghai for 2014 (Deng, Wang, and Zhao Citation2016). Thus, it would appear that LandScan overestimates population on the Tibetan Plateau and caution should be taken when assessing the actual population and density. However, LandScan does appear to identify general trends in population at the aggregate and pixel levels. Populations increased in the largest protected areas of Qiangtang (+41,123) and Sanjiangyuan (+270,013) from 2000 to 2015, and although the actual numbers may not be accurate, the trends in population or percentage change may represent what is happening on the ground. For instance, Sanjiangyuan protected area, which is in the origin of three major rivers in East and Southeast Asia (Yangtze River, Yellow River, and Mekong River), was established in 2003. From 2003 to 2008, herding villages in Madoi County, a major part of the Sanjiangyuan protected area, were resettled to urban areas (Du Citation2012). According to the population change detected at the pixel level using LandScan, the population in this county decreased significantly by 2015, a trend reported in Du (Citation2012).
There were also decreases in population in protected areas, with Changthang (−187,921), Liancheng (−16,556), Kekexili (−13,167) and the Sichuan Giant Panda Sanctuaries (−9,283) having the largest decreases according to LandScan, and this suggests that the removal of inhabitants from these four protected areas was policy for natural resource protection within these protected areas. Changthang is a wildlife sanctuary in India that was created to protect regional biodiversity, including alpine wetlands and the endangered snow leopard (Panthera uncia; Kala Citation2005; Bagchi and Mishra Citation2006). Since the beginning of the twenty-first century, central and local governments in China have made efforts to protect the endangered Tibetan antelope (Pantholops hodgsonii) in Kekexili and the giant panda (Ailuropoda melanoleuca) in the Sichuan Giant Panda Sanctuaries. Thus, it appears that declines in human population may be associated with areas that contain endangered and charismatic large mammals.
Management of protected areas on the Tibetan Plateau
There is increasing interest in assessing and strengthening China’s protected areas (Cao, Peng, and Liu Citation2015; Xu et al. Citation2017). Sixty of the protected areas on the Tibetan Plateau were classified as level V and four protected areas (Jiuzhaigou Valley Scenic and Historic Interest Area, Huanglong Scenic and Historic Interest Area, Three Parallel Rivers of Yunnan Protected Areas, and the Sichuan Giant Panda Sanctuaries–Wolong, Mount Siguniang and Jiajin Mountains) were classified as World Heritage Sites (UNEP-WCMC and IUCN Citation2018). All four World Heritage Sites had stable NDVI values or significantly increased in NDVI at the pixel level with the exception of a significant decrease in 2 percent of the pixels in the Giant Panda Sanctuaries. Level V Protected Landscape/Seascape is defined as a protected area where the interaction of people and nature over time has produced an area of distinct character with significant ecological, biological, cultural, and scenic value and where safeguarding the integrity of this interaction is vital to protecting and sustaining the area and its associated nature conservation and other values (UNEP-WCMC and IUCN Citation2018). By this definition, people are permitted in level V protected areas and overall appear to have a relatively low impact on greenness. Although LandScan appears to overestimate actual population, time series analyses and trends in population in protected areas suggest that there are different strategies to manage these protected areas on the Tibetan Plateau (Appendix 4). At the pixel level, declines in NDVI were associated with increase in population for twenty-four protected areas, but increases in NDVI were not associated with a decrease in population. We would expect that changes in population may be associated with changes in grazing intensity on grasslands and meadows and wood product extraction within forest ecosystems in southeastern Tibet. However, we do not have data on domestic animal numbers or change for the same time periods. There have been increases in population in the Southeastern Tibetan shrublands and meadows, Tibetan Plateau alpine shrublands and meadows, and Yarlung Zambo arid steppe (Appendix 3) and within the largest protected area of Sanjiangyuan. Thus, these areas should be monitored in the future to identify impacts of development, agriculture, mining, and grazing.
Future research
It is clear that China has taken a number of steps to protect natural resources and biodiversity on the Tibetan Plateau, especially as it relates to their three largest protected areas and World Heritage sites. Future monitoring should include time series changes in NDVI for each protected area using AVHRR, MODIS, and Visible Infrared Imaging Radiometer Suite (VIIRS) to assess greenness changes at different temporal scales (e.g., annually, growing season, and summer months such as July). Change detection using 30-m Landsat data from the 1980s to the present should help identify areas that have undergone significant changes at a higher spatial resolution. Huang et al. (Citation2016) used county-level data on livestock on the Tibetan Plateau, and this could provide further insight into changes in greenness and livestock impacts within protected areas. It should be noted that as of April 2019, China has changed their policy with the UNEP-WCMC and IUCN and no longer provides public access to protected areas in China (UNEP-WCMC and IUCN Citation2019). When countries provide updates to their protected area data set, they can choose to apply some restrictions on its use, and the UN Environment World Conservation Monitoring Centre (UNEP-WCMC) always complies with the decision of a country regarding the restriction chosen on a protected area data set. This policy change currently provides access to only two protected areas within our study area. Currently only Qinghai Hoh Xil, created 2017, in what was formally Sanjiangyuan protected areas, and Tibet Selincuo Wetlands, a Ramsar site or wetland of international importance created in 2018 in what was formally Selincuoheijinghe protected area, occur in our study area. China may now be gradually renaming some of its protected areas to achieve greater international recognition of its conservation efforts and perhaps improve its international marketing of nature-based tourism (Buckley, Zhou, and Zhong Citation2016). In the future, it would be interesting to see how NDVI, population, and management of these two protected areas compare to other protected areas on the Tibetan Plateau. Finally, the ethnicity of the populations in protected areas would be of interest. This would provide insight into the impacts of traditional Tibetans and novel land management techniques.
Conclusions
There has been relatively little change in mean NDVI over the Tibetan Plateau or ecoregions from 1982 to 2015; however, there have been significant increases (19 percent) and decreases (5 percent) at the pixel level in six ecoregions. Sixty-two protected areas had no significant change in mean NDVI from 1982 to 2015, seven protected areas experienced a significant increase in NDVI, and none experienced a significant decrease. However, there were significant differences at the pixel level, especially for the largest protected areas, with the Qiangtang and Kekexili protected areas containing a high number of pixels that significantly increased in greenness. The largest protected area of Sanjiangyuan significantly increased in greenness in the west and significantly decreased in greenness in the east. There has been a general increase in population within protected areas from 2000 to 2015 on the Tibetan Plateau. Population has significantly increased in two protected areas and significantly decreased in four protected areas, and sixty-two protected areas have had no significant change. LandScan data should be used with caution because they appear to overestimate the actual population on the ground, but they do appear to identify trends in population at the aggregate and pixel levels. Results suggest a slow greening of the Tibetan Plateau, ecoregions, and protected areas, with a more rapid greening in northern Tibet at the pixel level, and no change or significant decreases in greenness in southeastern Tibet. Protected areas with decreases in NDVI at the pixel level were associated with increases in human population density. However, most protected areas are experiencing minor changes in NDVI independent of human population.
Supplemental Material
Download Zip (5.8 MB)Acknowledgments
We thank Shenyue Jia for help with remote sensing analyses and Matt Zebrowski for help with graphics. We thank the subject editor, Lynn Resler, and two anonymous reviewers for suggestions and comments that significantly improved the article.
Disclosure statement
No potential conflict of interest was reported by the authors.
Supplementary material
Supplemental data for this article can be accessed on the publisher’s website.
Additional information
Funding
Related Research Data
References
- Alcaraz-Segura, D., J. Cabello, J. M. Paruelo, and M. Delibes. 2008. Trends in the surface vegetation dynamics of the national parks of Spain as observed by satellite sensors. Applied Vegetation Science 11:431–40. doi:10.3170/2008-7-18522.
- Bagchi, S., and C. Mishra. 2006. Living with large carnivores: Predation on livestock by the snow leopard (Uncia uncia). Journal of Zoology 268:217–24. doi:10.1111/j.1469-7998.2005.00030.x.
- Bhaduri, B., E. Bright, P. Coleman, and M. L. Urban. 2007. LandScan USA: A high-resolution geospatial and temporal modeling approach for population distribution and dynamics. GeoJournal 69:103–17. doi:10.1007/s10708-007-9105-9.
- Buckley, R., R. Zhou, and L. Zhong. 2016. How pristine are China’s parks? Frontiers in Ecology and Evolution 4:136.doi:10.3389/fevo.2016.00136.
- Cao, M., L. Peng, and S. Liu. 2015. Analysis of the network of protected areas in China based on a geographic perspective: Current status, issues and integration. Sustainability 7:15617–31. doi:10.3390/su71115617.
- Convention on Biological Diversity. 2010. Strategic Plan for Biodiversity 2011–2020. Accessed April 17, 2019. https://www.cbd.int/decision/cop/?id=12268.
- Cui, X., and H. F. Graf. 2009. Recent land cover changes on the Tibetan Plateau: A review. Climatic Change 94:47–61. doi:10.1007/s10584-009-9556-8.
- Deng, X., Z. Wang, and C. Zhao. 2016. Economic evolution in China ecologically fragile regions. Journal of Economic Surveys 30:552–76. doi:10.1111/joes.12160.
- Dobson, J. E., E. A. Bright, P. R. Coleman, R. C. Durfee, and B. A. Worley. 2000. LandScan: A global population database for estimating populations at risk. Photogrammetric Engineering and Remote Sensing 66:849–57.
- Du, F. 2012. Ecological resettlement of Tibetan herders in the Sanjiangyuan: A case study in Madoi county of Qinghai. Nomadic Peoples 16:116–33. doi:10.3167/np.2012.160109.
- Fraser, R. H., I. Olthof, and D. Pouliot. 2009. Monitoring land cover change and ecological integrity in Canada’s national parks. Remote Sensing of Environment 113:1397–409. doi:10.1016/j.rse.2008.06.019.
- Gillespie, T. W., K. Willis, and S. Ostermann-Kelm. 2015. Spaceborne remote sensing of the world’s protected areas. Progress in Physical Geography 39:388–404. doi:10.1177/0309133314561648.
- GIMMS. 2018. Global inventory modeling and mapping studies, version 3 g.v1. Accessed March 10, 2018. https://ecocast.arc.nasa.gov/data/pub/gimms/3g.v1/.
- Huang, K., Y. Zhang, J. Zhu, Y. Liu, J. Zu, and J. Zhang. 2016. The influences of climate change and human activities on vegetation dynamics in the Qinghai-Tibet Plateau. Remote Sensing 8:876. doi:10.3390/rs8100876.
- IUCN (International Union for Conservation of Nature). 2014. IUCN Global Protected Areas Programme and IUCN World Commission on Protected Areas delivering the promise of Sydney. Accessed April 6, 2018. http://www.iucn.org/about/work/programmes/gpap_home/.
- Jarvis, A., H. I. Reuter, A. Nelson, and E. Guevara. 2008. Hole-filled SRTM for the globe Version 4. Accessed March 10, 2018. http://srtm.csi.cgiar.org.
- Kala, C. P. 2005. Indigenous uses, population density, and conservation of threatened medicinal plants in protected areas of the Indian Himalayas. Conservation Biology 19:368–78. doi:10.1111/j.1523-1739.2005.00602.x.
- Meyer, M. C., M. S. Aldenderfer, Z. Wang, D. L. Hoffmann, J. A. Dahl, D. Degering, W. R. Haas, and F. Schlütz. 2017. Permanent human occupation of the central Tibetan Plateau in the early Holocene. Science 355:64–67. doi:10.1126/science.aag0357.
- Nagendra, H., R. Lucas, J. P. Honrado, R. H. Jongman, C. Tarantino, M. Adamo, and P. Mairota. 2013. Remote sensing for conservation monitoring: Assessing protected areas, habitat extent, habitat condition, species diversity, and threats. Ecological Indicators 33:45–59. doi:10.1016/j.ecolind.2012.09.014.
- Olson, D. M., E. Dinerstein, E. D. Wikramanayake, N. D. Burgess, G. V. Powell, E. C. Underwood, J. A. D’amico, I. Itoua, H. E. Strand, J. C. Morrison, et al. 2001. Terrestrial ecoregions of the world: A new map of life on Earth; A new global map of terrestrial ecoregions provides an innovative tool for conserving biodiversity. BioScience 51:933–38. doi:10.1641/0006-3568(2001)051[0933:teotwa]2.0.co;2.
- Ouyang, Z., H. Zheng, Y. Xiao, S. Polasky, J. Liu, W. Xu, Q. Wang, L. Zhang, Y. Xiao, E. Rao, et al. 2016. Improvements in ecosystem services from investments in natural capital. Science 352:1455–59. doi:10.1126/science.aaf2295.
- Peng, J., Z. Liu, Y. Liu, J. Wu, and Y. Han. 2012. Trend analysis of vegetation dynamics in Qinghai–Tibet Plateau using Hurst Exponent. Ecological Indicators 14:28–39. doi:10.1016/j.ecolind.2011.08.011.
- Pettorelli, N. 2013. The Normalized Difference Vegetation Index. Oxford: Oxford University Press
- Pettorelli, N., A. L. M. Chauvenet, J. P. Duffy, W. A. Cornforth, A. Meillere, and J. E. M. Baillie. 2012. Tracking the effect of climate change on ecosystem functioning using protected areas: Africa as a case study. Ecological Indicators 20:269–76. doi:10.1016/j.ecolind.2012.02.014.
- Qiu, J. 2016. Trouble in Tibet. Nature 529:142–45.
- Shen, M., S. Piao, S. J. Jeong, L. Zhou, Z. Zeng, P. Ciais, D. Chen, M. Huang, C. S. Jin, L. Z. Li, et al. 2015. Evaporative cooling over the Tibetan Plateau induced by vegetation growth. Proceedings of the National Academy of Sciences 112:9299–304. doi:10.1073/pnas.1504418112.
- Sun, J., G. Cheng, W. Li, Y. Sha, and Y. Yang. 2013. On the variation of NDVI with the principal climatic elements in the Tibetan Plateau. Remote Sensing 5:1894–911. doi:10.3390/rs5041894.
- Tang, Z., Z. Wang, C. Zheng, and J. Fang. 2006. Biodiversity in China’s mountains. Frontiers in Ecology and the Environment 4:347–52. doi:10.1890/1540-9295(2006)004[0347:bicm]2.0.co;2.
- Tian, Y., T. Yue, L. Zhu, and N. Clinton. 2005. Modeling population density using land cover data. Ecological Modelling 189:72–88. doi:10.1016/j.ecolmodel.2005.03.012.
- Tucker, C., J. Pinzon, M. Brown, D. Slayback, E. Pak, R. Mahoney, E. Vermote, and N. El Saleous. 2005. An extended AVHRR 8-km NDVI dataset compatible with MODIS and SPOT vegetation NDVI data. International Journal of Remote Sensing 26:4485–98. doi:10.1080/01431160500168686.
- UNEP-WCMC and IUCN (UN Environment World Conservation Monitoring Centre and International Union for Conservation of Nature). 2018. Protected Planet: China database; The World Database on Protected Areas (WDPA)/The Global Database on Protected Areas Management Effectiveness (GD-PAME). Accessed March 10, 2018. www.protectedplanet.net.
- UNEP-WCMC and IUCN (UN Environment World Conservation Monitoring Centre and International Union for Conservation of Nature). 2019. Protected planet: China database; The World Database on Protected Areas (WDPA)/The Global Database on Protected Areas Management Effectiveness (GD-PAME). Accessed April 7, 2019. www.protectedplanet.net. doi:10.3170/2008-7-18522.
- Wang, B., Q. Bao, B. Hoskins, G. Wu, and Y. Liu. 2008. Tibetan Plateau warming and precipitation changes in East Asia. Geophysical Research Letters 35:14. doi:10.1029/2008gl034330.
- Xu, W., Y. Xiao, J. Zhang, W. Yang, L. Zhang, V. Hull, Z. Wang, H. Zheng, J. Liu, S. Polasky, et al. 2017. Strengthening protected areas for biodiversity and ecosystem services in China. Proceedings of the National Academy of Sciences 114:1601–06. doi:10.1073/pnas.1620503114.
- Yu, H., D. C. Deane, X. Sui, S. Fang, C. Chu, Y. Liu, and F. He. 2018. Testing multiple hypotheses for the high endemic plant diversity of the Tibetan Plateau. Global Ecology and Biogeography 28:131–44. doi:10.1111/geb.12827.
- Zhang, G., Y. Zhang, J. Dong, and X. Xiao. 2013. Green-up dates in the Tibetan Plateau have continuously advanced from 1982 to 2011. Proceedings of the National Academy of Sciences 110:4309–14. doi:10.1073/pnas.1210423110.
- Zhu, Z., S. Piao, R. B. Myneni, M. Huang, Z. Zeng, J. G. Canadell, P. Ciais, S. Sitch, P. Friedlingstein, A. Arneth, et al. 2016. Greening of the Earth and its drivers. Nature Climate Change 6:791–95.
- Zhuo, L., T. Ichinose, J. Zheng, J. Chen, P. J. Shi, and X. Li. 2009. Modelling the population density of China at the pixel level based on DMSP/OLS non-radiance-calibrated night-time light images. International Journal of Remote Sensing 30:1003–18. doi:10.1080/01431160802430693.