
ABSTRACT
High-latitude systems in northwestern Canada and Alaska have warmed rapidly. The aim of this study was to examine how a remotely sensed proxy of vegetation productivity varied among mountain ranges with respect to elevation and climate from 2002–2017. Our study area included high-latitude mountains in Alaska, USA, and Yukon Territory, Canada, ranging from cold arctic mountains in the tundra biome to warmer interior mountains areas within the boreal biome. We used the annual maximum Normalized Difference Vegetation Index (NDVI) data from the 250-m MODIS NDVI product as a proxy of maximum growing season photosynthetic activity. The long-term (16-year) and interannual pattern of maximum NDVI was investigated with respect to elevation, July temperature, and July precipitation classes within four climatic mountain regions. The July temperature lapse rate was consistently linear, whereas the long-term maximum NDVI lapse rate was nonlinear. At lower elevations, the high-precipitation region had the highest NDVI, whereas the interior mountains region had the highest NDVI at higher elevations. The long-term maximum NDVI was negatively correlated with July precipitation for areas with July temperature below 12°C. Above 12°C, NDVI was positively correlated with July precipitation, with the greatest rate of NDVI increase with precipitation at the warmest July temperature class. The pattern of interannual peak NDVI with respect to July temperature was not as strong as the long-term pattern; however, the only interannual negative correlation between peak NDVI and July temperature was at lower elevations within the interior mountains. We concluded that among a regional climatic gradient of mountain areas, low growing season temperature and length were likely constraining vegetation productivity, and lower growing season moisture may be an important constraint at the warmest interior mountains region.
Introduction
Alaska climate warming and tundra productivity
Climate warming at high latitudes has been substantial over the past few decades (IPCC Citation2013), and many biotic and abiotic changes have occurred (Hinzman et al. Citation2005; Post et al. Citation2013; Showstack Citation2015). High-latitude climate warming has accelerated since 2000 (Karl et al. Citation2015). As summer sea-ice extent continues to decline, arctic amplification of warming is likely to continue (Serreze et al. Citation2009; Screen and Simmonds Citation2010; Serreze and Barry Citation2011).
Over the past 50 years, the highest rate of climate warming in North America has occurred in Alaska and northwest Canada (Clegg and Hu Citation2010). This warming has led to record-setting changes including maximum sea-ice retreat and amplified arctic warming (Melillo, Richmond, and Yohe Citation2014). As sea ice has declined in arctic Alaska, autumn monthly temperatures have risen by up to 7°C over the past 3 decades (Wendler, Moore, and Galloway Citation2014). The summer climate regime of interior Alaska is now the warmest in the past 200 years (Barber et al. Citation2004). Alaska recently experienced the warmest winter in 90 years (Walsh et al. Citation2017), and the length of the unfrozen period has increased by nearly 50 percent in the last century (Wendler and Suhlski Citation2009).
Associated with climate warming, an increase in vegetation productivity and phytomass has occurred in arctic tundra communities (Epstein et al. Citation2012; Weijers et al. Citation2018). Warming-induced expansion of tundra shrubs has been documented in arctic Alaska (Tape, Sturm, and Racine Citation2006; Naito and Cairns Citation2015) and Canada (Tremblay, Levesque, and Boudreau Citation2012; Myers-Smith and Hik Citation2017). Plot-level studies have shown increases in shrub density and height with warming across the circumpolar North (Myers-Smith et al. Citation2011; Elmendorf et al. Citation2012). Despite variation in landscape types, shrub radial growth has responded positively to mean June temperature across the Alaskan tundra (Ackerman et al. Citation2018). Based on over 400 field plots throughout northern Alaska, Swanson (Citation2015) found that high shrub canopy was associated with warm sites and projected an expansion of tall shrubs across the region.
Remote sensing relationships to climate warming
Satellite remote sensing has been used to understand changes in vegetation productivity at high latitudes. In general, a divergent response to a warming climate has been documented with a decrease in productivity in warmer boreal regions and an increase in productivity in colder tundra regions (Goetz et al. Citation2005). Understanding the response of plant growth at high latitudes is crucial for understanding feedbacks between a warming climate, land cover, and atmospheric CO2 (Bunn, Goetz, and Fiske Citation2005). The Normalized Difference Vegetation Index (NDVI) has been used as a remotely sensed proxy for vegetation productivity. Tundra NDVI is highly correlated with canopy leaf area (Steltzer and Welker Citation2006), canopy cover (Boelman et al. Citation2011), and phytomass (Raynolds et al. Citation2012; J. E. Hobbie et al. Citation2017).
As the climate has warmed, NDVI has increased in many arctic tundra regions. Across the circumpolar Arctic, there has been a positive linear relationship between NDVI and land surface temperature (Raynolds et al. Citation2008). At a regional scale, tundra maximum NDVI has been positively correlated with summer warmth in Alaska (Jia, Epstein, and Walker Citation2003; Verbyla Citation2008) and Canada (Bunn, Goetz, and Fiske Citation2005). In the Alaskan arctic tundra, Jia, Epstein, and Walker (Citation2003) found up to a 19 percent increase in peak growing season NDVI associated with increasing summer warmth. Arctic tundra annual shrub growth has been correlated with NDVI (Forbes, Macias-Fauria, and Zetterberg Citation2010; Blok et al. Citation2011a). There was a strong linear relationship between maximum NDVI, summer temperature, and total plant phytomass along a climatic gradient in arctic Alaska (D. A. Walker et al. Citation2003), arctic Canada, and arctic Europe (D. A. Walker et al. Citation2012).
Study goals
There have been many high-latitude studies documenting increasing tundra NDVI associated with warming from a circumpolar perspective (Raynolds et al. Citation2008; Bhatt et al. Citation2010; Epstein et al. Citation2012) to a continental perspective (Goetz et al. Citation2005; Beck and Goetz Citation2011; Dutrieux et al. Citation2012). There have been few regional remote sensing studies focusing on high-latitude mountains. Our focus in this study is NDVI among high-latitude mountain ranges of Western North America ().
Figure 1. Mountain areas classified into four regions. Black arrows represent dominant storm tracks from Arctic and Pacific Oceans.
In this study, we used a 16-year maximum NDVI as an approximation of maximum vegetation productivity under natural conditions. Vegetation productivity in some high-latitude areas may be slow to respond to a warming climate. For example, in a 3-year warming experiment, Radville, Post, and Eissenstat (Citation2018) found that 2°C warming did not increase tundra productivity in Greenland. Short-term, direct response to warming may be less than long-term, indirect response. Vegetation productivity may be indirectly limited by cold temperatures by controlling growing season length and limiting rooting depth and nutrient availability (Chapin Citation1983; Chapin et al. Citation1995). In a survey of sixty-one tundra warming experiments, Elmendorf et al. (Citation2012) found that experimental duration had an important effect on the vegetation response to warming. In northern Alaska, the slow increase in phytomass following multiyear warming may be lagged due to the indirect effects of warming on microbial mineralization of organic nitrogen, which strongly limits plant growth (J. E. Hobbie et al. Citation2017). However, there has not been a consistent vegetative response to long-term warming. For example, there was no significant increase in vegetative cover over 25-year repeat measurements of field plots on the arctic coastal plain (Pattison et al. Citation2015). In the warming high Arctic, there was no increase in vegetative cover of evergreen–shrub heath communities after 15 years (Hudson and Henry Citation2010). In Sweden, after 20 years of warming there was no significant change in alpine vegetative cover (Wilson and Nilsson Citation2009).
In this study, we also investigated the interannual peak summer NDVI. For some arctic vegetation types, there has been an interannual response to climatic conditions. For example, Weijers et al. (Citation2018) documented the annual shoot and ring growth of two alpine shrub species strongly driven by summer temperature. Summer temperature has been correlated with annual radial growth of tundra shrubs in Russia and Alaska (Li et al. Citation2016; Ackerman et al. Citation2018).
The goal of this study was to examine maximum NDVI among the major mountain areas in northern Alaska, USA, and the Yukon Territory, Canada. We had three questions:
Is there a linear lapse rate of declining NDVI as July temperature decreases linearly with elevation?
How does long-term (16-year) maximum NDVI vary with long-term temperature and precipitation classes?
Is there a significant positive correlation between summer warmth and summer maximum NDVI across a time series of 14 years?
Methods
Based on well-known regional climate (Hammond and Yarie Citation1996; Stafford, Wendler, and Curtis Citation2000; Fleming et al. Citation2000), we grouped our mountain areas into four regions (1) cold Arctic, (2) Arctic, (3) high precipitation, and (4) interior mountains (). The cold Arctic region includes the north slope of the Brooks Range in Alaska and the Richardson Mountains in the Yukon Territory, Canada. This region is influenced by cold air masses flowing from sea-ice areas of the Arctic Ocean and does not have forested vegetation, even at the lowest elevations. Due to the influence of these cold air masses, summer temperatures are warmer in the foothills relative to lower elevations on the Arctic Coastal Plain. The Arctic region is also primarily shrub tundra, transitioning to boreal forest treeline at the lowest elevations. The Arctic region includes the south slope of the Brooks Range in Alaska and the Wernecke Mountains in the Yukon Territory. The interior region includes the rain shadow portions of the Alaska Range and Wrangell Mountains and the Tanana Uplands in Alaska. In the Yukon Territory, interior mountains include the Pelly, Mackenzie, Kluane, Coast, and Olgilvie Mountains. The high-precipitation region includes mountains that have highest precipitation due to storm tracks from the Pacific Ocean. These areas include portions of the Wrangell Mountains and Alaska Range as well as the Kenai, Talkeetna, and Chugach Mountains. All mountains in the high-precipitation region have substantial alpine glaciers.
Gridded temperature and precipitation data
There are few long-term weather stations within our mountain regions. We therefore used gridded temperature and precipitation products (rasters) for climate data. These rasters were based on monthly climate products (Climate Research Unit; CRU TS 3.2; Harris et al. Citation2014), which were downscaled by the Scenarios Network for Alaska and Arctic Planning (SNAP) program at the University of Alaska Fairbanks (SNAP Citation2016). These products were downscaled via the delta method (Hay, Wilby, and Leavesley Citation2000; Hayhoe Citation2010) using Parameter-elevation Relationships on Independent Slopes Model (PRISM; Daly et al. Citation2008) with 1961–1990 2-km-resolution climate normals (monthly temperature and precipitation) as baseline climate. The delta method was implemented by calculating climate anomalies applied as differences in temperature and quotients in precipitation between monthly CRU data and PRISM climate normals for 1961–1990. The coarse-resolution CRU temperature anomalies were then interpolated to finer resolution PRISM spatial resolution via a spline technique and then added to the PRISM temperature normal. CRU precipitation anomalies were interpolated and then multiplied by the PRISM climate normals. The PRISM climatology product was used as baseline climate in the downscaling procedure because it accurately represents the elevational effects on precipitation patterns across mountainous regions (Daly et al. Citation2008), and it is based on precipitation and temperature observations from an extensive network of weather stations across Alaska—455 for precipitation, 316 for temperature—as well as the European Center for Medium-range Weather Forecasts’ reanalysis of temperatures at the 500-mb height (Simpson et al. Citation2005). There were large gaps in the observation network across the mountains of Alaska, and this could potentially have an impact on the results. We created a mean July temperature and total July precipitation rasters at 1-km pixels size from July rasters from 2000 to 2015. We also used July temperature at 1-km pixels from each year from 2000 to 2015 for our interannual maximum NDVI/July temperature correlation analysis.
Maximum NDVI data
As a proxy for maximum potential vegetation productivity, we used a long-term (16-year) NDVI. MODIS 16-day NDVI products (MOD13Q1 V6, MYD13Q1 V6) from 15 June to 15 August were downloaded for each year from 2002 through 2017 from https://earthexplorer.usgs.gov/. Three tiles (H10V02, H11V02, H12V02) covering Alaska and western Canada () were mosaiced and projected to the Alaska Albers NAD83 coordinate system at 250-m pixel size. Pixels with a reliability value of 0 (good reliability) and an NDVI exceeding 0.2 were selected to represent high-quality vegetated pixels for each 16-day composite period.
We computed the maximum NDVI for each growing season. In the foothills of the Brooks Range, plot-level maximum NDVI was mid- to late July (Boelman et al. Citation2011; May et al. Citation2017). Based on satellite sensor NDVI, Jia, Epstein, and Walker (Citation2004) found peak NDVI between 22 July and 4 August for four common tundra types in northern Alaska. Therefore, we computed the growing season maximum NDVI for each 250-m NDVI pixel from mid-June through mid-August (). The 2002–2017 maximum NDVI raster was then aggregated to 1 km by selecting the maximum of the sixteen NDVI values at 250-m pixel size within each 1-km output pixel (). The maximum from the 2002–2017 time series was then computed () for each 1-km pixel to represent the long-term maximum NDVI.
Figure 2. Selection of long-term maximum NDVI. (a) For each 2002–2017 growing season, the maximum NDVI was selected for each 250-m pixel. In this example, an NDVI value of 0.78 (white circle) was selected from early July. (b) Aggregation of 250-m maximum NDVI values to 1-km NDVI value. (c) Selection of long-term maximum NDVI from 2002–2017 1-km maximum NDVI time series.
Elevation and land cover classes
To map elevation zones within each mountain class, we used the Global Multi-resolution Terrain Elevation Data 2010 produced by the U.S. Geological Survey and the National Geospatial-Intelligence Agency (https://earthexplorer.usgs.gov/) at 30 arc second spacing. To match the other geospatial data sets, the elevation data were projected to the Alaska Albers NAD83 coordinate system using bilinear interpolation to 1-km pixel size. The elevation raster was clipped to the areal extent of the four mountain classes. We then reclassified the elevation raster into 100-m elevation zones.
To assess changes in NDVI associated with structural changes in vegetation such as broadleaf forest, spruce forest, shrub, dwarf shrub, etc., we used the National Land Cover Dataset (NLCD) 2001 (Selkowitz and Stehman Citation2011). We determined the majority of land cover class from NLCD 30-m pixels within each 1-km pixel. Some pixels had a majority class of “barren,” but because these pixels had a maximum NDVI above 0.2, they were likely partially vegetated.
Lapse rate of temperature and long-term maximum NDVI
To estimate lapse rates of July temperature and long-term maximum NDVI with elevation, we delineated 100-m elevation zones within each of the four mountain regions. We then computed the mean July temperature and the mean long-term maximum NDVI for each 100-m class from 500 to 2,000 m of elevation. We then used linear regression to develop temperature and NDVI lapse rate trend lines for each mountain region.
Long-term maximum NDVI in relation to July temperature and precipitation
We tested relationship between long-term maximum NDVI and long-term July climate. Based on annual July mean temperature and total July precipitation grids, we computed the 2000–2015 mean July temperature and precipitation for each 1-km cell. These values were then aggregated to classes, with the July temperature class in 1°intervals, ranging from 5°C to 17°C; the July precipitation class was in centimeters, ranging from 3 to 29 cm. For the four mountain regions, we computed the mean long-term (2002–2017) maximum NDVI () within the July temperature and July precipitation class for all climatic classes that had at least thirty pixels.
Interannual maximum NDVI related to July temperature
We also tested the relationship between interannual maximum NDVI and July temperature for the summers of 2002–2015 (at the time of this study, the CRU July temperature product was not available after 2015). For this analysis, we computed the Pearson’s r correlation coefficient for each 1-km pixel from 2002 to 2015 (n = 14 years). We then computed the mean correlation value with each 100-m elevation zone for the four mountain regions. We expected a consistently positive correlation between annual maximum NDVI and mean July temperature. Because cold tundra maximum NDVI has been correlated with summer warmth (Jia, Epstein, and Walker Citation2003; Verbyla Citation2008), we also expected this positive correlation to be strongest at higher elevations and within the coldest mountain region (cold Arctic mountains).
Results
Lapse rate of temperature and long-term maximum NDVI
From 500 to 2,000 m elevation, the linear lapse rate of mean July temperature was significant (p < 0.01) and was similar among the four mountain areas (). The July temperature at a given elevation was coolest in the cold Arctic region and warmest in the interior region. The long-term (2002–2017) maximum NDVI consistently declined with increasing elevation for each mountain region; however, the decline was not linear (). The interior region had the highest NDVI for elevations above 1,000 m, and the high-precipitation region had the highest NDVI for elevations below 1,000 m. The rate of declining NDVI was greatest at higher elevations, especially for the interior class. There was no significant difference in mean maximum NDVI from 500- to 1,300-m elevation within the interior region (analysis of variance, p > 0.05).
Figure 3(a). One hundred-meter elevation lapse rate with decadal July temperature. The lapse rate per 1,000-m elevation gain was −4.3°C/km for cold Arctic class, −4.2°C/km for Arctic, −4.4°C/km high-precipitation, and −4.5°C/km for interior mountain class. (b) 2002–2017 mean long-term maximum NDVI by elevation zone.
Long-term maximum NDVI in relation to July temperature and precipitation
The long-term (2002–2017) maximum NDVI was negatively correlated with July precipitation and positively correlated with July temperature (). At July temperature classes cooler than 12°C, the interior mountains region consistently had the highest long-term maximum NDVI, whereas for classes warmer than 12°C, the high-precipitation mountains region consistently had the highest long-term maximum NDVI.
Figure 4(a). Mean long-term (2002–2017) maximum NDVI by precipitation class. (b) Mean long-term (2002–2017) maximum NDVI by temperature class. Each class was computed from at least 100 1-km pixels. Each mountain class had a second-order polynomial trend line with R2 > 0.97, p < 0.01.
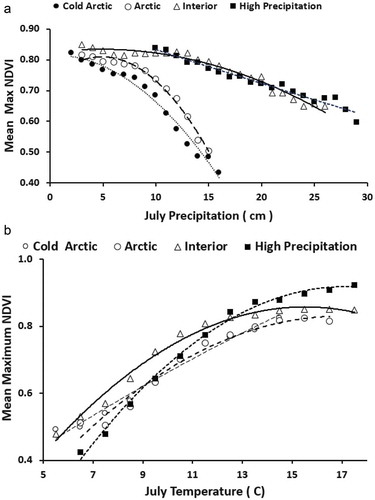
The relationship of maximum NDVI with precipitation was negative for temperature classes below 12°C and positive for warmer temperature classes (). The greatest rate of increasing NDVI with precipitation was at the warmest July temperature class ().
Figure 5(a). Negative relationship between mean long-term (2002–2017) maximum NDVI by precipitation for cooler temperature classes from all mountain pixels. (b) Positive relationship between mean maximum long-term NDVI by precipitation for warmer temperature classes from all mountain pixels. All linear trends were significant (p < 0.01) except for the 12°C trend line.
Interannual maximum NDVI related to July temperature
Our growing season maximum NDVI ranged from 2002 to 2017 and our annual July temperature rasters ranged from 2000 to 2015, yielding a sample size of fourteen (2002–2015). A Pearson’s r value of >0.43 would be significant (p < 0.05, one-tailed distribution) at a sample size of fourteen. There were no significant correlations at p < 0.05. However, the positive correlation between maximum growing season NDVI and July temperature was strongest in the cold Arctic region. There was a negative mean correlation between maximum growing season NDVI and July temperature for the interior region ().
Figure 6. Mean Pearson’s r from 2002–2015 interannual maximum NDVI and July temperature by 100-m elevation zone. Each mean was based on at least thirty 1-km pixels. A Pearson’s r of >0.43 would be required for a significant (one-tailed p < 0.05) correlation with a sample size of 14 years (2002–2015).
Discussion
As expected, the mean July temperature declined linearly with elevation (). At any given elevation, the mean July temperature was coolest cold Arctic region and warmest in the interior region. The interior mountain region had the steepest lapse rate, which is likely due to less influence of the Arctic and Pacific Oceans relative to the other mountain regions. The July temperature lapse rates of 4.2°C–4.5°C per kilometer was similar to April–June monthly lapse rates of 4.9–4.3 in an alpine area of southern Idaho (Blandford et al. Citation2008) and the summer lapse rate of −4.3 from an icefield in Nunavut, Canada (Marshall et al. Citation2007). In a comparison of SNAP monthly gridded temperature with measurements from the Alaska Range, Sadoti et al. (Citation2018) found a measured versus gridded July lapse rate within 0.1°C–0.3°C for two summers, with the measured July temperature consistently cooler than the SNAP-gridded product, possibly due to cool air pooling at some measured sites.
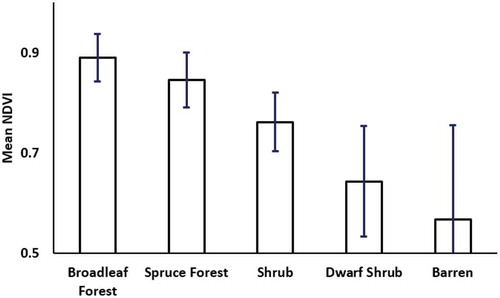
The decline of long-term maximum NDVI with elevation was not linear (). This nonlinear pattern was likely due to changes in structural vegetation types with July temperature classes (). For example, for the interior region, there was a substantial difference in mean NDVI among classes that vary with elevation (). In a study of national parks across northern Alaska, Swanson (Citation2015) found that the fraction of area in forest versus tall shrub vegetation type varied with July temperature class. Other studies in Alaska have described changes in structural vegetation types related to climatic zones. For example, D. A. Walker et al. (Citation2003) found that total plant phytomass and maximum NDVI increased in arctic tundra across three bioclimate zones ranging from coldest high arctic dominated by graminoids and prostrate shrubs to warmest tall shrub tundra. In a study of spruce along a longitudinal gradient in Alaska, Miller et al. (Citation2017) found that seedling, sapling, and tree abundance correlated with maximum July temperature, and as the climate has warmed there has been a shift in geographical range limits to spruce establishment. As an example from this study, within the interior mountains class, high NDVI broadleaf forest occurred above a July threshold temperature of 12°C, whereas spruce occurred above a July threshold of 11°C, and lower NDVI dwarf shrub rarely occurred in July temperature classes warmer than 13°C (). These changes in structural vegetation types and the associated changes in NDVI likely caused lower long-term maximum NDVI in colder July temperature zones. The declining long-term maximum NDVI with elevation was consistent among the four mountain regions (). For elevations less than 1,100 m, the high-precipitation region had the highest NDVI, and the interior region had the highest NDVI above this elevation (). This may be due to moisture constraining the long-term maximum NDVI at lower elevations, whereas growing season temperature and length may be major constraints at higher elevations.
Figure 7. Areal percentage of structural vegetation by elevation zone within interior mountains region.
Figure 8. Interior mountains mean long-term maximum NDVI by land cover class. Majority vegetation type was determined based on 30-m NLCD pixels each 1-km NDVI pixel. Error bars represent one standard deviation of long-term maximum NDVI at 1-km pixel size.
Most arctic tundra studies have found maximum NDVI to be positively correlated with summer temperature across the circumpolar arctic (Raynolds et al. Citation2008; Bhatt et al. Citation2017), North America (Bhatt et al. Citation2013), and arctic Alaska (Jia, Epstein, and Walker Citation2003; Verbyla Citation2008). Field studies have also shown a strong positive relationship between shrub ring growth and summer temperature in willow (Salix pulchra; Ackerman et al. Citation2018) and dwarf birch (Betula nana; Blok et al. Citation2011a; Li et al. Citation2016). Summer temperature may be the most influential factor controlling variation in arctic shrub growth (Myers-Smith et al. Citation2015). In this study, the relationship between long-term maximum NDVI and July temperature was strongest at cooler temperature classes (). The mean long-term maximum NDVI was consistently greatest for the interior mountains region for July temperatures less than 12°C, likely due to a longer growing season. At July temperatures above 12°C, the high-precipitation region consistently had the highest mean long-term maximum NDVI, perhaps due to moisture limitation among the other classes at these warmer temperatures.
In this study there was a negative relationship between mean long-term maximum NDVI and July precipitation. This was likely due to a negative correlation between increasing precipitation and decreasing temperature as elevation increased (Pearson’s r = −0.74, p < 0.01). There was a tipping point at 12°C in the relationship between maximum NDVI and precipitation (). At July temperatures cooler than 12°C, NDVI was negatively related to precipitation and the lowest NDVI values were from the coldest, wettest classes. This may have been due to a shorter growing season at the coldest, wettest classes. In a plot-based study among Alaska’s arctic national parks, Swanson (Citation2015) found that all plots with high shrub canopy volume had spring snowpack loss by the end of May. At July temperatures warmer than 12°C, NDVI was positively related to precipitation, with the strongest relationship in the warmest temperature class (). Moisture may become more limiting at these warmer temperatures. Ackerman et al. (Citation2018) found evidence of temperature-induced moisture limitation during warm years in Salix pulchra consistent among four different landscapes in arctic Alaska. In a relatively dry climate of western Greenland, Gamm et al. (Citation2017) found declining growth of deciduous shrubs related to increasing moisture limitation in a warming climate.
Although not statistically significant, there was a positive correlation between peak summer NDVI and July temperature, with the highest correlation in the cold Arctic region (). The only classes with a negative correlation between peak summer NDVI and July temperature were the low-elevation zones from the interior mountains region, likely due to moisture limitation at these warm areas. Spruce forest was the dominant vegetation type at these lower elevations in interior mountains. At lower elevations, warm summers likely have a direct effect on tree ring growth due to temperature-induced drought stress (Barber, Juday, and Finney Citation2000; Beck and Goetz Citation2011). Maximum summer NDVI was positively correlated to the last day of spring snow only at elevations above 500 m (Verbyla Citation2015). This was likely due to later snowmelt at higher elevations having a greater effect on soil moisture during the summer drought period (Dearborn and Danby Citation2018), whereas lower elevation summer soil moisture was not related to late spring snowpack water equivalent (Verbyla Citation2015). Based on tree-ring analyses in interior Alaska, white spruce ring growth declines above a July threshold of about 12°C–14°C (Wilmking et al. Citation2004; Juday and Alix Citation2012; Juday et al. Citation2015; Lloyd, Duffy, and Mann Citation2013). In southwestern Alaska, where there is typically more summer precipitation, white spruce growth leveled off at about 13°C (Sherriff et al. Citation2017). At elevational treeline, a threshold of 11°C was documented in the Yukon Territory (D’Arrigo et al. 2004). In this study, above 12°C there was a strong relationship between long-term maximum NDVI and precipitation class (). If the July temperature warmed by 2°C, 88 percent of the interior mountains pixels would be above this 12°C threshold. There has been no significant increase in precipitation as interior Alaska’s climate has warmed (Vose et al. Citation2017), and if this trend continues, moisture rather than cold temperature may become an important limiting factor in the interior mountains.
The weaker correlations of the interannual peak NDVI–July temperature relationships relative to the longer-term relationships could be due to inherent year-to-year variability masking longer-term increase in plant biomass due to a warming climate (J. E. Hobbie et al. Citation2017). Fraser et al. (Citation2014) also found no significant interannual correlation between NDVI and July temperature but found a strong (r = 0.90) long-term correlation. There may be interannual lag effects; for example, Blok et al. (Citation2011b) found that the precipitation of the previous summer was significantly correlated with the current summer’s shrub ring growth, suggesting that wet summers facilitate shrub growth in the following growing season. Extreme climatic events and winter warming may lead to decreased maximum growing season NDVI. Warm autumn may delay winter hardening, and winter rain event can cause canopy icing damage (Phoenix and Bjerke Citation2016). Frost damage associated with warm winters and low snowpack may reduce growth in the following summer (Bokhorst et al. Citation2009). Extreme winter warming may trigger mid-winter bud burst and loss of freeze tolerance (Bokhorst et al. Citation2011).
Warming effects can be indirect (Chapin Citation1983)—for example, increased decomposition, mineralization, nitrogen fixation, and nutrient absorption—but there may be a substantial lag in these responses (S. E. Hobbie Citation1996; Sturm et al. Citation2005; Kremers, Hollister, and Oberbsuer Citation2015). The trend of long-term maximum NDVI with temperature class was likely due to subpixel variations in structural vegetation types that are controlled by climate. For example, in northern Alaska, Swanson (Citation2015) found that all tall shrub plots had mean July temperatures exceeding 10°C, with temperature thresholds varying by shrub species.
There are likely many subpixel factors that affect maximum NDVI, including topographic effects, wind exposure, snow cover duration, and permafrost distribution. However, regional climate may have a substantial temporal effect on maximum NDVI. For example, Verbyla (Citation2015) found similar maximum annual NDVI patterns from adjacent permafrost-dominated and nearly permafrost-free basins, likely due to a similar effect of regional drought on shallow-rooted subarctic vegetation. Based on dendrochronology, X. Walker and Johnstone (Citation2014) found that black spruce responded negatively to summer drought on all sites studied, even on cold, moist sites. Based on isotope analysis, X. Walker, Mack, and Johnstone (Citation2015) concluded that as boreal Alaska continues to warm, we can expect drought‐induced productivity declines across large regions of the boreal forest, even for trees located in cool and moist landscape positions. In the arctic tundra of Alaska, Ackerman et al. (Citation2018) found a “remarkably coherent” response of Salix pulchra ring growth in relation to summer warmth among four landscape types, despite substantial variation in ecosystem properties (e.g., pH, soil moisture, nitrogen availability) associated with glacial landscape age and position. At a smaller scale, Ackerman et al. (Citation2018) found that although riparian shrubs were significantly larger than adjacent upland shrubs, there was no significant difference in riparian versus upland shrub ring growth response to summer temperature.
This was a coarse-resolution regional study that did not account for finer-scale disturbances such as retrogressive thaw slumps, wildfires, and glacier recession. In our high-precipitation region, glacier recession is likely to accelerate as the climate warms (Arendt et al. Citation2002; Das et al. Citation2014) and, based on finer resolution remote sensing, recently deglaciated areas are increasing in NDVI (Green Citation2018). As the climate continues to warm, wildfires are likely to become more frequent in our warmer interior mountains region (Calef et al. Citation2015), and retrogressive thaw slumps are likely to become more frequent across our entire study region (Balser, Jones, and Gens Citation2014; Segal, Lantz, and Kokelj Citation2016). Finer-resolution remote sensing studies can be used with fieldwork to focus on disturbances at a more local scale. For example, Tape, Verbyla, and Welker (Citation2011) used historic Landsat sensor data to document the expansion of tall shrubs and increasing NDVI in the foothills of the Brooks Range and investigated the potential interaction between shrub expansion, erosion, and sedimentation. Frost and Epstein (Citation2014) used high-resolution imagery to document the rapid development of alder shrubs and an increase in NDVI following cryogenic landslides. Fraser et al. (Citation2014) used a time series of aerial photography to document disturbances caused by wildfires and oil development that caused localized increases in NDVI due to shrub expansion.
Conclusion
Cold temperature was likely limiting vegetation productivity as indexed by maximum NDVI across a wide range of high-latitude mountains in Alaska and the Yukon Territory. In the cold Arctic region, maximum NDVI was consistently the lowest at any given elevation, likely due to the shortest and coldest growing season relative to other classes. The Arctic class and cold Arctic regions are within the tundra biome and had a similar relationship between long-term maximum NDVI and July temperature class, perhaps due to a short growing season relative to the lower latitude regions. The interior mountains and high-precipitation regions are within the boreal biome and had the highest long-term maximum NDVI for any given July temperature class. At colder July temperature classes, the interior mountains region consistently had the highest mean long-term maximum NDVI, perhaps due to a longer growing season relative to the high-precipitation region. At relatively warm July temperatures, moisture may be limited in the interior mountains region, because the high-precipitation region consistently had the highest mean NDVI at July temperatures above 12°C. If the climate continues to warm with no significant increase in precipitation, moisture stress may become an important factor limiting vegetation productivity in the interior mountains region.
Acknowledgments
We thank the anonymous reviewers for helping us to improve the article. The long-term maximum NDVI and annual maximum NDVI have been archived for public use at: https://doi.org/10.3334/ORNLDAAC/1614
Disclosure statement
No potential conflict of interest was reported by the authors.
Additional information
Funding
References
- Ackerman, D. E., D. Griffin, S. E. Hobbie, K. Popham, E. Jones, and J. C. Finlay. 2018. Uniform shrub growth response to June temperature across the North Slope of Alaska. Environmental Research Letters 13:044013. doi:10.1088/1748-9326/aab326.
- Arendt, A. A., K. A. Echelmeyer, W. D. Harrison, C. S. Lingle, and V. B. Valentine. 2002. Rapid wastage of Alaska glaciers and their contribution to rising sea level. Science 297 (5580):382–86. doi:10.1126/science.1072497.
- Balser, A. W., J. B. Jones, and R. Gens. 2014. Timing of retrogressive thaw slump initiation in the Noatak Basin, northwest Alaska, USA. Journal of Geophysical Research: Earth Surface 119:1106–20.
- Barber, V. A., G. P. Juday, and B. P. Finney. 2000. Reduced growth of Alaskan white spruce in the twentieth century from temperature-induced drought stress. Nature 405:668–73. doi:10.1038/35015049.
- Barber, V. A., G. P. Juday, B. P. Finney, and M. Wilmking. 2004. Reconstruction of summer temperatures in interior Alaska from tree-ring proxies: Evidence for changing synoptic climate regimes. Climatic Change 63:91–120. doi:10.1023/B:CLIM.0000018501.98266.55.
- Beck, P. S. A., and S. J. Goetz. 2011. Satellite observations of high northern latitude vegetation productivity changes between 1982 and 2008: Ecological variability and regional differences. Environmental Research Letters 6:045501. doi:10.1088/1748-9326/6/4/045501.
- Bhatt, U. S., D. A. Walker, M. K. Raynolds, J. C. Comiso, H. E. Epstein, G. Jia, R. Gens, J. E. Pinzon, C. J. Tucker, C.E. Tweedie, et al. 2010. Circumpolar Arctic tundra vegetation change is linked to sea-ice decline. Earth Interactions 14:1–20. doi:10.1175/2010EI315.1.
- Bhatt, U. S., D. A. Walker, M. K. Raynolds, P. A. Bieniek, H. Epstein, J. C. Comiso, J. E. Pinzon, C. J. Tucker, M. Steele, W. Ermold, et al. 2017. Changing seasonality of panarctic tundra vegetation in relationship to climatic variables. Environmental Research Letters 12:055003. doi:10.1088/1748-9326/aa6b0b.
- Bhatt, U. S., D. A. Walker, M. K. Raynolds, P. A. Bieniek, H. E. Epstein, J. C. Comiso, J. E. Pinzon, C. J. Tucker, and I. V. Polyakov. 2013. Recent declines in warming and vegetation greening trends over Pan-Arctic tundra. Remote Sensing 5:4229–54. doi: 10.3390/rs5094229.
- Blandford, T., K. Humes, B. Harshburger, B. Moore, V. Walden, and H. Ye. 2008. Seasonal and synoptic variations in near‐surface air temperature lapse rates in a mountainous basin. Journal of Applied Meteorology & Climatology 47:249–61. doi:10.1175/2007JAMC1565.1.
- Blok, D., G. Schaepman-Strub, H. Bartholomeus, M. M. Heijmans, T. C. Maximov, and F. Berendse. 2011b. The response of Arctic vegetation to the summer climate: Relation between shrub cover, NDVI, surface albedo, and temperature. Environmental Research Letters 6:035502. doi:10.1088/1748-9326/6/3/035502.
- Blok, D., U. Sass-Klaassen, G. Schaepman-Strub, M. M. Heijmans, P. Sauren, and F. Berendse. 2011a. What are the main climate drivers for shrub growth in Northeastern Siberian tundra? Biogeosciences 8:1169–79. doi:10.5194/bg-8-1169-2011.
- Boelman, N. T., L. Gough, J. R. McLaren, and H. Greaves. 2011. Does NDVI reflect variation in the structural attributes associated with increasing shrub dominance in arctic tundra? Environmental Research Letters 6:035501. doi:10.1088/1748-9326/6/3/035501.
- Bokhorst, S., J. W. Bjerke, H. Tømmervik, T. V. Callaghan, and G. K. Phoenix. 2009. Winter warming events damage sub-Arctic vegetation: Consistent evidence from an experimental manipulation and a natural event. Journal of Ecology 97:1408–15. doi:10.1111/j.1365-2745.2009.01554.x.
- Bokhorst, S., J. W. Bjerke, L. E. Street, T. V. Callaghan, and G. K. Phoenix. 2011. Impacts of multiple extreme winter warming events on sub-Arctic heathland: Phenology, reproduction, growth, and CO2 flux responses. Global Change Biology 17:2817–30. doi:10.1111/j.1365-2486.2011.02424.x.
- Bunn, A. G., S. J. Goetz, and G. J. Fiske. 2005. Observed and predicted responses of plant growth to climate across Canada. Geophysical Research Letters 32:L16710. doi:10.1029/2005GL023646.
- Calef, M. P., A. Varyak, A. D. McGuire, F. S. Chapin, and K. B. Reinhold. 2015. Recent changes in annual area burned in interior Alaska: The impact of fire management. Earth Interactions 19 (5):1–17. doi:10.1175/EI-D-14-0025.1.
- Chapin, F. S. 1983. Direct and indirect effects of temperature on arctic plants. Polar Biology 2:47–52. doi:10.1007/BF00258285.
- Chapin, F. S., G. R. Shaver, A. E. Giblin, K J.. Nadelhoffer, and J. A. Laundre. 1995. Responses of Arctic tundra to experimental and observed changes in climate. Ecology 76 (3):694–711. doi: 10.2307/1939337.
- Clegg, B. F., and F. S. Hu. 2010. An oxygen-isotope record of Holocene climate change in south-central Brooks Range, Alaska. Quaternary Science Reviews 29:928–39. doi:10.1016/j.quascirev.2009.12.009.
- D’Arrigo, R. D., R. K. Kaufmann, N. Davi, G. C. Jacoby, C. Laskowski, R. B. Myenie, and P. Cherubini. 2004. Thresholds for warming-induced growth decline at elevational tree line in the Yukon Territory, Canada. Global Biogeochemical Cycles 18:GB3021. doi:10.1029/2004GB002249.
- Daly, C., M. Halbleib, J. I. Smith, W. P. Gibson, M. K. Doggett, G. H. Taylor, J. Curtis, and P. P. Pasteris. 2008. Physiographically sensitive mapping of climatological temperature and precipitation across the conterminous United States. International Journal of Climatology 28:2031–64. doi:10.1002/joc.v28:15.
- Das, I., R. Hock, E. Berthier, and C. S. Lingle. 2014. 21st-century increase in glacier mass loss in the Wrangell Mountains, Alaska, USA, from airborne laser altimetry and satellite stereo imagery. Journal of Glaciology 60:283–93. doi:10.3189/2014JoG13J119.
- Dearborn, K., and R. K. Danby. 2018. Climatic drivers of tree growth at tree line in Southwest Yukon change over time and vary between landscapes. Climatic Change 150:211–25. doi:10.1007/s10584-018-2268-1.
- Dutrieux, L. P., H. Bartholomeus, M. Herold, and J. Verbesselt. 2012. Relationships between declining summer sea ice, increasing temperatures and changing vegetation in the Siberian Arctic tundra from MODIS time series (2000–11). Environmental Research Letters 7:044028. doi:10.1088/1748-9326/7/4/044028.
- Elmendorf, S. C., G. H. R. Henry, R. D. Hollister, R. G. Bjork, N. Boulanger-Lapointe, E. J. Cooper, J. H. C. Cornelissen, T. A. Day, E. Dorrepaal, T. G. Elumeeva, et al. 2012. Plot-scale evidence of tundra vegetation change and links to recent summer warming. Nature Climate Change 2:453–57. doi:10.1038/nclimate1465.
- Epstein, H. E., M. K. Raynolds, D. A. Walker, U. S. Bhatt, C. J. Tucker, and J. E. Pinzon. 2012. Dynamics of aboveground phytomass of the circumpolar Arctic tundra during the past three decades. Environmental Research Letters 7:015506. doi:10.1088/1748-9326/7/1/015506.
- Fleming, M. D., F. S. Chapin, W. Cramer, G. L. Hufford, and M. C. Serreze. 2000. Geographic patterns and dynamics of Alaskan climate interpolated from a sparse station record. Global Change Biology 6:49–58. doi:10.1046/j.1365-2486.2000.06008.x.
- Forbes, B. C., M. Macias-Fauria, and P. Zetterberg. 2010. Russian Arctic warming and ‘greening’ are closely tracked by tundra shrub willows. Global Change Biology 16:1542–54. doi:10.1111/j.1365-2486.2009.02047.x.
- Fraser, R. H., T. C. Lantz, I. Olthof, S. V. Kokelj, and R. A. Sims. 2014. Warming-induced shrub expansion and lichen decline in the Western Canadian Arctic. Ecosystems 17:1151–68. doi:10.1007/s10021-014-9783-3.
- Frost, G. V., and H. E. Epstein. 2014. Tall shrub and tree expansion in Siberian tundra ecotones since the 1960s. Global Change Biology 20:1264–77. doi:10.1111/gcb.2014.20.issue-4.
- Gamm, C. M., P. F. Sullivan, A. Buchwal, R. J. Dial, A. B. Young, D. A. Watts, and E. Post. 2017. Declining growth of deciduous shrubs in the warming climate of continental western Greenland. Journal of Ecology 106:640–54. doi:10.1111/1365-2745.12882.
- Goetz, S. J., A. G. Bunn, G. J. Fiske, and R. A. Houghton. 2005. Satellite-observed photosynthetic trends across boreal North America associated with climate and fire disturbance. Proceedings of the National Academy of Sciences USA 102:13521–25. doi:10.1073/pnas.0506179102.
- Green, C. A. 2018. Greening of recently deglaciated lands on the Kenai Peninsula. M.S. Thesis, Texas A & M University, College Station, TX, USA.
- Hammond, T., and J. Yarie. 1996. Spatial prediction of climatic state factor regions in Alaska. Ecoscience 3:490–501. doi:10.1080/11956860.1996.11682368.
- Harris, I., P. D. Jones, T. J. Osborn, and D. H. Lister. 2014. Updated high-resolution grids of monthly climatic observations - the CRU TS3.10 dataset. International Journal of Climatology 34:623–42. doi:10.1002/joc.3711.
- Hay, L. E., R. L. Wilby, and G. H. Leavesley. 2000. A comparison of delta change and downscaled GCM scenarios for three mountainous basins in the United States 1. JAWRA Journal of the American Water Resources Association 36:387–97. doi:10.1111/jawr.2000.36.issue-2.
- Hayhoe, K. A. 2010. A standardized framework for evaluating the skill of regional climate downscaled techniques. Ph.D. Thesis, University of Illinois, Urbana, IL, USA.
- Hinzman, L. D., N. D. Bettez, W. R. Bolton, F. S. Chapin III, M. B. Dyurgerov, C. L. Fasti, B. Griffith, R. D. Hollister, A. Hope, H. P. Huntington, et al. 2005. Evidence and implications of recent climate change in northern Alaska and other arctic regions. Climatic Change 72:251–98. doi:10.1007/s10584-005-5352-2.
- Hobbie, J. E., G. R. Shaver, E. B. Rastetter, J. E. Cherry, S. J. Goetz, K. C. Guay, W. A. Gould, and G. W. Kling. 2017. Ecosystem responses to climate change at a Low Arctic and a High Arctic long-term research site. Ambio 46:S160–S173. doi:10.1007/s13280-016-0870-x.
- Hobbie, S. E. 1996. Temperature and plant species control over litter decomposition in Alaskan tundra. Ecological Monographs 66:503–22. doi:10.2307/2963492.
- Hudson, J. M. G., and G. H. R. Henry. 2010. High Arctic plant community resists 15 years of experimental warming. Journal of Ecology 98:1035–41. doi:10.1111/j.1365-2745.2010.01690.x.
- IPCC (Intergovernmental Panel on Climate Change). 2013. Summary for policymakers. In Climate change 2013: Contribution of Working Group I to the Fifth Assessment Report of the Intergovernmental Panel on Climate Change, ed. T. F. Stocker, D. Qin, G.-K. Plattner, M. Tignor, S. K. Allen, J. Boschung, A. Nauels, Y. Xia, V. Bex, and P. M. Midgley, Cambridge and New York: Cambridge University Press.
- Jia, G., H. E. Epstein, and D. A. Walker. 2003. Greening of arctic Alaska, 1981–2001. Geophysical Research Letters 30:2067. doi:10.1029/2003GL018268.
- Jia, G. J., H. E. Epstein, and D. A. Walker. 2004. Controls over intra-seasonal dynamics of AVHRR NDVI for the Arctic tundra in northern Alaska. International Journal of Remote Sensing 25:1547–64. doi:10.1080/0143116021000023925.
- Juday, G. P., and C. Alix. 2012. Consistent negative temperature sensitivity and positive influence of precipitation on growth of floodplain Picea glauca in Interior Alaska. Canadian Journal of Forest Research 42 (3):561–73. doi:10.1139/x2012-008.
- Juday, G. P., C. Alix, and T. A. Grant III. 2015. Spatial coherence and change of opposite white spruce temperature sensitivities on floodplains in Alaska confirms early-stage boreal biome shift. Forest Ecology & Management 350:46–61. doi:10.1016/j.foreco.2015.04.016.
- Karl, T. R., A. Arguez, B. Haung, J. H. Lawrimore, J. R. McMahon, M. J. Menne, T. C. Peterson, R. S. Vose, and H. M. Zhang. 2015. Possible artifacts of data biases in the recent global surface warming hiatus. Science 348:1469–72. doi:10.1126/science.aaa5632.
- Kremers, K. S., R. D. Hollister, and S. F. Oberbauer. 2015. Diminished response of arctic plants to warming over time. PLoS ONE 10:e0116586. doi:10.1371/journal.pone.0116586.
- Li, B., M. Heijmans, F. Berendse, D. Blok, T. Maximov, and U. Sass-Klaassen. 2016. The role of summer precipitation and summer temperature in establishment and growth of dwarf shrub Betula nana in northeast Siberian tundra. Polar Biology 39:1245–55. doi:10.1007/s00300-015-1847-0.
- Lloyd, A. H., P. A. Duffy, and D. H. Mann. 2013. Nonlinear responses of white spruce growth to climate variability in interior Alaska. Canadian Journal of Forest Research 43:331–43. doi:10.1139/cjfr-2012-0372.
- Marshall, S. J., M. J. Sharp, D. O. Burgess, and F. S. Anslow. 2007. Near-surface-temperature lapse rates on the Prince of Wales Icefield, Ellesmere Island, Canada: Implications for regional downscaling of temperature. International Journal of Climatology 27:385–98. doi:10.1002/(ISSN)1097-0088.
- May, J., N. Healey, H. Ahrends, R. Hollister, C. Tweedie, J. Welker, W. Gould, and S. Oberbauer. 2017. Short-term impacts of the air temperature on greening and senescence in Alaskan arctic plant tundra habitats. Remote Sensing 9:1338. doi:10.3390/rs9121338.
- Melillo, J. M., T. C. Richmond, and G. W. Yohe Eds. 2014. Climate change impacts in the United States: The third national climate assessment. U.S. Global Change Research Program, 841. doi:10.7930/J0Z31WJ2
- Miller, A. E., T. L. Wilson, R. L. Sherriff, and J. Walton. 2017. Warming drives a front of white spruce establishment near western treeline, Alaska. Global Change Biology 23:5509–22. doi:10.1111/gcb.13814.
- Myers-Smith, I. H., B. S. Forbes, M. Wilmking, M. Hallinger, T. Lantz, D. Blok, K. D. Hik, M. Macias-Fauria, U. Sass-Klaassen, E. Lévesque, et al. 2011. Shrub expansion in tundra ecosystems: Dynamics, impacts and research priorities. Environmental Research Letters 6 (2011):045509. doi:10.1088/1748-9326/6/4/045509.
- Myers-Smith, I. H., and D. S. Hik. 2017. Climate warming as a driver of tundra shrubline advance. Journal of Ecology 106:547–60. doi:10.1111/1365-2745.12817.
- Myers-Smith, I. H., S. C. Elmendorf, P. S. A. Beck, M. Wilmking, M. Hallinger, D. Blok, K. D. Tape, S. A. Rayback, M. Macias-Fauria, B. C. Forbes, et al. 2015. Climate sensitivity of shrub growth across the tundra biome. Nature Climate Change 5:887–91.
- Naito, A. T., and D. M. Cairns. 2015. Patterns of shrub expansion in Alaskan arctic river corridors suggest phase transition. Ecology and Evolution 5:87–101. doi:10.1002/ece3.1341.
- Pattison, R. R., J. C. Jorgenson, M. K. Raynolds, and J. M. Welker. 2015. Trends in NDVI and tundra community composition in the Arctic of NE Alaska between 1984 and 2009. Ecosystems 18:707–19. doi:10.1007/s10021-015-9858-9.
- Phoenix, G., and J. W. Bjerke. 2016. Arctic browning: Extreme events and trends reversing arctic greening. Global Change Biology 22:2960–62. doi:10.1111/gcb.13261.
- Post, E., U. S. Bhatt, C. M. Bitz, J. F. Brodie, T. L. Fulton, M. Hebblewhite, and D. A. Walker. 2013. Ecological consequences of sea ice decline. Science 341:519–24. doi:10.1126/science.1235225.
- Radville, L., E. Post, and D. M. Eissenstat. 2018. On the sensitivity of root and leaf phenology to warming in the Arctic. Arctic, Antarctic, and Alpine Research 50 (1):S100020. doi:10.1080/15230430.2017.1414457.
- Raynolds, M. K., D. A. Walker, H. E. Epstein, J. E. Pinzon, and C. J. Tucker. 2012. A new estimate of tundra-biome phytomass from trans-Arctic field data and AVHRR NDVI. Remote Sensing Letters 3:403–11. doi:10.1080/01431161.2011.609188.
- Raynolds, M. K., J. C. Comiso, D. A. Walker, and D. Verbyla. 2008. Relationship between satellite-derived land surface temperatures, arctic vegetation types, and NDVI. Remote Sensing of Environment 112:1884–94. doi:10.1016/j.rse.2007.09.008.
- Sadoti, G., S. A. McAfee, C. A. Roland, E. F. Nicklen, and P. J. Sousanes. 2018. Modelling high-latitude summer temperature patterns using physiographic variables. International Journal of Climatology 38:4033–42. doi:10.1002/joc.5538.
- Screen, J. A., and I. Simmonds. 2010. The central role of diminishing sea ice in recent Arctic temperature amplification. Nature 464:1334–37. (29 April 2010). doi:10.1038/nature09051.
- Segal, R. A., T. C. Lantz, and S. V. Kokelj. 2016. Acceleration of thaw slump activity in glaciated landscapes of the Western Canadian Arctic. Environmental Research Letters 11:034025. doi:10.1088/1748-9326/11/3/034025.
- Selkowitz, D. J., and S. V. Stehman. 2011. Thematic accuracy of the National Land Cover Database (NLCD) 2001 land cover for Alaska. Remote Sensing of Environment 115:1401–07. doi:10.1016/j.rse.2011.01.020.
- Serreze, M. C., A. P. Barrett, J. C. Stroeve, D. N. Kindig, and M. M. Holland. 2009. The emergence of surface-based Arctic amplification. Cryosphere 3:11–19. doi:10.5194/tc-3-11-2009.
- Serreze, M. C., and R. G. Barry. 2011. Processes and impacts of Arctic amplification: A research synthesis. Global and Planetary Change 77:85–96. doi:10.1016/j.gloplacha.2011.03.004.
- Sherriff, H. I., A. E. Miller, K. Muth, M. Schriver, and R. Batzel. 2017. Spruce growth responses to warming vary by ecoregion and ecosystem type near the forest-tundra boundary in south-west Alaska. Journal of Biogeography 44:1457–68. doi:10.1111/jbi.2017.44.issue-7.
- Showstack, R. 2015. Arctic report card highlights profound regional changes. Eos 6. doi:10.1029/2015EO041933.
- Simpson, J. J., G. L. Hufford, C. Daly, J. S. Berg, and M. D. Fleming. 2005. Comparing maps of mean monthly surface temperature and precipitation for Alaska and adjacent areas of Canada produced by two different methods. Arctic 58:137–61.
- SNAP (Scenario Networks for Alaska and Arctic Planning, University of Alaska). 2016. https://www.snap.uaf.edu/methods/downscaling
- Stafford, J. M., G. Wendler, and J. Curtis. 2000. Temperature and precipitation of Alaska: 50 year trend analysis. Theoretical & Applied Climatology 67:33–44. doi:10.1007/s007040070014.
- Steltzer, H., and J. M. Welker. 2006. Modeling the effect of photosynthetic vegetation properties on the NDVI-LAI relationship. Ecology 87:2765–72. doi:10.1890/0012-9658(2006)87[2765:MTEOPV]2.0.CO;2.
- Sturm, M., J. Schimel, G. Michaelson, J. M. Welker, and S. F. Oberbauer. 2005. Winter biological processes could help convert arctic tundra to shrubland. Bioscience 55:17–26. doi:10.1641/0006-3568(2005)055[0017:WBPCHC]2.0.CO;2.
- Swanson, D. K. 2015. Environmental limits of tall shrubs in Alaska’s Arctic National Parks. PLoS One 10 (9):e0138387. doi:10.1371/journal.pone.0138387.
- Tape, K., M. Sturm, and C. Racine. 2006. The evidence for shrub expansion in northern Alaska and the Pan-Arctic. Global Change Biology 12:686–702. doi:10.1111/gcb.2006.12.issue-4.
- Tape, K. D., D. Verbyla, and J. M. Welker. 2011. Twentieth century erosion in Arctic Alaska foothills: The influence of shrubs, runoff, and permafrost. Journal of Geophysical Research 116:G04024. doi:10.1029/2011JG001795.
- Tremblay, B., E. Levesque, and S. Boudreau. 2012. Recent expansion of erect shrubs in the Low Arctic: Evidence from Eastern Nunavik. Environmental Research Letters 7 (3):035501. doi:10.1088/1748-9326/7/3/035501.
- Verbyla, D. 2008. The greening and browning of Alaska based on 1982–2003 satellite data. Global Ecology & Biogeography 17:547–55. doi:10.1111/j.1466-8238.2008.00396.x.
- Verbyla, D. 2015. Remote sensing of interannual boreal forest NDVI in relation to climatic conditions in interior Alaska. Environmental Research Letters 10:125016. doi:10.1088/1748-9326/10/12/125016.
- Vose, R. S., M. Squires, D. Arndt, I. Durre, C. Fenimore, and K. Gleason. 2017. Deriving historical temperature and precipitation time series for Alaska climate divisions via climatologically aided interpolation. Journal of Service Climatology 10 (1). https://www.stateclimate.org/sites/default/files/upload/pdf/journal-articles/2017-Ross-etal.pdf.
- Walker, D. A., H. E. Epstein, G. J. Jia, A. Balser, C. Copass, E. J. Edwards, W. A. Gould, J. Hollingsworth, J. Knudson, H. A. Maier, and A. Moody. 2003. Phytomass, LAI, and NDVI in northern Alaska: Relationships to summer warmth, soil pH, plant functional types, and extrapolation to the circumpolar Arctic. Journal of Geophysical Research 108 (D2):8169. doi:10.1029/2001JD000986.
- Walker, D. A., H. E. Epstein, M. K. Raynolds, P. Kuss, M. A. Kopecky, G. V. Frost, and G. V. Matyshak. 2012. Environment, vegetation and greenness (NDVI) along the North America and Eurasia Arctic transects. Environmental Research Letters 7 (015504):17. doi:10.1088/1748-9326/7/1/015504.
- Walker, X., and J. F. Johnstone. 2014. Widespread negative correlations between black spruce growth and temperature across topographic moisture gradients in the boreal forest. Environmental Research Letters 9:064016. doi:10.1088/1748-9326/9/6/064016.
- Walker, X., M. C. Mack, and J. F. Johnstone. 2015. Stable carbon isotope analysis reveals widespread drought stress in boreal black spruce forests. Global Change Biology 21:3102–13. doi:10.1111/gcb.12893.
- Walsh, J. E., P. A. Bieniek, B. Brettschneider, E. S. Euskirchen, R. Lader, and R. L. Thoman. 2017. The exceptionally warm winter of 2015–16 in Alaska: Attribution and anticipation. Journal of Climate 30:2069–88. doi:10.1175/JCLI-D-16-0473.1.
- Weijers, S., R. Pape, J. Loffler, and I. H. Myers-Smith. 2018. Contrasting shrub species respond to early summer temperatures leading to correspondence of shrub growth patterns. Environmental Research Letters 13 (3):0340050. doi:10.1088/1748-9326/aaa5b8.
- Wendler, G., B. Moore, and K. Galloway. 2014. Strong temperature increase and shrinking sea ice in arctic Alaska. The Open Atmospheric Science Journal 8:7–15. doi:10.2174/1874282301408010007.
- Wendler, G., and M. Suhlski. 2009. A century of climate change for Fairbanks, Alaska. Arctic 62:295–300. doi:10.14430/arctic149.
- Wilmking, M., G. P. Juday, V. A. Barber, and H. S. J. Zald. 2004. Recent climate warming forces contrasting growth responses of white spruce at treeline in Alaska through temperature thresholds. Global Change Biology 10:1724–36. doi:10.1111/gcb.2004.10.issue-10.
- Wilson, S. D., and C. Nilsson. 2009. Arctic alpine vegetation change over 20 years. Global Change Biology 15:1676–84. doi:10.1111/gcb.2009.15.issue-7.