
ABSTRACT
Shrubification of arctic tundra is a well-recognized phenomenon, and it can be particularly rapid in moist habitats. Reindeer grazing can inhibit shrubification, but grazing impacts on mire vegetation have been overlooked. We studied grazing effects on plant communities and Salix lapponum in oroarctic mires at the border of Finland and Norway. We compared plant community structure and S. lapponum abundance and traits between (1) grazed fens (Finland); (2) experimental exclosures (Finland), where reindeer have been kept out for 13 years; and (3) nongrazed fens (Norway). Grazing effect on shrubification was assessed using the Normalized Difference Vegetation Index (NDVI) and leaf area index (LAI). We did not find a uniform direction of vegetation change connected to the exclosure treatment, and grazing treatments were overlapping in multivariate ordination. Neither NDVI nor LAI indicated clear differences. Instead, significant results were revealed in total abundance of species groups and in S. lapponum traits. The cover of bryophytes was significantly lower under free grazing. Reindeer grazing reduced the abundance, height, and flowering and increased leaf N concentration of S. lapponum. We conclude that reindeer grazing controls willows and affects total abundance of important species groups, and plant community structure is resistant to grazing effects in oroarctic mires.
Introduction
A major part of the circumpolar arctic tundra and northern boreal regions is grazed and trampled by either semi-domestic or wild reindeer (Rangifer tarandus) populations. Reindeer are known to modify tundra vegetation and soil processes, but ecosystem responses to grazing and trampling vary between habitats and vegetation types (see Bernes et al. [Citation2015] and Christie et al. [Citation2015] for recent reviews). In tundra heaths, reindeer grazing can increase nutrient cycling (Olofsson et al. Citation2001; Stark, Strömmer, and Tuomi Citation2002) and cause transitions between alternative vegetation states (van der Wal Citation2006). Lichen cover and biomass tend to decrease in grazed areas (van der Wal, Brooker, et al. Citation2001; den Herder, Kytöviita, and Niemelä Citation2003) because they are preferred winter forage for reindeer (Nieminen and Heiskari Citation1989) and are sensitive to trampling during snow-free seasons (Forbes Citation2010; J. Kumpula et al. Citation2014). In dry, nutrient-poor habitats, grazing results in transitions from a lichen-rich to a moss-dominated vegetation state (Manseau, Huot, and Crête Citation1996; van der Wal Citation2006). In more productive dry tundra habitats, grazing tends to increase primary production and often leads to a shift from moss- or dwarf shrub– to graminoid-dominated vegetation (Olofsson et al. Citation2001; Olofsson, Stark, and Oksanen Citation2004; Post and Pedersen Citation2008). The effects of reindeer grazing in wet tundra habitats are less studied. Though willows and sedges in peat-accumulating mires provide important forage in summer, little is known about grazing effects on mire vegetation.
Though reindeer grazing is an important form of land use, climate change is rapidly proceeding in Arctic regions (Overland et al. Citation2017), and the role of herbivory may change. Remote sensing observations have indicated “greening” (measured by the Normalized Difference Vegetation Index, NDVI) in central and eastern Siberia, Canadian tundra, and the north slope of Alaska since the early 1980s (Jia, Epstein, and Walker Citation2009; Epstein et al. Citation2012; Raynolds et al. Citation2013). It is important to note, however, that the greening pattern has not been uniform throughout the arctic tundra zone (Phoenix and Bjerke Citation2016). Observed greening links to increased growth, abundance, and range of deciduous shrubs, particularly tundra willows (Salix spp.; Forbes, Macias-Fauria, and Zetterberg Citation2010; Blok et al. Citation2011; Myers-Smith et al. Citation2011; Macias-Fauria et al. Citation2012). Alpine willows have expanded to higher elevations likely in response to warming (Myers‐Smith and Hik Citation2017), and recent evidence suggests climate change–induced expansion of evergreen ericoid dwarf shrubs in Scandinavian mountain regions (Vuorinen et al. Citation2017; Vowles, Gunnarsson, et al. Citation2017). Shrub expansion can result in several positive feedbacks to climate change, such as decreases in surface reflectance (albedo; Blok et al. Citation2011) and increases in winter soil temperatures (Myers‐Smith and Hik Citation2013), both of which can further enhance shrub growth. However, reindeer grazing can inhibit climate change–induced shrub expansion (Olofsson et al. Citation2009; Ravolainen et al. Citation2014) because deciduous shrubs are a preferred food source for reindeer during summer (Nieminen and Heiskari Citation1989; Klein Citation1990).
As recently noted by Martin et al. (Citation2017) and Vowles, Lovehave, et al. (Citation2017), research on shrub expansion and reindeer grazing impacts is limited geographically and in terms of vegetation types. Northern mires (bogs and fens) comprise large carbon reservoirs and play a major role in regulating global carbon cycle and climate (Yu Citation2012). The capacity of ungulate herbivores to alter carbon dynamics in arctic mires has recently been recognized (Falk et al. Citation2015; Stark and Ylänne Citation2015). Herbivores can mediate ecosystem responses to warming and alter carbon dynamics in arctic tundra and northern mires through their effects on vegetation and soil processes (Ward et al. Citation2007; Cahoon et al. Citation2012; Laiho, Penttilä, and Fritze Citation2017). Given that northern mires represents approximately one third (500 ± 100 gigatons) of estimated global soil carbon reservoirs (Yu Citation2012), grazing-induced changes in arctic and oroarctic mire vegetation could have significant implications for the global carbon budget (Stark and Ylänne Citation2015). Although mires are important feeding habitats for many herbivore species, studies of grazing effects on mire vegetation and particularly on carbon budget are still rare.
Here, we present results from a long-term (13-year) experiment on the impact of reindeer grazing on mire vegetation. The study sites locate in sedge- and willow-dominated fens across the border of Finland and Norway. The border has been fenced since the late 1950s to prevent reindeer entering winter pastures in Norway during summer. We compared plant community structure between (1) grazed fens (Finland); (2) experimental exclosures (Finland), where reindeer have been kept out for 13 years; and (3) nongrazed fens (Norway). In addition, we compare several growth characteristics and flowering of Salix lapponum, the main willow species in the study area and a key reindeer forage species in summer, according to local reindeer herders (Juha Magga, pers. comm.). Other Salix species (mainly S. glauca, S. phylicifolia) occur sparsely, whereas S. lapponum is found on all mire sites in the area and forming continuous thickets in most favorable sites. Results of an earlier short-term (4-year) study of the same experiment showed no significant effects on vegetation cover or on S. lapponum height (Kitti, Forbes, and Oksanen Citation2009). We hypothesize that after a longer period (13 years) of reindeer exclusion, the grazing impacts have dissipated and vegetation has already become more similar to that in nongrazed fens on the Norwegian side. We further expect that reindeer exclusion will have enhanced the growth and reproductive success of willows and that increased abundance and size of willows will be reflected as higher NDVI values. Alternatively, the legacy of reindeer grazing pressure could still be present in the mire vegetation, either as continued suppression of willow growth or in vegetation composition.
Materials and methods
The study area
The Jauristunturit study area is located in the Fennoscandian oroarctic tundra zone (Virtanen et al. Citation2016). The experiment was carried out at ten study sites near the border of Finland and Norway (68°49ʹ N, 23°49ʹ E, 450–510 m.a.s.l.) in a non-permafrost region (). The mean annual air temperature in the closest (27 km southwest of the study area) meteorological observation station (Enontekiö, Näkkälä, 68°36ʹ N, 23°35ʹ E, 370 m.a.s.l.) was −1.3°C and annual precipitation was 456 mm during the years 2001–2012 (Finnish Meteorological Institute, open data). The mean temperature of the warmest month (July) was +13.4 °C and that of the coldest month (February) was −14.6 °C. Snow cover persists on average for 152 days. The climate is slightly colder than indicated by the meteorological station data, due to the ca. 100-m higher elevation. The landscape is a mosaic of Betula nana–Cladina-type heaths and fjells (Virtanen, Oksanen, and Razzhivin Citation1999) and peat-accumulating fens. One characteristic feature of the studied fens is the abundance of S. lapponum, a willow species subject to summer grazing by reindeer. Other dominant species of the fens are sedges, such as Carex rostrata, Carex rotundata, and Eriophorum angustifolium. Among bryophytes, Sphagnum riparium, Sphagnum lindbergii, Sphagnum teres, Paludella squarrosa, and Warnstorfia sarmentosa are characteristic.
In the mid-1950s, a 3-m-high reindeer fence was built along the Finnish–Norwegian border. In the study area, the Finnish side of the fence belongs to the Näkkälä reindeer herding district, and it is grazed mainly in summer. In early summer, reindeer migrate to higher hills and mires and feed on new shoots of willows and graminoids. Reindeer feeding on willows is selective browsing of young leaves, shoots, and flowers, whereas graminoids are typically grazed to the ground. In this article, we refer to both feeding patterns. The grazing pressure in summer is approximately 10–12 reindeer per square kilometer over the 150-km2 district (Kitti, Forbes, and Oksanen Citation2009). From the late 1970s to the mid-1990s, the Finnish side was used also as a winter pasture (T. Kumpula Citation2006).
The Norwegian side is a traditional winter range for migratory herds of reindeer, and summer grazing (by Finnish reindeer) has been ultimately prohibited by the fence building in the late 1950s. In winter, reindeer feed mainly on lichens in dry habitats (Nieminen and Heiskari Citation1989), if they are available (Helle and Jaakkola Citation2008; J. Kumpula et al. Citation2014). Therefore, the studied fens in Norway are virtually nongrazed year-round. It is important to bear in mind, however, that the nongrazed Norwegian plots are not similarly fenced and some occasional minor grazing may have taken place. The reindeer fence along the national border prevents reindeer entering winter pasture during summer, and it is an experimental exclusion of reindeer summer grazing. This was a true manipulation of the grazing regime that completely divided reindeer culture in two parts of a wilderness area. The reindeer fence along the national border has been used as an experimental design in many studies of grazing impacts (e.g., Käykhö and Pellikka Citation1994; T. Kumpula Citation2006; Cohen et al. Citation2013), and it is widely recognized as uniquely valuable for long-term study of grazing effects. Presumably, the starting point in the 1950s was similar in terms of summer grazing in all studied fens, because of their close proximity (). However, at least since the 1950s, reindeer have been kept out of the Norwegian side in summer.
Figure 1. Locations of study sites across the national border with reindeer fence between Finland and Norway. Reindeer grazing pressure is lower and missing during summer on the Norwegian side, where abundance of lichens on dry tundra gives a whitish tone in the false-color image. The Finnish side has a historical legacy of high grazing pressure throughout the year, indicated by the lack of lichen cover, and is now used as summer pasture imposing high grazing pressure on mire habitats.
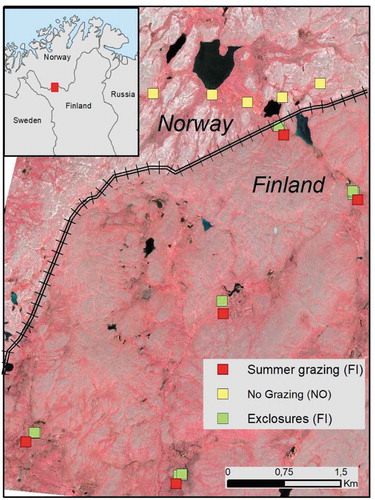
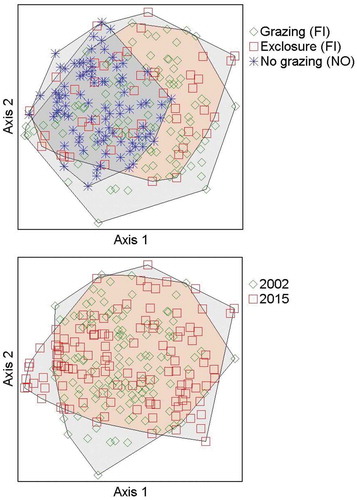
Figure 2. Grazing treatments have overlapping ranges with the nongrazed Norwegian subplots that have less variation in a two-dimensional nonmetric multidimensional scaling ordination. (a) Data from exclosure subplots in 2002 (before the effect of exclosure) and grazed subplots in 2015 combined as one group (Finland, grazed). Finland: Exclosures consist of subplots in exclosures in 2015. Norway: Nongrazed area consists of subplots in Norwegian fens in 2002 and 2015. (b) Combined data from 2002 and 2015 show nearly complete overlap; the range of vegetation variation is similar between years. Combinations of different years and grazing regimes are shown in more detail in Appendix 4.
Experimental design and fieldwork in 2002 and 2006
An exclosure experiment was established in 2002. Kitti, Forbes, and Oksanen (Citation2009) described the details of experimental design and only the main aspects are summarized here. During summer 2001 and winter 2002, ten separate fens were selected as study sites with local reindeer herders, five sites on both sides of the border fence. At each site in Finland, three exclosures (5 m × 5 m) were built, and three freely grazed plots were established and permanently marked with plastic pipes. Exclosures effectively prevent reindeer grazing and trampling, though smaller vertebrate herbivores, such as arctic hare (Lepus timidus), willow ptarmigan (Lagopus lagopus), and rodents, can freely enter. In Norway, three plots per site were established and marked permanently with plastic pipes. Thus, three grazing treatment levels are included: (1) free reindeer grazing and trampling that mainly takes place in summer (FI), (2) exclusion of reindeer grazing since 2002 (FI), and (3) no reindeer grazing since the 1950s (NO). In July 2002, abundance of all plant species was estimated using the point intercept method (100 points per 0.25-m2 subplot) and S. lapponum height measurements were made in exclosures (FI) and in nongrazed plots (NO). The height of S. lapponum was recorded by measuring the height of uppermost shoots (maximum of five measurements per subplot). In 2006, only vascular plant species were estimated with the point intercept method and S. lapponum heights were measured again in all subplots, including freely grazed plots (FI). One site from both Finland and Norway was excluded from analysis by Kitti, Forbes, and Oksanen (Citation2009) due to disparate vegetation type.
Repetition of vegetation sampling in 2015
We repeated the vegetation measurements described above in late July 2015. We did not manage to relocate two of the original Norwegian sites, and at most remaining sites it was not possible to exactly relocate each original subplot (0.25 m2). In such cases, we randomly selected three subplots from each 5 m × 5 m plot (n = 39). In all cases, we ensured that the same rules of subplot selection were employed, in terms of distance from the edge of the 5 m × 5 m plot and between subplots. The cover of each species was estimated in all subplots (n = 117) using the point intercept method (100 points per 0.25-m2 subplot). All mosses and vascular plants were identified to species level. Hepatics in the order Jungermanniales were treated collectively as one unit, but Aneura pinguis and Marchantia polymorpha were identified to the species level. For Salix spp. and B. nana, we counted each touch with the pin, but for other vascular plant and bryophyte species, we recorded only one hit per pin. In the earlier study by Kitti, Forbes, and Oksanen (Citation2009) bryophytes, ericoid dwarf shrubs, B. nana, and willows were counted similarly, but they counted multiple pin hits for the remainder of vascular plants that we counted by single hits. This discrepancy in counting pin hits in the different years potentially had a minor influence on the results; in our experience, multiple pin hits are not common and are often difficult to judge in a comparable manner. Species inside a subplot but not touched by the pin were given a value of 0.1 counts in all inventories. Hereafter we refer to point intercept data as “abundance.”
Growth and catkin production measurements in 2015
We measured the height of uppermost shoots of all separate willow shrubs (S. lapponum) and calculated their averages for each plot (n = 45), because we could not relocate earlier subplot measurements. This makes the measures of our hypothesized increase in willow height conservative, because the earlier measures depicted average maximum height at subplots, whereas we averaged over all willows in the plots. In addition, we collected ten to twenty willow leaves per plot from the midsection of the highest annual shoots. We pressed the leaves and used LAMINA (Bylesjö et al. Citation2008) to determine the mean leaf area (mm2). We also collected approximately ten annual shoots per plot. After drying at 70°C for 48 hours, we measured leaf nitrogen concentration (% of dry mass) from two leaf tissue subsamples (~0.01 g) per plot using LECO FP-528 Nitrogen/Protein Determinator.
We counted the number of fertile female plants and average number of flowering catkins (fruit bodies) per plant in each plot to study the reproductive success of willows. Because sex ratios in the genus Salix are often female biased (Crawford and Balfour Citation1983; Myers-Smith and Hik Citation2012) and we detected very few senescent male catkins, we counted only fertile female plants and catkins. Because we did not manage to relocate two of the original sites in Norway, we measured S. lapponum heights and collected leaves and catkins from two new sites that had general characteristics similar to those of the other sites.
Normalized Difference Vegetation Index and leaf area index
We compared NDVI and leaf area index (LAI) between grazing treatments to assess the impact of reindeer grazing on vegetation greenness. NDVI is a commonly used vegetation index that quantifies vegetation intensity from multispectral remote sensing imagery. NDVI is calculated between the near-infrared channel (which vegetation strongly reflects) and red channel (which vegetation absorbs). NDVI values were measured from WorldView-3 very high resolution satellite images (July 2015) with a spatial resolution of 1.24 m in multispectral channels (DigitalGlobe Inc., Longmont, CO). NDVI values were averaged over 9-pixel grids inside the exclosures (FI), over the freely grazed plots (FI), and in the original nongrazed plots (NO) that we managed to relocate in the field. For new nongrazed plots, where willows were measured in 2015, we averaged NDVI values over 49-pixel grids to make our hypothesized pattern of higher NDVI values in nongrazed fens conservative.
LAI (one-sided leaf surface area/ground area) indicates the amount of leaf area in an ecosystem. LAI can be retrieved from satellite data sets, and it is often used in monitoring tundra vegetation along with NDVI (e.g., Walker et al. Citation2003; Blok et al. Citation2011). In the Jauristunturit study area, LAI was measured indirectly in situ with an LAI-2200 Plant Canopy Analyzer (LI-COR Inc., Lincoln, NE). The device estimates LAI from light transmittance measurements above and below the canopy at five zenith angles (7°, 22°, 38°, 52°, and 68°) made with a fisheye optical sensor (LI-COR Inc. Citation2010). The instrument applies a model of radiative transfer in vegetative canopies to calculate the leaf area index. LAI was measured in grazed plots and exclosures in July 2016. The LAI value is a difference in light levels above and below the canopy. We took one measurement above and five below the canopy at four points in each plot (i.e., five above–below pairs per point). The LAI value for each plot is an average of twenty values (i.e., twenty above–below pairs).
Statistical analysis
Nomenclature follows Hämet-Ahti et al. (Citation1998) for vascular plants and Laaka-Lindberg, Anttila, and Syrjänen (Citation2009) for bryophytes. In cases where all individual pin hits were not identified to the species level or there were inconsistencies in species identification between years, we grouped plants to the genus level. Mosses of the family Mniaceae were combined into one group, and liverworts (Hepaticae) were treated as one group (except Aneura pinguis and Marchantia polymorpha). Due to difficulties in identification of sterile and hybrid Carex species in the field, C. limosa, C. magellanica, and C. rariflora were treated collectively (C. limosa coll.), and C. aquatilis ×bigelowii was combined with C. aquatilis.
Data availability and quality differed between the separate tests (Appendix 1). Vegetation patterns and the main directions of change of community composition were analyzed with nonmetric multidimensional scaling (NMDS) using combined 2002 and 2015 subplot-level species data sets. We excluded the 2006 data from NMDS because bryophytes were not surveyed that year. In order to standardize data between different inventories, we applied a Wisconsin double standardization transformation on vegetation data sets—that is, adjusting each species abundance to its maximum value and then adjusting all species values to proportions of plot total—and arcsine square root transformation of these values. Transformation was made separately for 2002 and 2015 vegetation data sets, which emphasizes changes in community composition and evens out possible differences between data sets and in personal perceptions of pin interceptions by different workers. NMDS was performed using the Sørensen (Bray-Curtis) distance measure. The effect of exclosure treatment on plant community structure was tested against free grazing treatment using a two-factorial permutation multivariate analysis of variance (PERMANOVA; Anderson Citation2001) using site as a second factor; that is, for five different mires. Because our interest was in grazing treatment, rather than random effects of mires, only grazing effects are reported. This was done for all species together and for bryophytes and vascular plants separately. We used the program PC-ORD 7.04 (McCune and Mefford Citation2016) for NDMS and PERMANOVA.
We tested differences between grazed sites, exclosures, and nongrazed sites in the abundance of plant functional and taxonomic groups using the 2015 point frame data. We divided the vegetation data into the following groups: all bryophytes, Sphagnum mosses, non-sphagnaceous mosses, hepatics, Salix spp., forbs, Carex spp., and Eriophorum spp. and averaged their point intercepts for each plot. On a species level, we tested the effect of grazing treatment levels on B. nana. We used a linear mixed effects model, in which a three-level grazing treatment was a fixed factor (grazed, exclosure, nongrazed) and site was included as a random factor. Approximate normality of the model residuals was assessed by graphical inspection of histograms and q–q plots, and a square root or logarithm transformation was applied when normality assumptions were violated (square root transformation for hepatics and Eriophorum spp; log transformation for Salix spp. and B. nana). Analyses were performed in R 3.4.3 (R Core Team Citation2017), and we used the “nlme” package’s (Pinheiro et al. Citation2017) lme() function for linear mixed effects models. The lsmeans package (Lenth Citation2016) was used to obtain t ratios and Tukey-adjusted p values for pairwise comparisons of the three grazing treatment levels when treatment was significant in the model.
The same model was used to test the abundance, height, leaf nitrogen concentration, and reproductive success of S. lapponum, as well as NDVI and LAI. We further compared S. lapponum height and Salix spp. (S. glauca, S. lapponum, and S. phylicifolia) total abundance over time (2002, 2006, and 2015). For these comparisons we included year in the model as a fixed factor and the interaction of year and grazing treatment level. Square root transformation was used for Salix abundance and number of female plants and log transformation was used for catkin number to approximate the normal distribution.
Results
Results in ordinations
The two-dimensional NMDS ordination had a high correlation between ordination distances and distances in the original n-dimensional space (R2 = 0.482). Common minerotrophic moss species, such as Straminergon stramineum and Sphagnum teres together with the focal willow species Salix lapponum, characterized the bulk of the plots in a wide central area of the ordination. Certain mainly site-specific features added dispersion of plots in the ordination. Radiating toward different corners of the ordination, Sphagnum riparium, C. rostrata, Eriophorum angustifolium, and Aulacomnium palustre showed the most distinct patterns among species to separate groups of plots from the center of the ordination (see Appendices 2 and 3 for further details). All grazing treatments were overlapping (), and we did not find any uniform directions of change in vegetation connected to the exclosure treatment; that is, the exclosure plots did not move toward nongrazed plots as expected (Appendix 4). In particular, grazed subplots (FI) and exclosures (FI) had widely overlapping ranges. The nongrazed Norwegian subplots had less variation in the NMDS than the Finnish exclosures and grazed subplots that were together spread more widely in the ordination. This separation of some grazed and exclosure plots apart from nongrazed Norwegian plots mainly reflected differences in shrub abundance. In the ordination, dwarf shrubs (Andromeda polifolia, B. nana, Empetrum nigrum ssp. hermaphroditum, and Vaccinium spp.) were more common in the Finnish sites that were separated from the nongrazed subplots in Norway, where abundance of Salix lapponum was high (Appendix 3). In addition, mosses characteristic of bog hummocks (Aulacomniun palustre, Dicranum spp., and Polytrichum spp.) and certain sedges (C. rotundata and Eriophorum angustifolium) were almost totally confined to some Finnish subplots.
The PERMANOVA analysis for Finland 2015 data with exclosures and grazed plots showed significant differences in plant community structure between treatments (F = 1.7747, p = .043), although NMDS failed to separate exclosures and grazed subplots. The analysis showed significant effects of grazing specifically on vascular plant communities (F = 2.4242, p = .02), whereas grazing did not affect bryophyte community structure (F = 1.1358, p = .319).
Abundance estimates of plant groups, NDVI, and LAI
We used the 2015 point intercept data to compare the abundances of plant groups between grazing treatment levels (, ). We found a significant effect of treatment on total abundance of bryophytes (p = .026), which was greatest in nongrazed fens. The effect was particularly pronounced in the case of hepatics (p = .004). They were significantly more abundant in nongrazed plots than in grazed plots (Tukey’s test, p = .038) and in the exclosures compared to grazed plots (Tukey’s test, p = .021). No significant differences were found between exclosures and nongrazed plots. On average, the abundances of Sphagnum mosses and non-sphagnaceous mosses were also greatest in nongrazed fens in Norway, though the effect of treatment was not significant.
Table 1. Analysis of variance results of treatment effects (Finland grazed, Finland exclosures, Norway nongrazed) from linear mixed effect models for abundances of different plant functional and taxonomic groups. Abundance was estimated in July 2015 using a point intercept method.
The average abundance of Salix spp. was greatest in nongrazed plots, and it was doubled in the exclosures compared to the grazed plots. However, there was much variation, and this effect of treatment was not quite significant (p = .085). Grazing treatment level showed no significant effects on abundances of B. nana, forbs, or Carex spp. However, grazing treatment level did have a significant effect on the abundance of cottongrasses (mainly E. angustifolium; p = .025). On average, cottongrasses were least abundant in nongrazed fens in Norway.
No significant differences in NDVI and LAI were found. On average, however, NDVI was highest in nongrazed fens (). In Finnish sites, both mean NDVI and LAI () were higher in exclosures compared to grazed plots, although the differences were not significant.
Figure 3. Abundances of different plant functional and taxonomic groups (a)–(i) in grazed plots, exclosures (Finland), and nongrazed (Norway) plots in July 2015. The abundance of plant groups has been estimated by a point intercept method. (j) Normalized Difference Vegetation Index in July 2015 and (k) leaf area index measured in July 2016. Leaf area index was measured only in exclosures and grazed plots (Finland).
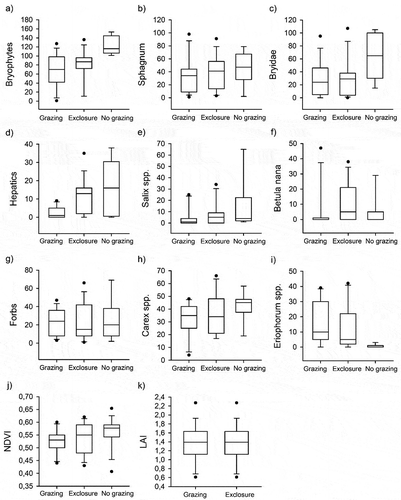
Figure 4. Changes in mean (±SE) (a) Salix lapponum height and (b) Salix spp. abundance over the study period (2002, 2006, and 2015).
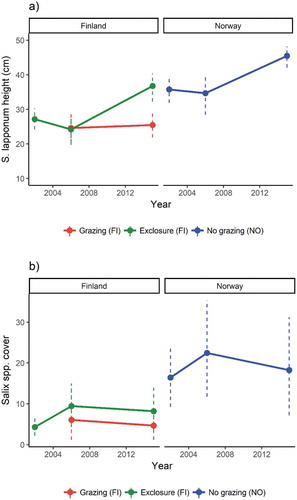
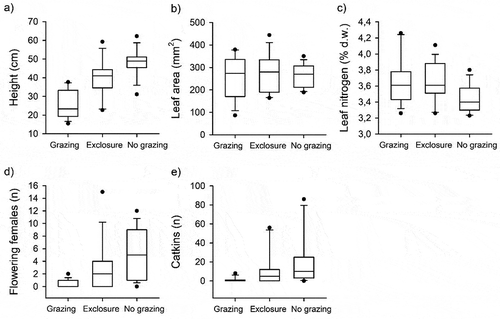
Figure 5. Comparisons of Salix lapponum (a) height (cm), (b) leaf area (mm2), (c) leaf nitrogen concentration (% of dry mass), (d) number of fertile female plants, and (e) number of flowering catkins, and between grazed sites and exclosures (Finland) and nongrazed sites (Norway) measured in 2015.
Abundance, size, and reproduction of Salix
As expected, both grazing treatment level (p < .001) and study year (p < .001) had significant effects on S. lapponum height (). A significant Year × Grazing interaction (p = .019) was also found. From 2002 to 2006 both grazed and exclosure plots in Finland had lower willow height and abundance than nongrazed fens in Norway (). In 2015, the abundance of Salix spp. in the exclosures had reached the values of nongrazed plots, and grazed plots still had supressed abundance. Willow height showed a similar response, but the nongrazed treatment willows appeared also to have gained more height on average.
Table 2. Analysis of variance results from linear effect models for S. lapponum height and Salix spp. abundance over time (2002, 2006, and 2015).
In 2015, willows (S. lapponum) were significantly taller in nongrazed plots (NO) compared to grazed plots (FI; Tukey’s test, p = .0014; ). They were also significantly higher in exclosures versus grazed plots (Tukey’s test, p < .0001), but there was no significant difference between exclosures and nongrazed plots. We did not find significant differences in the leaf area (cm2) of willows (p > .05; ) between treatments. However, there was a general significant effect of grazing treatment on leaf nitrogen concentration (p = .048). On average, leaf nitrogen concentration was lowest in nongrazed fens.
Table 3. Analysis of variance results of treatment effects (Finland grazed, Finland exclosures, Norway nongrazed) from linear mixed effect models for Salix lapponum height, leaf area, nitrogen concentration, and flowering traits measured in July 2015.
We found significant differences in the number of fertile female plants (p < .0001) and the number (p = .0004) and weight (p = .003) of female catkins between treatments. Fertile female plants were significantly more abundant in nongrazed plots in Norway compared to grazed plots in Finland (Tukey’s test, p = .0114). They also produced significantly more catkins in nongrazed fens than in grazed fens (Tukey’s test, p = .0166).
Discussion
Different types of wetlands form an integral part of northern boreal and arctic landscapes. However, changes in ecosystem structures, such as main vegetation characters, could alter the functioning of these important ecosystems. Reindeer grazing is one major factor to regulate northern plant communities and ecosystem balance. We examined the effect of reindeer grazing on sedge- and willow-dominated fens, a typical oroarctic wetland type in Finnish Lapland. By comparison between areas with historical differences in grazing and with experimental exclosures, we found minor effects of grazing on plant community structure as a whole but clear impacts on some functional plant groups and on the growth and reproduction of S. lapponum.
Grazing effects on mire plant communities
In the NMDS ordination, the nongrazed subplots in Norway had less variation in plant community structure, whereas they were overlapping with the Finnish grazed and exclosure subplots. Some grazed and exclosure subplots in Finland were, however, separated in the ordination from the nongrazed Norwegian plots, and a part of this separation may have resulted from more intensive grazing effects at these sites, and other site-specific factors may have contributed as well. In fact, grazing impact is not supported by the observed changes in these sites during the 13 years of reindeer exclusion, because the experimental plots did not move in any consistent way toward the nongrazed subplots in the ordination. Instead of grazing-controlled patterns, the ordination revealed gradients in mire vegetation related to variation in groundwater influence (minerotrophy) and wetness; that is, common gradients repeatedly found in mire vegetation analyses. Nevertheless, the permutation test of distance matrix between exclosures and freely grazed plots did reveal a significant effect. These results indicate that in oroarctic wetlands, reindeer have only limited influence on plant community structure and that site-specific hydrological factors are more important. Instead of overarching impact on community structure as a whole, we found that reindeer grazing effects were confined to certain plant groups.
Bryophytes, particularly hepatics, were significantly more abundant in nongrazed fens in Norway than in grazed fens in Finland. Mosses constitute a less-preferred food source for reindeer (Danell et al. Citation1994), but Sphagnum mosses and hepatics are particularly sensitive to trampling (Studlar Citation1980; Arnesen Citation1999). Presumably, trampling has negatively affected bryophyte cover in grazed fens in our study area, but redistribution of nitrogen via feces and urine can also have a negative impact on moss layer (van der Wal et al. Citation2004). Indeed, in wet high-arctic tundra habitats, grazing and trampling have been observed to reduce moss layer depth (van der Wal, van Lieshout, and Loonen Citation2001), total bryophyte cover (van der Wal et al. Citation2007), and biomass (Falk et al. Citation2015; Mosbacher et al. Citation2019). In dry tundra habitats, exclusion of reindeer grazing often leads to an increase in the cover of both deciduous and evergreen shrubs at the expense of mosses (Pajunen, Oksanen, and Virtanen Citation2011; Vowles, Gunnarsson et al. Citation2017).In our study sites, the pattern of bryophytes differed from those found in previous studies, because they were most abundant in nongrazed fens, where willows have also increased in size and abundance.
The reduction in moss layer depth can increase soil temperature and support graminoid growth in arctic moss-dominated environments (van der Wal, van Lieshout, and Loonen Citation2001; van der Wal and Brooker Citation2004). Rhizomatous graminoids, such as sedges (Carex spp.) and cottongrasses (Eriophorum spp.), are tolerant to trampling (Arnesen Citation1999; Forbes, Ebersole, and Strandberg Citation2001) and may benefit from reindeer grazing (Henry Citation1998; Olofsson et al. Citation2001; Eskelinen and Oksanen Citation2006; Ravolainen et al. Citation2011). In our study area, reindeer grazing has maintained sedge-dominated vegetation, and the abundances of Salix spp. and B. nana were lowest in grazed areas, on average. Cottongrasses (mainly E. angustifolium) were less abundant in nongrazed fens in Norway compared to all plots in Finland, but we did not find significant differences in total abundance of sedges (Carex spp.) between treatments. At the individual species level, C. rotundata and E. angustifolium were almost totally confined to Finnish sites, whereas C. rostrata was most abundant in nongrazed plots in Norway. Sedges are eaten by reindeer and some of these differences thus may be caused by reindeer grazing. This remains highly speculative, however, because it is possible that some other differences between the areas affect abundance of these species. Falk et al. (Citation2015) showed that a short-term (3-year) exclusion of muskox (Ovibos moschatus) decreased the abundance of Eriophorum scheuchzeri tillers in a high-arctic mire. Reindeer feed highly selectively in summer (Nieminen and Heiskari Citation1989), and plant species may respond differently to grazing when some species are selected over others.
Grazing effects on Salix lapponum
Though reindeer grazing effects on mire plant community structure were subtle, grazing evidently affects the growth and reproductive success of S. lapponum. Many previous studies have shown that reindeer grazing reduces the growth of tundra willows (e.g., den Herder, Virtanen, and Roininen Citation2004, Citation2008; Pajunen Citation2009), and 10 to 13 years of herbivore exclusion is sufficient to result in a significant increase in tundra shrub cover (Pajunen, Virtanen, and Roininen Citation2012). As expected, reindeer herbivory in summer suppresses the growth of S. lapponum in oroarctic mires as well. Results from a short-term study (Kitti, Forbes, and Oksanen Citation2009) of the same sites showed no significant effect of 4-year exclusion of reindeer grazing on S. lapponum height, but after 13 years, willows had recovered inside the experimental exclosures. In addition to growth response, willows produced less catkins in grazed fens compared to exclosures and nongrazed fens, which reduces the capacity of willows to colonize new areas. Reindeer use developing willow catkins as a food source (Klein Citation1990), but the lower number of catkins in grazed fen areas likely relates to decreased growth and indicates generally poor fitness of willows. Lower height and number of catkins in grazed fens indicates that S. lapponum responds to grazing by allocating resources to vegetative growth at the expense of sexual reproduction. Brookshire et al. (Citation2002) observed that willows (S. boothii, S. geyeriana) subjected to grazing by wild ungulates and sheep did not flower until 2 years after herbivore exclusion. In our study area, reproductive success was studied only in 2015; therefore, we can only conclude that the 13-year time span was sufficient for revival of sexual reproduction of S. lapponum after reindeer exclusion.
Ungulate herbivores also affect ecosystem N cycling though several processes (Singer and Schoenecker Citation2003). Reindeer deposit feces and urine, which may accelerate N mineralization rates and increase N availability for plants (Olofsson et al. Citation2001; Stark, Strömmer, and Tuomi Citation2002). Increased N availability can be reflected in higher N concentration in plant leaves (Ritchie, Tilman, and Knops Citation1998). Indeed, we found that S. lapponum growing in the grazed fens in Finland had higher leaf N concentrations compared to willows growing in nongrazed fens in Norway. This suggests that reindeer grazing could increase the nutritional value of willows, which may lead to selection of previously grazed plants. Indeed, reindeer feeding is elsewhere observed to be more intense on small, young willow sprouts compared to old willows (den Herder, Virtanen, and Roininen Citation2004). This pattern in leaf N content may also reflect resource allocation between compensatory growth and chemical defense. Plant species have two alternative strategies against herbivory: (1) a well-developed regrowth capacity and a poor defense mechanism and (2) a well-developed defense mechanism and a poor regrowth capacity (van der Meijden, Wijn, and Verkaar Citation1988). Skarpe and Wal (Citation2002) found that simulated browsing increased leaf N content but had no effect on the concentration of phenolic compounds in the leaves of deciduous dwarf shrub Salix polaris, indicating that under herbivory, S. polaris allocates recourses to growth rather than defense. In the absence of grazing, willows may in turn invest more on defense compounds (Dormann and Skarpe Citation2002), resulting in lowered palatability, and allocate nutrients in reproduction rather than vegetative growth. In our study, we did not measure defense compounds and therefore it remains speculative whether reindeer affect the chemical defense of S. lapponum. However, in every case, elevated N concentration in S. lapponum leaves was still observed 13 years after reindeer exclusion, indicating that grazing has a long-lasting impact on N balance of S. lapponum.
Shrubification of oroarctic mires
Expansion of deciduous tall shrubs in arctic tundra landscapes is a well-documented phenomenon (e.g., Myers-Smith et al. Citation2011, Citation2015; Vowles and Björk Citation2018). Reindeer grazing can inhibit climate change–induced shrub expansion (Olofsson et al. Citation2009; Ravolainen et al. Citation2014) and hence act to maintain resilience in ecosystems (Kaarlejärvi, Hoset, and Olofsson Citation2015). In the Finnish side of our study area, reindeer grazing evidently controls the growth and sexual reproduction of willows, and reindeer can be regarded as a bioengineer that regulates shrub expansion. In the absence of this control, the height of willows increased in nongrazed fens in Norway during the study period. It is likely that climate change has accentuated the growth of willows, because climate records show significant warming in northern Lapland for the past few decades (Kivinen et al. Citation2017). Soil moisture is another key factor affecting shrub growth in tundra habitats (Myers-Smith et al. Citation2015). Due to lack of temperature-induced moisture limitation, climate change–induced expansion of deciduous shrubs could be particularly rapid in moist and wet habitats, such as riparian sites (Ravolainen et al. Citation2011; Ackerman et al. Citation2017). Indeed, no evidence of larger-scale expansion of tall deciduous shrubs in Fennoscandian forest–tundra habitats exists, despite climate warming (Vuorinen et al. Citation2017; Maliniemi et al. Citation2018).
In this study, we combined remote sensing data with field measurements of Salix growth and abundance. The difference in S. lapponum height and abundance between the exclosures and grazed fens was clear and was also visible in some drone images taken in 2016 and in digital elevation models derived from orthomosaics (Timo Kumpula, unpublished; Appendix 5). However, we did not find significant differences in NDVI values derived from very high-resolution WorldView-3 images of exclosures and grazed areas. Despite the evident changes in S. lapponum growth and abundance in exclosures, it appears that even 13 years is not long enough to see significant differences in NDVI between grazed and nongrazed fens. Another possible explanation is that we could not detect differences in NDVI because sedge-dominated grazed fen areas have dense green vegetation as well. However, the results of NDVI were confirmed by the observation that LAI values did not show significant differences between exclosures and grazed areas. The increased height and number of flowering catkins suggest that 13 years of reindeer exclusion was enough for recovery of individual willows from grazing, though actual greening was not realized as yet. Furthermore, because we did not find significant difference between Finnish and Norwegian plots, it remains uncertain whether satellite-derived NDVI values of fens may indicate higher shrub cover in Norway, where reindeer summer grazing has been prohibited since the late 1950s. Cohen et al. (Citation2013) compared temporal variation in NDVI values between Finnish summer pastures and Norwegian winter pastures, and one of their test areas overlaps with our study sites. They found that when the snowmelt started in the test area, NDVI increased faster on the Norwegian side, indicating denser shrub vegetation. However, later during the growing season, NDVI values were higher in the Finnish summer pasture. They included all vegetation types in their analysis, and higher NDVI values in summer pasture were probably due to higher lichen cover in the Norwegian winter pasture. In our study, we compared only fens, and the lack of inference is possibly due to the low number of sites. A different approach of mapping different types of mire areas across the border fence for NDVI could help to unravel how this most commonly used index performs in observing shrubification in northern mires.
Reindeer grazing can affect also ecosystem carbon dynamics and modulate ecosystem responses to climate change in boreal forest and arctic tundra habitats (e.g., Väisänen et al. Citation2014; Köster et al. Citation2018; Ylänne et al. Citation2018). However, studies focusing on grazing impacts on carbon dynamics particularly in mire ecosystems are still few and were mainly conducted in high-arctic mires with continuous permafrost (Falk et al. Citation2014, Citation2015; Mosbacher et al. Citation2019). It is difficult to draw conclusions regarding grazing impacts on carbon dynamics, because processes and mechanisms affecting ecosystem carbon dynamics are complex and largely dependent on habitat type. For example, in shrub and graminoid tundra in Greenland, an ecosystem CO2 sink function became stronger after exclusion of muskox (O. moschatus) and followed the increase of tall shrubs (Cahoon et al. Citation2012), whereas in sedge- and grass-dominated mires, grazing exclusion resulted in a decrease in the CO2 sink function (Falk et al. Citation2015). Reindeer can also increase methane emissions from mires via fecal deposition (Laiho, Penttilä, and Fritze Citation2017). The impacts of reindeer grazing on carbon dynamics in willow-dominated mires remain uncertain. However, considering the special role of bryophytes (especially Sphagnum) in carbon dynamics of northern mires, our observation of reduced abundance of bryophytes in freely grazed mires indicates that reindeer grazing might suppress formation of peat and, hence, carbon sink. In line with this expectation, bryophytes specifically increased the carbon pool in response to muskox exclusion in arctic mires (Mosbacher et al. Citation2019).
Conclusion
Fennoscandian oroarctic mire plant communities as a whole are resistant to reindeer grazing effects that could only be revealed with detailed individual species and species group abundance ca. 55 years after cessation of grazing. Reindeer grazing particularly affects the abundance of bryophytes and controls the abundance, size, and flowering of S. lapponum. Individual willows are able to tolerate moderately intensive reindeer grazing, however. In grazed fens, willows are still present and able to recover after grazing removal. In addition, nitrogen concentration of S. lapponum was elevated in grazed fens after 13 years of reindeer exclusion. Despite the recovery of willows inside the exclosures, 13 years of grazing exclusion was not enough to result in changes observable by NDVI and LAI, and greening in terms of increased vegetation cover was not realized in exclosures. These results indicate that early phases of vegetation changes potentially leading to shrubification of oroarctic and arctic mires may take place undetected even by the most accurate satellite-derived NDVI.
Supplemental Material
Download Zip (1.2 MB)Acknowledgments
We thank Heidi Kitti and Jari Oksanen for providing data from 2002 and 2006. We thank Karoliina Heiskanen, Pasi Korpelainen, Andrew Martin, Franziska Rosaroja, and Veikko Tahvanainen for their assistance in fieldwork. Henni Ylänne gave valuable advices for the selection of statistical analyses. Juha Magga and Samuli Näkkälä are thanked for invaluable advice and help with many practical issues during fieldwork. Comments from the editor and three anonymous referees significantly improved the article.
Disclosure statement
No potential conflict of interest was reported by the authors.
Supplementary material
Supplemental data for this article can be accessed on the publisher’s website.
Related Research Data
References
- Ackerman, D., D. Griffin, S. E. Hobbie, and J. C. Finlay. 2017. Arctic shrub growth trajectories differ across soil moisture levels. Global Change Biology 23:4294–302. doi:10.1111/gcb.13677.
- Anderson, M. J. 2001. A new method for non‐parametric multivariate analysis of variance. Austral Ecology 26 (1):32–46.
- Arnesen, T. 1999. Vegetation dynamics following trampling in rich fen at Sølendet, Central Norway; a 15 year study of recovery. Nordic Journal of Botany 19:313–27. doi:10.1111/j.1756-1051.1999.tb01118.x.
- Bernes, C., K. A. Bråthen, B. C. Forbes, J. D. Speed, and J. Moen. 2015. What are the impacts of reindeer/caribou (Rangifer tarandus L.) on arctic and alpine vegetation? A systematic review. Environmental Evidence 4:4. doi:10.1186/s13750-014-0030-3.
- Blok, D., G. Schaepman-Strub, H. Bartholomeus, M. M. Heijmans, T. C. Maximov, and F. Berendse. 2011. The response of Arctic vegetation to the summer climate: Relation between shrub cover, NDVI, surface albedo and temperature. Environmental Research Letters 6:035502. doi:10.1088/1748-9326/6/3/035502.
- Brookshire, J. E., B. J. Kauffman, D. Lytjen, and N. Otting. 2002. Cumulative effects of wild ungulate and livestock herbivory on riparian willows. Oecologia 132:559–66. doi:10.1007/s00442-002-1007-4.
- Bylesjö, M., V. Segura, R. Y. Soolanayakanahally, A. M. Rae, J. Trygg, P. Gustafsson, S. Jansson, and N. R. Street. 2008. LAMINA: A tool for rapid quantification of leaf size and shape parameters. BMC Plant Biology 8:82. doi:10.1186/1471-2229-8-82.
- Cahoon, S. M., P. F. Sullivan, E. Post, and J. M. Welker. 2012. Large herbivores limit CO2 uptake and suppress carbon cycle responses to warming in West Greenland. Global Change Biology 18:469–79. doi:10.1111/j.1365-2486.2011.02528.x.
- Christie, K. S., J. P. Bryant, L. Gough, V. T. Ravolainen, R. W. Ruess, and K. D. Tape. 2015. The role of vertebrate herbivores in regulating shrub expansion in the Arctic: A synthesis. BioScience 65:1123–33. doi:10.1093/biosci/biv137.
- Cohen, J., J. Pulliainen, C. B. Ménard, B. Johansen, L. Oksanen, K. Luojus, and J. Ikonen. 2013. Effect of reindeer grazing on snowmelt, albedo and energy balance based on satellite data analyses. Remote Sensing of Environment 135:107–17. doi:10.1016/j.rse.2013.03.029.
- Crawford, R. M. M., and J. Balfour. 1983. Female predominant sex ratios and physiological differentiation in arctic willows. The Journal of Ecology 71:149–60. doi:10.2307/2259968.
- Danell, K., P. M. Utsi, R. T. Palo, and O. Eriksson. 1994. Food plant selection by reindeer during winter in relation to plant quality. Ecography 17:153–58. doi:10.1111/j.1600-0587.1994.tb00088.x.
- den Herder, M., M. M. Kytöviita, and P. Niemelä. 2003. Growth of reindeer lichens and effects of reindeer grazing on ground cover vegetation in a Scots pine forest and a subarctic heathland in Finnish Lapland. Ecography 26:3–12. doi:10.1034/j.1600-0587.2003.03211.x.
- den Herder, M., R. Virtanen, and H. Roininen. 2004. Effects of reindeer browsing on tundra willow and its associated insect herbivores. Journal of Applied Ecology 41:870–79. doi:10.1111/j.0021-8901.2004.00952.x.
- den Herder, M., R. Virtanen, and H. Roininen. 2008. Reindeer herbivory reduces willow growth and grouse forage in a forest-tundra ecotone. Basic and Applied Ecology 9:324–31. doi:10.1016/j.baae.2007.03.005.
- Dormann, C. F., and C. Skarpe. 2002. Flowering, growth and defence in the two sexes: Consequences of herbivore exclusion for Salix polaris. Functional Ecology 16 (5):649–56. doi:10.1046/j.1365-2435.2002.00662.x.
- Epstein, H. E., M. K. Raynolds, D. A. Walker, U. S. Bhatt, C. J. Tucker, and J. E. Pinzon. 2012. Dynamics of aboveground phytomass of the circumpolar Arctic tundra during the past three decades. Environmental Research Letters 7:015506. doi:10.1088/1748-9326/7/1/015506.
- Eskelinen, A., and J. Oksanen. 2006. Changes in the abundance, composition and species richness of mountain vegetation in relation to summer grazing by reindeer. Journal of Vegetation Science 17:245–54. doi:10.1111/j.1654-1103.2006.tb02443.x.
- Falk, J. M., N. M. Schmidt, and L. Ström. 2014. Effects of simulated increased grazing on carbon allocation patterns in a high arctic mire. Biogeochemistry 119:229–44. doi:10.1007/s10533-014-9962-5
- Falk, J. M., N. M. Schmidt, T. R. Christensen, and L. Ström. 2015. Large herbivore grazing affects the vegetation structure and greenhouse gas balance in a high arctic mire. Environmental Research Letters 10:045001. doi:10.1088/1748-9326/10/4/045001.
- Forbes, B.C. 2010. Reindeer herding. In Arctic Biodiversity Trends 2010 – Selected indicators of change, 86–88. Arctic Council, CAFF International Secretariat, Akureyri, Iceland.
- Forbes, B. C., J. J. Ebersole, and B. Strandberg. 2001. Anthropogenic disturbance and patch dynamics in circumpolar arctic ecosystems. Conservation Biology 15:954–69. doi:10.1046/j.1523-1739.2001.015004954.x.
- Forbes, B. C., M. Macias-Fauria, and P. Zetterberg. 2010. Russian Arctic warming and ‘greening’ are closely tracked by tundra shrub willows. Global Change Biology 16:1542–54. doi:10.1111/j.1365-2486.2009.02047.x.
- Hämet-Ahti, L., J. Suominen, T. Ulvinen, and P. Uotila, eds. 1998. Retkeilykasvio [Field Flora of Finland]. 4th. Helsinki, Finland: Finnish Museum of Natural History, Botanical Museum.
- Helle, T. P., and L. M. Jaakkola. 2008. Transitions in herd management of semi-domesticated reindeer in northern Finland. Annales Zoologici Fennici 45(2):81–101. https://www.jstor.org/stable/23736861.
- Henry, G. H. 1998. Environmental influences on the structure of sedge meadows in the Canadian High Arctic. Plant Ecology 134:119–29. doi:10.1023/A:100973161.
- Jia, G. J., H. E. Epstein, and D. A. Walker. 2009. Vegetation greening in the Canadian Arctic related to decadal warming. Journal of Environmental Monitoring 11:2231–38. doi:10.1039/B911677J.
- Kaarlejärvi, E., K. S. Hoset, and J. Olofsson. 2015. Mammalian herbivores confer resilience of Arctic shrub‐dominated ecosystems to changing climate. Global Change Biology 21:3379–88. doi:10.1111/gcb.12970.
- Käykhö, J., and P. Pellikka. 1994. Remote sensing of the impact of reindeer grazing on vegetation in northern Fennoscandia using SPOT XS data. Polar Research 13 (1):115–24. doi:10.1002/ldr.2868.
- Kitti, H., B. C. Forbes, and J. Oksanen. 2009. Long-and short-term effects of reindeer grazing on tundra wetland vegetation. Polar Biology 32:253–61. doi:10.1007/s00300-008-0526-9.
- Kivinen, S., S. Rasmus, K. Jylhä, and M. Laapas. 2017. Long-term climate trends and extreme events in Northern Fennoscandia (1914–2013). Climate 5:16. doi:10.3390/cli5010016.
- Klein, D. R. 1990. Variation in quality of caribou and reindeer forage plants associated with season, plant part, and phenology. Rangifer 10:123–30. doi:10.7557/2.10.3.841.
- Köster, K., E. Köster, F. Berninger, J. Heinonsalo, and J. Pumpanen. 2018. Contrasting effects of reindeer grazing on CO2, CH4, and N2O fluxes originating from the northern boreal forest floor. Land Degradation & Development 29:374–81. doi:10.1002/ldr.2868.
- Kumpula, J., M. Kurkilahti, T. Helle, and A. Colpaert. 2014. Both reindeer management and several other land use factors explain the reduction in ground lichens (Cladonia spp.) in pastures grazed by semi-domesticated reindeer in Finland. Regional Environmental Change 14:541–59. doi:10.1007/s10113-013-0508-5.
- Kumpula, T. 2006. Very high resolution remote sensing data in reindeer pasture inventory in northern Fennoscandia. In Reindeer management in Northernmost Europe, 167–85. Berlin, Heidelberg: Springer. doi:10.1007/3-540-31392-3_9.
- Laaka-Lindberg, S., S. Anttila, and K. Syrjänen, eds. 2009. Suomen uhanalaiset sammalet [Threatened bryophytes of Finland]. 1st. Helsinki, Finland: Finnish Environment Institute.
- Laiho, R., T. Penttilä, and H. Fritze. 2017. Reindeer droppings may increase methane production potential in subarctic wetlands. Soil Biology and Biochemistry 113:260–62. doi:10.1016/j.soilbio.2017.06.017.
- Lenth, R. V. 2016. Least-squares means: The R package lsmeans. Journal of Statistical Software 69:1–33. doi:10.18637/jss.v069.i01.
- LI-COR, Inc. 2010. LAI-2200 Plant Canopy Analyzer. Instruction Manual, 204. LI-COR, Inc. Lincoln, Nebraska.
- Macias-Fauria, M., B. C. Forbes, P. Zetterberg, and T. Kumpula. 2012. Eurasian Arctic greening reveals teleconnections and the potential for novel ecosystems. Nature Climate Change 2:613–18. doi:10.1038/nclimate1558.
- Maliniemi, T., J. Kapfer, P. Saccone, A. Skog, and R. Virtanen. 2018. Long‐term vegetation changes of treeless heath communities in northern Fennoscandia: Links to climate change trends and reindeer grazing. Journal of Vegetation Science 29:469–79. doi:10.1111/jvs.12630.
- Manseau, M., J. Huot, and M. Crête. 1996. Effects of summer grazing by caribou on composition and productivity of vegetation: Community and landscape level. Journal of Ecology 84:503–13. doi:10.2307/2261473.
- Martin, A. C., E. S. Jeffers, G. Petrokofsky, I. Myers-Smith, and M. Macias-Fauria. 2017. Shrub growth and expansion in the Arctic tundra: An assessment of controlling factors using an evidence-based approach. Environmental Research Letters 12:085007. doi:10.1088/1748-9326/aa7989.
- McCune, B., and M. J. Mefford. 2016. PC-ORD. Multivariate analysis of ecological data. Version 7.04. MjM Software. Gleneden Beach, Oregon.
- Mosbacher, J. B., A. Michelsen, M. Stelvig, H. Hjermstad-Sollerud, and N. M. Schmidt. 2019. Muskoxen modify plant abundance, phenology, and nitrogen dynamics in a High Arctic fen. Ecosystems 22 (5):1095–107. doi:10.1007/s10021-018-0323-4.
- Myers-Smith, I. H., B. C. Forbes, M. Wilmking, M. Hallinger, T. Lantz, D. Blok, K. D. Tape, M. Macias-Fauria, U. Sass-Klaassen, E. Lévesque, et al. 2011. Shrub expansion in tundra ecosystems: Dynamics, impacts and research priorities. Environmental Research Letters 6:045509. doi:10.1088/1748-9326/6/4/045509.
- Myers-Smith, I. H., and D. S. Hik. 2012. Uniform female-biased sex ratios in alpine willows. American Journal of Botany 99:1243–48. doi:10.3732/ajb.1200107.
- Myers‐Smith, I. H., and D. S. Hik. 2013. Shrub canopies influence soil temperatures but not nutrient dynamics: An experimental test of tundra snow–shrub interactions. Ecology and Evolution 3:3683–700. doi:10.1002/ece3.710.
- Myers‐Smith, I. H., and D. S. Hik. 2017. Climate warming as a driver of tundra shrubline advance. Journal of Ecology 106:547–60. doi:10.1111/1365-2745.12817.
- Myers-Smith, I. H., S. C. Elmendorf, P. S. Beck, M. Wilmking, M. Hallinger, D. Blok, K. D. Tape, S. A. Rayback, M. Macias-Fauria, B. C. Forbes, et al. 2015. Climate sensitivity of shrub growth across the tundra biome. Nature Climate Change 5:887. doi:10.1038/nclimate2697.
- Nieminen, M., and U. Heiskari. 1989. Diets of freely grazing and captive reindeer during summer and winter. Rangifer 9:17–34. doi:10.7557/2.9.1.771.
- Olofsson, J., H. Kitti, P. Rautiainen, S. Stark, and L. Oksanen. 2001. Effects of summer grazing by reindeer on composition of vegetation, productivity and nitrogen cycling. Ecography 24:13–24. doi:10.1034/j.1600-0587.2001.240103.x.
- Olofsson, J., L. Oksanen, T. Callaghan, P. E. Hulme, T. Oksanen, and O. Suominen. 2009. Herbivores inhibit climate‐driven shrub expansion on the tundra. Global Change Biology 15:2681–93. doi:10.1111/j.1365-2486.2009.01935.x.
- Olofsson, J., S. Stark, and L. Oksanen. 2004. Reindeer influence on ecosystem processes in the tundra. Oikos 105:386–96. doi:10.1111/j.0030-1299.2004.13048.x.
- Overland, J. E., E. Hanna, I. Hanssen-Bauer, S.-J. Kim, E. Walsh, M. Wang, U. S. Bhatt, and R. L. Thoman. 2017. Surface air temperatures. In State of the climate in 2016, Bulletin of the American Meteorological Society, ed. J. Blunden and D. S. Arndt, Vol. 98, 130–31. doi:10.1175/2017BAMSStateoftheClimate.1.
- Pajunen, A., R. Virtanen, and H. Roininen. 2012. Browsing‐mediated shrub canopy changes drive composition and species richness in forest‐tundra ecosystems. Oikos 121:1544–52. doi:10.1111/j.1600-0706.2011.20115.x.
- Pajunen, A. M. 2009. Environmental and biotic determinants of growth and height of arctic willow shrubs along a latitudinal gradient. Arctic, Antarctic, and Alpine Research 41 (4):478–85. doi:10.1657/1938-4246-41.4.478.
- Pajunen, A. M., J. Oksanen, and R. Virtanen. 2011. Impact of shrub canopies on understorey vegetation in western Eurasian tundra. Journal of Vegetation Science 22:837–46. doi:10.1111/j.1654-1103.2011.01285.x.
- Phoenix, G. K., and J. W. Bjerke. 2016. Arctic browning: Extreme events and trends reversing arctic greening. Global Change Biology 22:2960–62. doi:10.1111/gcb.13261.
- Pinheiro, J., D. Bates, S. DebRoy, and D. Sarkar and R Core Team. 2017. nlme: Linear and nonlinear mixed effects models. R package version 3.1-131. https://CRAN.Rproject.org/package=nlme>.
- Post, E., and C. Pedersen (2008). Opposing plant community responses to warming with and without herbivores. Proceedings of the National Academy of Sciences 105:12353–58. doi:10.1073/pnas.0802421105.
- R Core Team. 2017. R: A language and environment for statistical computing. Vienna, Austria: R Foundation for Statistical Computing. https://www.R-project.org/.
- Ravolainen, V. T., K. A. Bråthen, N. G. Yoccoz, J. K. Nguyen, and R. A. Ims. 2014. Complementary impacts of small rodents and semi‐domesticated ungulates limit tall shrub expansion in the tundra. Journal of Applied Ecology 51:234–41. doi:10.1111/1365-2664.12180.
- Ravolainen, V. T., K. A. Bråthen, R. A. Ims, N. G. Yoccoz, J. A. Henden, and S. T. Killengreen. 2011. Rapid, landscape scale responses in riparian tundra vegetation to exclusion of small and large mammalian herbivores. Basic and Applied Ecology 12:643–53. doi:10.1016/j.baae.2011.09.009.
- Raynolds, M. K., D. A. Walker, D. Verbyla, and C. A. Munger. 2013. Patterns of change within a tundra landscape: 22-year Landsat NDVI trends in an area of the northern foothills of the Brooks Range, Alaska. Arctic, Antarctic, and Alpine Research 45:249–60. doi:10.1657/1938-4246-45.2.249.
- Ritchie, M. E., D. Tilman, and J. M. Knops. 1998. Herbivore effects on plant and nitrogen dynamics in oak savanna. Ecology 79 (1):165–77. doi:10.1890/0012-9658(1998)079[0165:HEOPAN]2.0.CO;2.
- Singer, F. J., and K. A. Schoenecker. 2003. Do ungulates accelerate or decelerate nitrogen cycling? Forest Ecology and Management 181 (1–2):189–204. doi:10.1016/S0378-1127(03)00133-6.
- Skarpe, C., and R. V. D. Wal. 2002. Effects of simulated browsing and length of growing season on leaf characteristics and flowering in a deciduous Arctic shrub, Salix polaris. Arctic, Antarctic, and Alpine Research 34 (3):282–86. doi:10.1080/15230430.2002.12003495.
- Stark, S., and H. Ylänne. 2015. Grazing in Arctic peatlands—An unknown agent in the global carbon budget. Environmental Research Letters 10:051002. doi:10.1088/1748-9326/10/5/051002.
- Stark, S., R. Strömmer, and J. Tuomi. 2002. Reindeer grazing and soil microbial processes in two suboceanic and two subcontinental tundra heaths. Oikos 97:69–78. doi:10.1034/j.1600-0706.2002.970107.x.
- Studlar, S. M. 1980. Trampling effects on bryophytes: Trail surveys and experiments. Bryologist 83:301–13. doi:10.2307/3242440.
- Väisänen, M., H. Ylänne, E. Kaarlejärvi, S. Sjögersten, J. Olofsson, N. Crout, and S. Stark. 2014. Consequences of warming on tundra carbon balance determined by reindeer grazing history. Nature Climate Change 4:384. doi:10.1038/nclimate2147.
- van der Meijden, E., M. Wijn, and H. J. Verkaar. 1988. Defence and regrowth, alternative plant strategies in the struggle against herbivores. Oikos 51:355–63. doi:10.2307/3565318.
- van der Wal, R. 2006. Do herbivores cause habitat degradation or vegetation state transition? Evidence from the tundra. Oikos 114:177–86. doi:10.1111/j.2006.0030-1299.14264.x.
- van der Wal, R., R. Brooker, E. Cooper, and R. Langvatn. 2001. Differential effects of reindeer on high Arctic lichens. Journal of Vegetation Science 12:705–10. doi:10.2307/3236911.
- van der Wal, R., R. D. Bardgett, K. A. Harrison, and A. Stien. 2004. Vertebrate herbivores and ecosystem control: Cascading effects of faeces on tundra ecosystems. Ecography 27 (2):242–52. doi:10.1111/eco.2004.27.issue-2.
- van der Wal, R., and R. W. Brooker. 2004. Mosses mediate grazer impacts on grass abundance in arctic ecosystems. Functional Ecology 18:77–86. doi:10.1111/j.1365-2435.2004.00820.x.
- van der Wal, R., S. Sjögersten, S. J. Woodin, E. J. Cooper, I. S. Jónsdóttir, D. Kuijper, T. A. D. Fox, and A. D. Huiskes. 2007. Spring feeding by pink‐footed geese reduces carbon stocks and sink strength in tundra ecosystems. Global Change Biology 13:539–45. doi:10.1111/j.1365-2486.2006.01310.x.
- van der Wal, R., S. M. van Lieshout, and M. J. Loonen. 2001. Herbivore impact on moss depth, soil temperature and arctic plant growth. Polar Biology 24:29–32. doi:10.1007/s003000000170.
- Virtanen, R., L. Oksanen, T. Oksanen, J. Cohen, B. C. Forbes, B. Johansen, J. Käyhkö, J. Olofsson, J. Pulliainen, and H. Tømmervik. 2016. Where do the treeless tundra areas of northern highlands fit in the global biome system: Toward an ecologically natural subdivision of the tundra biome. Ecology and Evolution 6:143–58. doi:10.1002/ece3.1837.
- Virtanen, R., L. Oksanen, and V. Razzhivin. 1999. Topographic and regional patterns of tundra heath vegetation from northern Fennoscandia to the Taimyr Peninsula. Acta Botanica Fennica 167:29–83.
- Vowles, T., B. Gunnarsson, U. Molau, T. Hickler, L. Klemedtsson, and R. G. Björk. 2017. Expansion of deciduous tall shrubs but not evergreen dwarf shrubs inhibited by reindeer in Scandes mountain range. Journal of Ecology 105:1547–61. doi:10.1111/1365-2745.12753.
- Vowles, T., C. Lovehav, U. Molau, and R. G. Björk. 2017. Contrasting impacts of reindeer grazing in two tundra grasslands. Environmental Research Letters 12:034018. doi:10.1088/1748-9326/aa62af.
- Vowles, T., and R. G. Björk. 2018. Implications of evergreen shrub expansion in the Arctic. Journal of Ecology. doi:10.1111/1365-2745.13081.
- Vuorinen, K. E., L. Oksanen, T. Oksanen, A. Pyykönen, J. Olofsson, and R. Virtanen. 2017. Open tundra persist, but arctic features decline—Vegetation changes in the warming Fennoscandian tundra. Global Change Biology 23:3794–807. doi:10.1111/gcb.13710.
- Walker, D. A., H. E. Epstein, G. J. Jia, A. Balser, C. Copass, E. J. Edwards, W. A. Gould, J. Hollingsworth, J. Knudson, H. A. Maier, et al. 2003. Phytomass, LAI, and NDVI in northern Alaska: Relationships to summer warmth, soil pH, plant functional types, and extrapolation to the circumpolar Arctic. Journal of Geophysical Research: Atmospheres 108:D2. doi:10.1029/2001JD000986.
- Ward, S. E., R. D. Bardgett, N. P. McNamara, J. K. Adamson, and N. J. Ostle. 2007. Long-term consequences of grazing and burning on northern peatland carbon dynamics. Ecosystems 10:1069–83. doi:10.1007/s10021-007-9080-5.
- Ylänne, H., J. Olofsson, L. Oksanen, and S. Stark. 2018. Consequences of grazer‐induced vegetation transitions on ecosystem carbon storage in the tundra. Functional Ecology 32 (4):1091–102. doi:10.1111/1365-2435.13029.
- Yu, Z. C. 2012. Northern peatland carbon stocks and dynamics: A review. Biogeosciences 9:4071–85. doi:10.5194/bg-9-4071-2012.