
ABSTRACT
Research has revealed contradictory responses of primary producers in Arctic lakes to increasing temperatures, making it unclear how future warming and climate change will alter lake productivity. We conducted a whole-lake manipulation to examine the effect of altered thermal structure on phytoplankton biomass in a lake in Greenland, one of the most rapidly warming regions of the world. Deepened lake mixing (from 4 to 8 m) in the experimental lake led to significant declines in phytoplankton biomass in the sediment traps despite warmer surface waters, indicating that changes in mixing depth may negate a positive, direct effect of warming on primary producer biomass. Light limitation (induced by deeper mixing) of phytoplankton played a greater role than temperature in structuring these Arctic lake phytoplankton communities. To put the manipulation in context, we surveyed twenty-four lakes across western Greenland to determine the strongest regional predictors of phytoplankton density. Across the landscape, lake chemistry and light attenuation in the epilimnion were the most important predictors of algal assemblages in the survey lakes. Though temperature can directly influence lake ecosystems, multiple factors will affect mixing depths of Arctic lakes, potentially leading to variable effects of warming on phytoplankton biomass and community structure.
Introduction
Amplification of climate change in the Arctic has led to rapid increases in average annual temperatures (Mayewski et al. Citation2014), inconsistent precipitation patterns (Bring et al. Citation2016), and historic lows in sea ice extent (Parkinson and DiGirolamo Citation2016). These broad-scale changes can translate into regional ecological change, which can have far-reaching consequences. Because lakes are the low point in the landscape, changes in ecosystem structure (temperature, clarity, water level) and function (primary production, biogeochemical cycling) integrate changes occurring in their surrounding catchments (Williamson, Saros, and Schindler Citation2009). Lakes are a dominant feature of the Arctic landscape, with 24 percent of the global lake area falling between latitudes of 60° to 69° N (Downing et al. Citation2006). Therefore, the Arctic is an important region in which to understand climate-driven lake ecosystem changes.
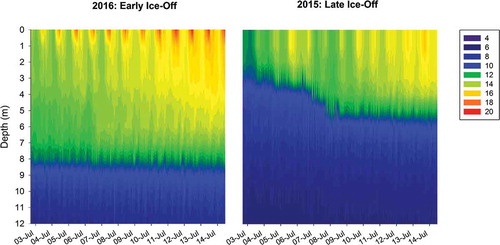
An important direct effect of increasing temperature on lakes is earlier loss of ice cover in the spring (Arp, Jones, and Grosse Citation2013; Butcher et al. Citation2015; Alexeev et al. Citation2016), a pattern that has been noted recently in the Arctic (Smejkalova, Edwards, and Dash Citation2016; Surdu, Duguay, and Prieto Citation2016). The length of the ice-free period of Arctic lakes may affect ecological patterns (e.g., lake thermal structure, nutrient availability, phytoplankton blooms, food web interactions) and productivity in these systems given the generally narrow time frame in which surface waters can interact with the atmosphere during the summer (Arp et al. Citation2015; Whiteford et al. Citation2016). Many investigators have suggested that longer ice-free conditions will stimulate earlier blooms of algae and thus greater primary production overall as a result of warmer water temperatures (Blenckner, Omstedt, and Rummukainen Citation2002; Sorvari, Korhola, and Thompson Citation2002; Smol et al. Citation2005). In addition to these direct effects of temperature, the timing of ice-out on Arctic lakes is also linked to thermal stratification patterns (Olsen, Anderson, and Knudsen Citation2012; Warner et al. Citation2018). In western Greenland in particular, earlier ice-off (in May) leads to a prolonged spring mixing period and hence deeper thermal stratification, whereas later ice-off (in mid–late June) leads to the rapid onset of subsequently shallower stratification (; also see Warner et al. Citation2018). Additionally, warmer surface waters have the potential to lead to deeper, warmer mixed layers over the course of the open-water season (Kraemer et al. Citation2015). These deeper, warmer waters may influence the trophic status of lakes by altering the production and community structure of biota (Adams, Crump, and Kling Citation2010), subsequently enhancing metabolism in these systems (Negandhi, Laurion, and Lovejoy Citation2016).
Figure 1. Thermal structure of a lake in southwest Greenland during the first two weeks of July in an early (2016) and a late (2015) ice-off year. These data are based on thermistor strings collecting data at 1-m intervals in the water column. Colored contours represent temperature changes (°C) throughout the water column over time.
Though temperature is an important abiotic factor controlling the physical structure of lakes, conflicting biotic responses to temperature exist in the literature. Recent work in German systems has suggested a positive relationship between phytoplankton biomass and temperature (Striebel et al. Citation2016). Data from satellite imagery suggest a positive relationship between surface water temperature and Chlorophyll-a (Chl-a), a proxy for phytoplankton biomass in some lakes, although the relationship is variable globally (Kraemer, Mehner, and Adrian Citation2017). Further, manipulative studies of lakes have noted greater primary production (Giling et al. Citation2017) or increased biomass of phytoplankton (Cantin et al. Citation2011) with the onset of deeper, warmer mixing layers.
Though increasing lake temperatures have some effect on phytoplankton growth in lakes, the mechanisms through which lake algae respond to changes in their environment are more complex. In terms of alternative temperature effect, warmer surface waters may actually stimulate herbivory (Berger et al. Citation2010; Boersma et al. Citation2016), suggesting strengthening top-down control of phytoplankton biomass by zooplankton. In Swedish lakes, phytoplankton biomass was more strongly controlled by grazing rates and nutrient availability than by any direct temperature effect (Zhang, Xu, and Hansson Citation2015). Further, zooplankton grazing suppresses phytoplankton biomass near surface waters but may promote increased autotrophic biomass in deeper mixed layers (Pannard, Planas, and Beisner Citation2015). Understanding the overall influence of earlier ice-off on biological interactions is less clear in Arctic lakes, because most studies of these effects focus on systems with much more complex food webs than typically seen in arctic freshwaters.
Other work suggests that light is a more important control on phytoplankton than temperature, especially in lakes with deeper mixed layers. In Lake Brunnsee, Germany, phytoplankton biomass during shallower mixing was controlled by sinking rates, whereas lower light conditions led to decreased phytoplankton biomass in deeper mixing conditions (Diehl et al. Citation2002). Experimental lake darkening (Batt et al. Citation2015) and deepening of the epilimnion (Berger et al. Citation2010) both resulted in declining phytoplankton biomass due to light limitation. Further, light limitation of photosynthetic rates and a 70 percent decline in phytoplankton biomass in Lake Erie was a result of deeper mixing during a low-ice year (Beall et al. Citation2016).
Changes in the abiotic structure of lakes can influence the size and community composition of phytoplankton of lake ecosystems during the open water season. Higher light availability in the mixed layer of lakes favor chrysophytes (Charvet, Vincent, and Lovejoy Citation2014), cryptophytes, and chlorophytes (Obryk et al. Citation2016), whereas low-light and nutrient-poor conditions can result in dinoflagellate dominance of lake communities (Charvet, Vincent, and Lovejoy Citation2014; Obryk et al. Citation2016). Typically, cyanobacteria thrive in warmer, more nutrient-rich lakes with shallow mixing depths (Hamilton, Salmaso, and Paerl Citation2016). Nevertheless, studies have also noted that cyanobacteria may dominate in more nutrient-poor systems with high levels of zooplankton grazing (Zhang, Xu, and Hansson Citation2015) or in warmer, deeper mixed layers under light-limiting conditions (Kovacs, Presing, and Voros Citation2016). Significant increases in the biomass of chlorophytes, dinoflagellates, diatoms, chrysophytes, and cryptophytes occurred due to experimental deepening of the mixed layer in a Canadian lake (Cantin et al. Citation2011).
Taken together, research on the response of phytoplankton to enhanced warming has produced a multitude of responses but no clear patterns in biomass or changes in autotrophic community structure. Given the potential for rapid change in lake thermal structure in the Arctic, there is a need to specifically evaluate controls on phytoplankton in lakes, including the effects of temperature, light, and nutrients. For this study, we assessed how climate-induced changes to lake thermal structure influence the success of the autotrophic community within Arctic lakes. Previous lake manipulations have resulted in increased productivity (Giling et al. Citation2017) or biomass (Cantin et al. Citation2011) of phytoplankton in lakes with deeper mixed layers. Additionally, shifts in phytoplankton community structure occur with deeper mixed layers (Cantin et al. Citation2011). Thus, our hypothesis was that deeper, warmer mixed layers in lakes would increase phytoplankton biomass and elicit shifts in dominant phytoplankton groups, especially chrysophytes and diatoms, which can thrive in deeper waters if light is limiting. If this is true, then across the landscape, the depth of the mixed layer, nutrient availability, and light should be the strongest predictors of community change in these Arctic lakes. In order to address these potential changes at multiple scales, we conducted (1) a whole-lake water column manipulation to experimentally deepen the surface mixed layer of a lake and (2) surveys of twenty-four lakes across western Greenland. We measured both physical and chemical attributes of these lakes, along with portions of the food web, to determine the most important drivers of phytoplankton in these systems.
Materials and methods
Study site description
This study was conducted in western Greenland in the vicinity of Kangerlussuaq (67°00′34.63″ N, 50°43′15.59″ W). The regional climate is low-arctic continental, with limited rainfall (~173 mm y−1) occurring mostly from May to September during the ice-free growing season. During the growing season, the mean air temperature is 10.2°C. The region is underlain by continuous permafrost with an active layer depth ranging from 20 to 90 cm. Western Greenland’s landscape is dominated by more than 20,000 lakes (Anderson et al. Citation2001), most of which are chemically dilute and have been experiencing declining dissolved organic carbon (DOC) concentrations over the last decade (Saros et al. Citation2015). Ice-off dates in the Kangerlussuaq region are variable (sometimes earlier and sometimes later than average) and depend strongly on a combination of temperature, solar insolation, precipitation, and permafrost thaw (Warner et al. Citation2018). Nevertheless, ice-off dates have occurred from 22 to 30 days earlier in years where late spring air temperatures were above average (Warner et al. Citation2018). This region of Greenland is part of the Kangerlussuaq International Science Support system that serves an international hub of research and logistical support throughout the area. As such, the field study took place with the support of the local community and no special permission was needed to access the lakes.
Whole-lake mixing depth experiment
An experimental manipulation of lake mixing depth was carried out using a before–after–control–impact design (Saros, Northington, Anderson, and Anderson Citation2016). An experimental lake (SS16) and an adjacent control lake (SS16b) were chosen due to their similar size and proximity to one another. Both lakes thermally stratify during the open water season with similar mixing depths (~4 m). The experimental lake was small (0.033 km2) with a maximum depth (Zmax) of 13 m, which is an ideal size for manipulation of the entire water column. The control lake was similar in area (0.022 km2) and depth (Zmax = 9.8 m) to the experimental lake. Additionally, both lakes were similar in chemical parameters () and hosted taxonomically comparable phytoplankton communities (Saros, Northington, Anderson, and Anderson Citation2016). Ice-off on the experimental lake occurred on 13 June in 2013 and 15 June in 2014, and ice-off on the control lake happened on 10 June 2013 and 12 June 2014 (Saros, Northington, Anderson, and Anderson Citation2016).
Table 1. Physical and chemical data from the epilimnia of the two lakes used in the whole-lake manipulation study during 2013 and 2014. The detection limit for DIN was 2 µg L−1; otherwise, values were below detection (bd).
Lakes were monitored with automated instrumentation for the same four-week period each year, complemented by manual water column sampling, as possible. Automated sampling started shortly after ice-off and spanned the period of thermally stratified conditions. The timing of early season manual sampling was the same in both years, whereas the timing of late season manual sampling differed between years (31 July 2013 and 15 August 2014) because it depended on the availability of helicopter support. During 2013 (“before”), both lakes were unmanipulated and were surveyed for physical, chemical, and biological data as described below. During 2014, the experimental lake was manipulated (“impact”), whereas the control lake was not (“control”) and served as a basis for comparison during the experiment. We used a solar-powered hydraulic lift system, or Solar Bee (Medora Corp., Dickinson, ND), to manipulate the mixing depth in the experimental lake. The Solar Bee system redistributes water from the lake bottom to the surface at a low rate to avoid turbulent flow and sediment resuspension. This is the same system used in other whole-lake manipulations that assessed the biological effects of mixing depth alterations (Cantin et al. Citation2011; Oullet Jobin and Beisner Citation2014; Sastri et al. Citation2014). We deployed the Solar Bee by helicopter on 15 June 2014 and anchored it at the deep point within the lake basin (13 m). Once anchored, the water intake pipe was lowered to 8 m, the target mixing depth. Once the system was in place, we activated the system on the evening of 17 June 2014 (Saros, Northington, Anderson, and Anderson Citation2016). This timing allowed for an immediate beginning of the manipulation after ice-out and prior to the establishment of summer stratification. The water column manipulation continued in the experimental lake until 15 August 2014, after which the Solar Bee was removed from the system (Saros, Northington, Anderson, and Anderson Citation2016).
Water temperatures and phytoplankton metrics were measured at high temporal resolution using automated sampling equipment. To track the thermal structure of both lakes over the two years of the experiment, thermistor strings (HOBO Pendant Temperature/Light Loggers, Onset Corp., Bourne, MA) were suspended in each lake after ice-out in 2013 and 2014 to track water temperature hourly at 1-m increments in the water column. Sediment traps were used to monitor changes to phytoplankton community structure, because they better integrate pelagic plankton over time compared to grab samples. Automated rotating sediment traps (TECHNICAP PPS 4/3, La Turbie, France) were installed at an 8-m depth in the experimental lake, whereas the trap in the control lake was at 7 m due to the shallower maximum depth of this lake. A new collection bottle in the trap rotated into position every five days, providing nine five-day composite samples from 19 June to 29 July in both years for both lakes. Rotation dates of the traps were kept the same in both years. Low lake water temperatures at the depth of the sediment trap (4°C–5.8°C) successfully preserved the samples, as demonstrated by prior work in this system (Saros, Northington, Anderson, and Anderson Citation2016). At the end of the summer season in both years, all phytoplankton samples were removed, preserved with Lugol’s iodine solution, and returned to the University of Maine for identification and enumeration.
Sediment traps are a common method of assessing chemical, physical, and biological components of lakes. Paleolimnological studies have used these traps to couple seasonal phytoplankton patterns with algal remains in varved lake sediments (Kienel et al. Citation2017), and contemporary studies use these traps to quantify lake phytoplankton dynamics over the course of the year (Caldwell Eldridge et al. Citation2013). The TECHNICAP traps used here have demonstrated success in capturing lake dynamics in various systems (Douglas, Rippey, and Gibson Citation2003; Saros, Northington, Anderson, and Anderson Citation2016; Kienel et al. Citation2017) and provide a long-term view of lake phytoplankton communities that cannot be demonstrated with infrequent grab sampling from the water column.
The experimental and control lakes were manually sampled on four occasions in 2013 and three occasions in 2014 for nutrients, DOC, and other water column parameters. Measures of water column temperature, dissolved oxygen (DO), pH, and conductivity were taken every meter from the surface to Zmax with a HydrolabVR DataSonde 5a (OTT Hydromet, Loveland, CO). After determining mixing patterns from the Hydrolab data in situ, we selected three depths for phytoplankton and nutrient sampling: a surface sample (0–3 m), an intermediate sample based usually around 1 percent photosynthetically active radiation (PAR; 5–8 m), and a deep sample (>8 m), which resulted in sampling depths of 2, 5, and 8 m in the experimental lake and 2, 4, and 7 m in the control lake in 2013 and 2014. An additional 10 m sample was added to the experimental lake collections in 2014 to account for deeper mixing. Water was sampled for these analyses using a Van Dorn sampler lowered to the depths specified; filtered samples were collected for dissolved inorganic nitrogen (NO3-N and NH4-N) and unfiltered samples were collected for total phosphorus (TP) and total nitrogen (TN). Additional water was collected from each depth for Chl-a analysis. Water for DOC analysis was sampled from the top 1 m of each lake.
Water samples were kept chilled at the field station after collection and transported back to the University of Maine on ice. Nutrients were analyzed within two weeks of our return from Greenland. Water column profiles of PAR were measured with a submersible profiling radiometer coupled with a deck radiometer (Biospherical Instruments Inc., San Diego, CA). PAR profiles were used to calculate the depth of 1 percent PAR attenuation. Zooplankton were collected using (125 µm) net tows through the entire water column and preserved with ethanol for enumeration. After all nutrient analyses and phytoplankton counts were complete, we used calculations of 1 percent PAR on each sampling day as a determination of the photic zone. Samples taken in the photic zone were averaged together, as were those found below the photic zone. Fish surveys were not conducted, but three-spined stickleback (Gasterosteus aculeatus L.) were seen during lake visits. Sticklebacks are common in Greenland lakes (Bergersen Citation1996; Anderson and Stedmon Citation2007), and their presence can be indirectly determined based on zooplankton community data (e.g., lakes dominated by rotifers contain fish vs. fishless lake communities dominated by cladocerans; Harmon et al. Citation2009).
Phytoplankton distributions across lakes
Though the experimental manipulation provides a mechanistic approach to phytoplankton changes, the Kangerlussuaq region provides more than 20,000 lakes with a variety of chemical, physical, and biological characteristics (Anderson et al. Citation2001, Citation2017). To broaden the scope of this study, we surveyed twenty-four additional lakes across the southwest Greenland landscape. The lakes in this survey spanned an approximately 100-km transect southwest from the leading edge of the Greenland Ice Sheet; coordinates of lakes may be found elsewhere (Northington and Saros Citation2016; Saros, Northington, Anderson, and Anderson Citation2016; Saros, Northington, Osburn et al. Citation2016). All lakes were sampled twice during the summer of 2013, once immediately after ice-off in June, and also during July when they were thermally stratified. Phytoplankton were collected at three depths in every lake using a Van Dorn bottle, preserved in Lugol’s iodine solution, and returned to the University of Maine for analysis. All survey lakes were also sampled for the same parameters as the experimental and control lakes, specifically, temperature, DO, pH, conductivity, nutrients, 1 percent PAR, and DOC. We also calculated average light intensities in the epilimnion using light attenuation coefficients (Kd) and mixing depth, while assuming a surface irrandiance of 1,400 µE m−2 s−1 (Tilzer and Goldman Citation1978), which was the average surface irradiance for this suite of Greenland lakes as determined by the surface radiometer during the light measurements described previously.
Laboratory analyses
Filtered water samples were analyzed for dissolved inorganic nitrogen (DIN; NH4-N + NO3-N) with flow injection analysis using the phenate (NH4-N) and cadmium reduction (NO3-N) methods (American Public Health Association, American Water Works Association, Water Environment Federation Citation2005) on a Lachat Quikchem 85 (Hach Company, Loveland, CO). Total nutrients (TN and TP) were determined from whole-water samples using persulfate digestion followed by the ascorbic acid (TP) and cadmium reduction methods (TN) on the Lachat flow injection analyzer (American Public Health Association, American Water Works Association, Water Environment Federation Citation2005). Chlorophyll-a (µg L−1) was determined by filtering a known volume of lake water from each depth onto GF/F filters, followed by extraction into 90 percent acetone. In this study, we use Chl-a as a measure of pigment concentration and not as a proxy for biomass given the impact of light environment on this metric (Felip and Catalan Citation2000). Extracts were analyzed on a Cary Varian 50 spectrophotometer and corrected for pheophytin using 0.1 N HCl (American Public Health Association, American Water Works Association, Water Environment Federation Citation2005). Epilimnetic water for DOC analysis was filtered using precombusted (500°C, 6 hours) 0.7-μm Whatman GF/F glass fiber filters (Anderson and Stedmon Citation2007). The filtrate was analyzed for DOC concentration using an OI Analytical Aurora 1030D TOC analyzer using wet chemical oxidation.
Sediment trap phytoplankton samples were counted using an Utermöhl settling chamber and microscopy. In the experimental lake in 2014, the initial five-day integrated sample (19–24 June) was contaminated with a brown precipitate that prevented enumeration, which did not appear in subsequent samples. As a result, the sediment trap data begin with the 26 June 2014 sample in the experimental lake. Dominant phytoplankton phyla were identified and enumerated for further analysis. Phytoplankton densities overall and for dominant phyla (cells mL−1) were calculated. Average phytoplankton densities in the photic zone (as determined by 1 percent PAR depth) were calculated for each of the additional twenty-four lakes surveyed in June and July 2013. Shape-based calculations of biovolume (µm3 mL−1) for the whole phytoplankton community and dominant phytoplankton phyla were also determined from the sediment trap samples. Many studies of lake phytoplankton alternate between the usage of biovolume estimates vs. Chl-a-based proxies of phytoplankton biomass. Here, we adopt the usage of biovolume because it is a more reliable indicator of autotrophic biomass than Chl-a when both light attenuation and intensity are variable across treatments (Felip and Catalan Citation2000). For example, under variable light, it is possible for biovolume to remain constant while the amount of Chl-a per cell can vary.
Zooplankton were identified using microscopy and separated into three major categories: copepods, cladocerans, and rotifers. Average abundance per water column tow was used, along with relative abundance of each category of zooplankton for analysis. No cladocerans were found in either lake for both sampling years; therefore, analyses focused only on copepods and rotifers.
Statistical analyses
For the before–after–control–impact lake manipulation experiment, we used an analysis of variance for year (2013 vs. 2014), treatment (experimental vs. control), and the interaction between treatment and year to determine significance of manipulation effects. A significant interaction of treatment and year indicated an effect of the manipulation on a given response variable. Biological response variables included phytoplankton density, phytoplankton biovolume, and zooplankton relative abundances. Environmental variables such as DO, Chl-a, specific conductance, 1 percent PAR depth, DIN, TP, TN, and enzyme activities were also assessed for changes due to the manipulation. Effects of the manipulation on individual diatom taxa can be found in a companion study (Saros, Northington, Anderson, and Anderson Citation2016). All data were tested for normality and, where necessary, were log10 transformed to meet normality assumptions. In order to have a balanced design for analyses, the control lake data from the sediment traps for 19 June 2014 were not included, because we did not have experimental lake counts for that same sampling period.
Canonical correspondence analysis (CCA) was used to generate axes of the most significant environmental factors that would explain densities of phytoplankton phyla across the twenty-four survey lakes in 2013 (Anderson et al. Citation2011). All data were tested for normality and log10 or log10 + 1 corrected to meet assumptions of the analyses. Relationships between environmental variables were analyzed using Spearman correlations to determine a subset of independent, uncorrelated variables (ρ < 0.50) for use in the CCA. Therefore, temperature, conductivity, DIN, TP, DOC, PAR, and average light were used to evaluate the density of phytoplankton phyla across the survey lakes. In these Greenland lakes, average light in the water column provides a proxy for the combined effects of epilimnion thickness, 1 percentPAR, and DOC on lake phytoplankton (Saros, Northington, Anderson, and Anderson Citation2016; Saros, Northington, Osburn et al. Citation2016). All analyses were conducted in R (v. 3.3.1) using the “akima,” “car,” and “vegan” packages.
Results
Whole-lake manipulation
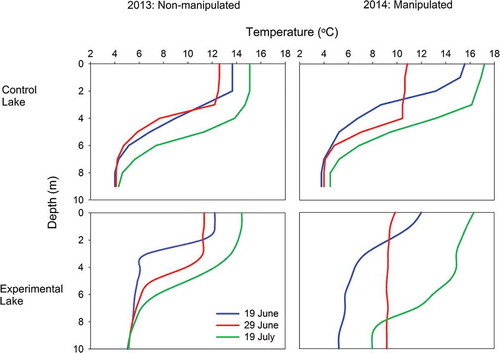
The manipulation of the experimental lake significantly deepened the mixing depth from 4 m in 2013 to 8 m in 2014, whereas the mixing depth of the control lake was consistent (~4 m) in both years (). In the experimental lake, the deepening of the mixed layer in 2014 resulted in a 50 percent reduction in light available to phytoplankton circulating throughout the epilimnion, relative to 2013 (Saros, Northington, Anderson, and Anderson Citation2016). It should be noted that 2014 was a warmer year, reflected in higher epilimnetic temperatures of both experimental lakes () and the control lake (Saros, Northington, Anderson, and Anderson Citation2016; Saros, Northington, Osburn et al. Citation2016).
Figure 2. Changes in control and experimental lake thermal structure during the open water seasons of 2013 and 2014. The experimental lake was manipulated in 2014.
In general, other than mixing depth, the physical and chemical lake parameters sampled manually were not affected by the manipulation in the experimental lake (), although TP was significantly higher (F1,10 = 10.9, p < .01) in both lakes during 2013 compared to 2014 (mean [SE], 2013: 10 µg L−1 ± 1 µg L−1; 2014: 6 µg L−1 ± 2 µg L−1). DIN in both lakes was dominated by NH4-N, with NO3-N generally below detection (<2 µg L−1). Water column Chl-a did not significantly change as a result of the manipulation in the experimental lake (F1,10 = 0.30, p = .60).
Though the control lake generally had higher phytoplankton density and biovolume than the experimental lake across the entire sampling period ( and ), the differences in phytoplankton density and biovolume were not significant between 2013 and 2014 for the control lake (F1,30 = 0.78, p = .39 and F1,30 = 0.55, p = .46, respectively). Total growing season density and biovolume of phytoplankton in the control lake increased 54 and 58 percent, respectively, from 2013 to 2014. Both lakes experienced cycles of phytoplankton abundance throughout the growing season of 2013, with peaks occurring in either late June or early July. Nevertheless, phytoplankton density showed a significant decline in 2014 in the experimental lake in response to the manipulation (; interaction F1,30 = 5.55, p = .03). Phytoplankton phyla in the experimental lake all responded in different ways to the manipulation. There was a significant decrease in chlorophyte (interaction F1,30 = 7.54, p = .01) and cyanobacteria (interaction F1,30 = 5.16, p = .03) densities, whereas dinoflagellate and diatom densities declined immediately after the manipulation but remained variable throughout the rest of the summer (Table S2). Chrysophytes alone showed a response to year (F1,30 = 11.56, p = .002), with 2014 having a higher density across both lakes.
Figure 3. Changes in the density (cells mL−1) of major phytoplankton phyla in the sediment trap of a control lake (top panel) and an experimentally manipulated lake (bottom panel) in southwest Greenland in 2013 and 2014. The experimental lake was manipulated in 2014.
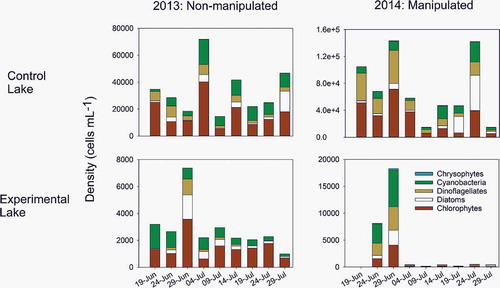
Figure 4. Changes in the biovolume (µm3 mL−1) of major phytoplankton phyla in the sediment trap of a control lake (top panel) and an experimentally manipulated lake (bottom panel) in southwest Greenland in 2013 and 2014. The experimental lake was manipulated in 2014.
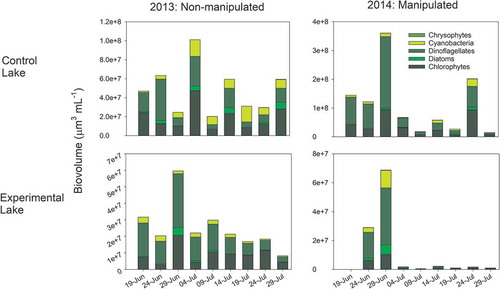
In 2014, prior to the manipulation of the experimental lake, the phytoplankton community was more evenly distributed, with cyanobacteria comprising approximately 37 percent of the density, 23 percent each for chlorophytes and dinoflagellates, followed by diatoms (15 percent) and chrysophytes (<2 percent; ). As the manipulation progressed into July 2014, chlorophytes and dinoflagellates comprised 70 percent of the overall density of the phytoplankton community (164 and 157 cells mL−1, respectively), with diatoms, cyanobacteria, and chrysophytes comprising approximately 12, 6, and 2 percent, respectively (, Table S2). Chlorophytes and dinoflagellates remained the numerically dominant phyla until the last two weeks of the experiment in late July and early August, where diatoms became more dominant (56–79 percent of the overall phytoplankton density; , Table S2). In terms of biovolume, chlorophytes and dinoflagellates remained the largest members of the phytoplankton community over the course of the experiment, comprising 99 percent of the biomass until the last week of the experiment (, Table S3). During the last week of the experiment, diatom biomass encompassed about 10 percent of the community biomass, and chlorophytes and dinoflagellates declined to 75 percent (, Table S3).
Overall phytoplankton biovolume in the experimental lake declined in response to the manipulation in 2014 (, Table S2; F1,28 = 8.91, p = .006), which represented a 53.1 percent decrease in total biovolume from summer 2013 to summer 2014. Chlorophytes (F1,33 = 13.79, p < .001), dinoflagellates (F1,33 = 13.33, p < .001), and cyanobacteria (F1,33 = 6.26, p < .02) experienced the greatest decreases in biovolume during the manipulation (, Table S3), whereas diatoms overall demonstrated no significant change due to extreme variability in their size over the course of the experiment (Table S3). Chrysophyte biovolume was significantly greater in 2014 in both lakes (F1,33 = 6.26, p < .02), but there was no response to the manipulation.
Phytoplankton were sampled from the water column during three survey trips to the lakes in summer 2013 in order to compare with sediment trap results. These comparisons were meant to simply verify the presence of key phytoplankton phyla across samples. Any attempt to find statistical relationships between spot samples and sediment trap samples would result in spurious relationships (e.g., Table S4) given the differences in timescale (grab sample vs. five-day integrated sample) and water column distribution (grab samples at specific depths vs. sediment trap collection integrating 0–8 m). Chlorophytes, diatoms, and cyanobacteria were all well represented in both the sediment trap and water column samples, whereas chrysophytes and cryptophytes were less common in the sediment traps compared to the spot sampling in the water column ( and Figure S1, Table S4). Though we acknowledge that chrysophytes and cryptophytes were underrepresented in sediment traps, this is unlikely to affect the overall patterns described here or the conclusions. The dominant chrysophyte in these lakes was Dinobryon; abundances of this taxon in the water column are often represented well in sediment traps due to sinking abilities and high preservation (Dokulil and Skolaut Citation1991). Although Dinobryon cells were found infrequently in the sediment traps, we did find chrysophyte cysts in the traps during both years and in both lakes. The factors driving Dinobryon encystment are unclear (Agbeti and Smol Citation1995), but the results suggest that encystment was occurring and resulting in the composition found in the traps. Importantly, during the manipulation in 2014, the experimental lake cyst count dropped from nearly 200 cysts in the first two weeks to nearly zero for the rest of the summer. This pattern of cysts in the sediment traps mirrors the general pattern of overall algal biovolume over the summer in the traps and suggests that we are not missing any major production by chrysophytes (Dokulil and Skolaut Citation1991). Cryptophytes are too delicate to preserve in sediment traps, but low water column abundances would also indicate that we were not missing any major contribution of this group to lake production.
Based on manual sampling of zooplankton, communities were dominated by rotifers (>95 percent) in both lakes during 2013 and 2014, with low occurrences of copepods (mostly nauplii and juvenile Diaptomidae), and a complete lack of cladocerans (). Based on this standard, both the experimental and control lakes had fish communities, given that rotifers dominated zooplankton tows regardless of the time of year sampled, as suggested by prior research (Harmon et al. Citation2009). Though total abundances in zooplankton tows varied between years, these differences were not significant. The relative abundance of both rotifers and copepods did not respond to the lake manipulation in 2014.
Table 2. Total zooplankton abundance (number of individuals per sample) and the relative abundance of major zooplankton groups in the two lakes used for the whole-lake manipulation in 2013 and 2014. Cladoceran zooplankton were not found in either lake at any time.
Phytoplankton distribution patterns across lakes
CCA axes 1 and 2 explained 27 percent of the overall variance (and 82 percent of the constrained variance) in phytoplankton distributions across the landscape. Axis 1 was more strongly associated with water chemistry, whereas axis 2 related to physical lake characteristics (, ). As a result, the two axes provided clear distinctions among phytoplankton phyla from the lake surveys (, ). Dinoflagellates and cyanobacteria were more strongly associated with warmer lakes having higher average light and more available nutrients in the water column. Chrysophytes were generally found in higher-conductivity systems with lower light. Diatoms generally were found in lower-conductivity systems with more available nutrients and lower light. Chlorophytes and cryptophytes were less strongly related to either axis and generally were cosmopolitan in the phytoplankton samples (, ).
Table 3. Proportions of explained variance and relative contributions of environmental variables to phytoplankton phyla distributions in southwest Greenland lakes as determined by CCA.
Figure 5. Canonical correspondence analysis biplot relating physicochemical and biological data in southwest Greenland lakes across the summer season of 2013. Physical and chemical parameters are represented with vector arrows; phytoplankton phyla fall along vectors that best predict their distributions across the landscape of southwest Greenland.
Discussion
In lake ecosystems, the relationship of temperature to system function is more complicated than simple physical warming or changes to metabolic parameters; temperature interacts with water transparency and alters lake mixing depths (Saros, Northington, Osburn et al. Citation2016). Mixing depths are also affected in the Arctic by the timing of ice-out, which is controlled by winter and spring air temperatures (Olsen, Anderson, and Knudsen Citation2012; Warner et al. Citation2018). We simulated the effects of warming-induced changes in Arctic lakes, specifically the deeper mixing that earlier ice-out elicits. Contrary to Arctic paleolimnological records that suggest warming-induced increases in algal biomass (as inferred from sedimentary pigment concentrations; Michelutti et al. Citation2005), we found that phytoplankton biomass declined despite warmer water temperatures. Further, though warmer conditions in the control lake in 2014 suggested an increase in algal biomass, deeper mixing (as simulated in the experimental lake) appears to negate these warming effects on lake algae.
In this region of Greenland, summer thermal patterns in lakes are established based on antecedent climate conditions earlier in the spring (Warner et al. Citation2018). Both 2013 and 2014 were cold from January to April, thus leading to a later ice-off in mid-June despite a slightly warmer May in 2014 (Figure S2). The magnitude of temperature differences from 2013 to 2014 during the open-water season was a result of warming during and beyond May. Thus, as the lake shifts from isothermal to summer stratification, the intensity of the stratification reflects the initial conditions after the loss of ice. Mixing is further controlled by in-lake processes (PAR attenuation, DOC; Saros, Northington, Osburn et al. Citation2016) and wind.
This study revealed the unexpected effects of climate on complex ecological processes, particularly in these low-nutrient lakes with relatively simple food webs. In addition to reduced biomass, the manipulation shifted the community structure to one dominated initially by larger and more abundant chlorophytes and dinoflagellates, with diatoms increasing in abundance at the end of the summer. This manipulation, however, did not alter the biogeochemical nature of the system or consumer abundances.
Ecological responses of an Arctic lake to deeper mixing depths
Though some studies suggest that warmer waters may support greater primary production through increases in phytoplankton (Giling et al. Citation2017; Kraemer, Mehner, and Adrian Citation2017), this was not the case in the whole-lake manipulation. Although total biovolume and density (summed across the growing season) in each lake did slightly increase from 2013 to a warmer 2014, the temporal distribution of phytoplankton in these lakes was ultimately determined by the mixing depth in each system. In both the experimental and control lakes, phytoplankton were more abundant immediately after ice-out in 2014 compared to 2013. In the experimental lake, the deeper mixing depth persisted through the summer and clearly influenced the composition of the phytoplankton. Patterns in phytoplankton production in response to altered light environments have been noted in other ecosystems as well. In a lake darkening study in a temperate hardwood forest area, there was a sharp decline in primary productivity in the manipulated system (Batt et al. Citation2015). As with this study, light was also the ultimate limiting factor in the darkening manipulation (Batt et al. Citation2015) because there were no concomitant changes in nutrient availability in the system after the manipulation.
In addition to light, changes in the biogeochemical nature of lakes have been used to describe variation in phytoplankton. In a similar manipulation in a boreal lake in Quebec (Cantin et al. Citation2011), the authors noted increased biomass and production of phytoplankton with experimentally deepened mixing depths. This change in biomass and production was attributed to increases in available DIC and colored DOC from the manipulation, along with possible resuspension of hypolimnetic water and nutrients (Cantin et al. Citation2011). In contrast, we found no changes in the biogeochemical nature of this Greenland system in response to the manipulation (). Further, western Greenland has been experiencing a coherent, decadal decline of lake DOC (Saros et al. Citation2015), which is generally colorless (Anderson and Stedmon Citation2007).
We contend that the phytoplankton responses noted in this study were due to an altered light environment in the manipulated lake despite no change in 1 percent PAR depth (). Given the typical mixing depth of 4 m in the two lakes, along with a 1 percent PAR depth of 6 to 7 m, a phytoplankton cell circulating in the epilimnion would be exposed to 40 to 45 percent of the surface irradiance of PAR (as seen in the control lake and in 2013 for the experimental lake; Saros, Northington, Anderson, and Anderson Citation2016). In 2014, the 1 percent PAR depth was still within that range in the experimental lake, but with a mixing depth twice that of the prior year, an average epilimnetic phytoplankton cell was only exposed to 20 percent of incoming solar radiation due to the manipulation (Saros, Northington, Anderson, and Anderson Citation2016). Despite these differences in phytoplankton biomass and density, no concomitant changes in Chl-a occurred due to the manipulation (). Given the deeper mixing depth, lack of changes to PAR, and altered light environment for phytoplankton taxa (Saros, Northington, Anderson, and Anderson Citation2016), we suggest that there is a compensatory effect of altered light conditions with smaller individuals producing more Chl-a per unit cell. Work in Antarctica supports our contention of a compensatory effect because more chlorophyll was found in low-light conditions relative to less light-limited portions of oligotrophic Lake Bonney (Morgan-Kiss et al. Citation2016).
Relationships between algal biomass and Chl-a do not hold under low-light conditions (LaBaugh Citation1995), further suggesting compensation by algal groups when light conditions change. Research on chlorophyte algae (a dominant taxon in these systems) indicates lower Chl-a : biomass ratios in Chlamydomonas spp. living in low-light conditions (Bonente et al. Citation2012). Although photosynthetic efficiency remained low for Chlamydomonas in this study, individual cells increased the number of pigments in their photosynthetic machinery as a response to lower light relative to those without light limitation (Bonente et al. Citation2012). Evidence from the North Sea further demonstrates altered relationships between biomass and chlorophyll when assessing heterogeneous phytoplankton assemblages (Alvarez-Fernandez and Riegman Citation2014). Biomass C and chlorophyll tracked each other only in shallow waters with abundant light, with deviations occurring in stratified conditions with less light and a phytoplankton assemblage shifting toward dominance by mixotrophic dinoflagellates (Alvarez-Fernandez and Riegman Citation2014). This pattern was also found in the experimental data.
Phytoplankton communities across the survey lakes were structured in response to combinations of chemical lake characteristics and light (), a situation that mirrors the whole-lake experiment. Although average light was used in the CCA, the significant relationships with other environmental variables including temperature (ρ = 0.58) and epilimnion thickness (ρ = −0.99) further highlight the complex interactions seen in the experiment. Further, the covarying nature of temperature and light on phytoplankton growth is well known (Edwards et al. Citation2016; Malik and Saros Citation2016). Though recent work has suggested that temperature primarily structures phytoplankton communities in Greenland (Whiteford et al. Citation2016), this experiment and survey provide additional lines of evidence supporting light as a primary control of phytoplankton communities in these systems. Summing phytoplankton biomass and density estimates across years in the lakes indicated that in a warmer year (2014), density of phytoplankton increased in both lakes but to a much lesser extent in the lake with a deeper mixed layer. Over the same period, biomass (as biovolume) showed the opposite pattern, with phytoplankton biomass declining significantly (53.1 percent decrease), whereas the control lake showed an increase. Taken together, this suggests that warming may indeed increase phytoplankton biomass but only in lakes with relatively shallow mixing depths. We have demonstrated that deeper mixing during a warmer year led to significantly lower overall biomass of phytoplankton. Specifically, larger-sized taxa declined despite relatively small increases in density.
Though light limitation seemed to be the key factor affecting phytoplankton communities directly in response to the manipulation, the lack of a nutrient response likely drove the dominance of certain phytoplankton taxa. Dominance by mixotrophic dinoflagellates ( and ) was also seen in a multiyear lake manipulation in a lake in subarctic Norway (Lydersen et al. Citation2008). Some phytoplankton groups can thrive in low-light environments due to their ability to either fix nitrogen (cyanobacteria) or shift feeding modes toward mixotrophy (dinoflagellates) when nutrients are also limiting (Lydersen et al. Citation2008; Charvet, Vincent, and Lovejoy Citation2012). Cyanobacteria and dinoflagellates in the survey data () showed an association with the nutrient axis due to their ability to respond to and take advantage of nutrient pools unavailable to other phytoplankton groups (Cottingham et al. Citation2015). If nutrients were more available, even under low-light conditions, centric diatoms such as Lindavia ocellata may become more dominant (Malik and Saros Citation2016). Light availability slightly increased to around 30 percent in the epilimnion at the end of the experiment (Saros, Northington, Anderson, and Anderson Citation2016), which likely contributed to the increase in diatoms due to easing of light limitation combined with some nutrient release from settling chlorophytes and dinoflagellates ( and ).
Across the lake survey, responses to average light availability may also be interpreted in the context of the environmental variables to which it is correlated. The strong association of cyanobacteria with light in the survey is consistent with previous work also noting persistence of these groups in warmer, shallower mixing depths (Rolland et al. Citation2013). Both chrysophytes and diatoms can tolerate low light conditions, as long as nutrients are available for growth, which is consistent with where these groups were found in the CCA (Malik and Saros Citation2016; ). The cosmopolitan nature of chlorophytes and cryptophytes in the lakes, along with their central location in the CCA plot (), is likely due to behavioral responses of these groups to resource limitation. Chlorophytes may move throughout the water column to areas of higher light and nutrient availability (Veillette et al. Citation2010), whereas cryptophytes can utilize both photosynthetic and mixotrophic strategies to obtain nutrition in addition to being highly motile (Laybourn-Parry and Marshall Citation2003). In the nutrient-poor systems here, it is likely that light will continue to influence landscape-level changes in phytoplankton communities given that 1 percent PAR (along with DOC) is one of the strongest controls on mixing depths of lakes in Greenland (Saros, Northington, Osburn et al. Citation2016).
Though overall zooplankton communities between the two lakes did not respond to the manipulation, slight changes in the relative abundance of copepods occurred between the beginning and the end of the manipulation period in the experimental lake (). Zooplankton abundances at the beginning of sampling in both lakes in 2014 were higher than other samples (), but rotifers remained the dominant group and likely did not have an effect on the larger phytoplankton present after ice-out (). The zooplankton sampling was not at the same resolution as the phytoplankton sampling, but declines in overall phytoplankton density and the dominance of large-bodied phytoplankton phyla (e.g., and ) would further suggest that zooplankton may have been food limited as the summer continued. Although stickleback were present in both lakes, the drastic change in phytoplankton resources due to the manipulation was likely a stronger control on copepod populations in the experimental lake in 2014, as suggested by prior researchers (Barbiero, Lesht, and Warren Citation2011).
Future changes to Arctic lakes
In contrast to previous work (Cantin et al. Citation2011; Giling et al. Citation2017; Kraemer, Mehner, and Adrian Citation2017), this lake manipulation demonstrated that changing the light condition of lakes can have profound consequences on lake community structure independent of temperature. Though air temperature indeed contributes to the thermal structure of lakes, the mixing depths of these Greenland lakes are primarily controlled by factors relating to water transparency (Saros, Northington, Osburn et al. Citation2016). These high-DOC western Greenland lakes have been experiencing a coherent decline in concentration since the early 2000s (Saros et al. Citation2015), but the quality and spectral nature of the remaining DOC pool represents a significant control on water clarity (Saros, Northington, Osburn et al. Citation2016) and thus light attenuation. This is further seen in , where average light in the water column, temperature, and DOC fall along the same axis. Light as a limitation on phytoplankton biomass with deeper mixing has been noted in numerous lake studies (Diehl et al. Citation2002; Berger et al. Citation2010; Beall et al. Citation2016), providing further support for our results. At the ecosystem level, this likely translates into lower lake productivity over the course of the open-water season (Batt et al. Citation2015), given the further importance of light as a control on mixing depths in this region (Saros, Northington, Osburn et al. Citation2016), although more thorough productivity studies are needed to address this hypothesis.
Although temperature has typically been suggested as a major driver of phytoplankton community changes (Smol et al. Citation2005; Cantin et al. Citation2011; Striebel et al. Citation2016; Whiteford et al. Citation2016), future changes in primary producers will also likely be mitigated through alterations in the light environment. In a situation where warmer, more nutrient-rich lake waters exist, phytoplankton communities could shift more strongly toward dinoflagellates and cyanobacteria. In the experimental manipulation, temperature did have a more direct effect initially in 2014. Ice-out dates for both control and experimental lakes were the same in 2013 and 2014, although air temperatures were higher in 2014. This initial warming after ice-off led to lake communities dominated by dinoflagellates and cyanobacteria ( and , Table S3). Despite this initial response, the altered light environment provided by the lake manipulation led to the loss of these phyla, as reflected in the survey data, indicating a strong light dependence for dinoflagellates and cyanobacteria across Greenland lakes. Taken together, the lower light environment provided by deeper mixed layers may favor groups that can tolerate lower light conditions, such as diatoms (Saros, Northington, Anderson, and Anderson Citation2016), chrysophytes (Malik and Saros Citation2016), and algae such as chlorophytes and cryptophytes that can alter their behavior for resource acquisition (Laybourn-Parry and Marshall Citation2003; Veillette et al. Citation2010). In a future scenario where deeper mixing depths predominate in Arctic lakes, it is reasonable to assume that whole-lake net primary production (NPP) in these systems will decline further given light limitation within the epilimnion (e.g., Obrador, Staehr, and Christiansen Citation2014) paired with the decline in phytoplankton density and shifts toward smaller individuals ( and , Table S3).
Conclusion
Our purpose was to use whole-system manipulation to elicit a short-term response in lake thermal structure. This resulted in a shift in the community structure of phytoplankton by essentially changing light availability in a nutrient-poor system. Although light was also important in some lakes in the survey, landscape-level results further demonstrated that unique combinations of abiotic factors influence phytoplankton community structure in natural systems. Clearly, more work needs to be done to enhance the knowledge of the mechanisms underlying nonlinear biotic responses to climate change (Anderson et al. Citation2017), which can be achieved through the use multiple scales of inquiry such as whole-lake (Saros, Northington, Anderson, and Anderson Citation2016; Saros, Northington, Osburn et al. Citation2016) and landscape, in situ experiments (Malik and Saros Citation2016; Malik, Northington, and Saros Citation2017), or long timescales (Saros et al. Citation2012). Abrupt change (e.g., rapid warming) occurs on different scales than the biological responses they elicit (Anderson et al. Citation2017), so only through examining ecological patterns from multiple perspectives can we begin to understand natural dynamics and predict potential future biotic outcomes.
Acknowledgments
We thank Rachel Fowler, Hamish Greig, Steve Juggins, Emily Rice, Kristin Strock, and Kathryn Warner for field assistance, along with our helicopter pilots Gregor Beer and Petrus Nobreus. CH2M Hill Polar Services provided logistical support for this project. We thank Corey Simnioniw of the Medora Corporation for modifying the design of the Solar Bee to meet our requirements. Brian McGill provided assistance with statistical analyses. We also thank the two anonymous reviewers for their helpful critiques, which allowed for the substantial improvement of this article for publication.
Disclosure statement
No potential conflict of interest was reported by the authors.
Additional information
Funding
References
- Adams, H. E., B. C. Crump, and G. W. Kling. 2010. Temperature controls on aquatic bacterial production and community dynamics in arctic lakes and streams. Environmental Microbiology 12:1319–33. doi:10.1111/emi.2010.12.issue-5.
- Agbeti, M. D., and J. P. Smol. 1995. Chrysophyte population and encystment patterns in two Canadian lakes. Journal of Phycology 31:70–78. doi:10.1111/j.0022-3646.1995.00070.x.
- Alexeev, V. A., C. D. Arp, B. M. Jones, and L. Cai. 2016. Arctic sea ice decline contributes to thinning lake ice trend in northern Alaska. Environmental Research Letters 11:074022. doi:10.1088/1748-9326/11/7/074022.
- Alvarez-Fernandez, S., and R. Riegman. 2014. Chlorophyll in North Sea coastal and offshore waters does not reflect long term trends of phytoplankton biomass. Journal of Sea Research 91:35–44. doi:10.1016/j.seares.2014.04.005.
- American Public Health Association, American Water Works Association, Water Environment Federation. 2005. Standard methods for the examination of water and wastewater, A. D. Eaton, L. S. Clesceri, E. W. Rice, and A. E. Greenberg, eds., 21st ed. Washington, DC: American Public Health Association.
- Anderson, M. J., T. O. Crist, J. M. Chase, M. Vellend, B. D. Inouye, A. L. Freestone, N. J. Sanders, H. V. Cornell, L. S. Comita, K. F. Davies, et al. 2011. Navigating the multiple meanings of beta diversity: A roadmap for the practicing ecologist. Ecology Letters 14:19–28. doi:10.1111/j.1461-0248.2010.01552.x.
- Anderson, N. J., R. Harriman, D. B. Ryves, and S. T. Patrick. 2001. Dominant factors controlling variability in the ionic composition of West Greenland Lakes. Arctic, Antarctic, and Alpine Research 33:418–25. doi:10.1080/15230430.2001.12003450.
- Anderson, N. J., J. E. Saros, J. E. Bullard, S. M. P. Cahoon, S. McGowan, E. A. Bagshaw, C. D. Barry, R. Bindler, B. T. Burpee, J. L. Carrivick, et al. 2017. The Arctic in the twenty-first century: Changing biogeochemical linkages across a paraglacial landscape of Greenland. BioScience 67:118–33. doi:10.1093/biosci/biw158.
- Anderson, N. J., and C. A. Stedmon. 2007. The effect of evapoconcentration on dissolved organic carbon concentration and quality in lakes of SW Greenland. Freshwater Biology 52:280–89. doi:10.1111/fwb.2007.52.issue-2.
- Arp, C. D., B. M. Jones, and G. Grosse. 2013. Recent lake ice-out phenology within and among lake districts of Alaska, USA. Limnology and Oceanography 58:2013–28. doi:10.4319/lo.2013.58.6.2013.
- Arp, C. D., B. M. Jones, A. K. Liljedahl, K. M. Hinkel, and J. A. Welker. 2015. Depth, ice thickness, and ice-out timing cause divergent hydrologic responses among Arctic lakes. Water Resources Research 51:9379–401. doi:10.1002/wrcr.v51.12.
- Barbiero, R. P., B. M. Lesht, and G. J. Warren. 2011. Evidence for bottom-up control of recent shifts in the pelagic food web of Lake Huron. Journal of Great Lakes Research 37:78–85. doi:10.1016/j.jglr.2010.11.013.
- Batt, R. D., S. R. Carpenter, J. J. Cole, M. L. Pace, R. A. Johnson, J. T. Kurtzweil, and G. M. Wilkinson. 2015. Altered energy flow in the food web of an experimentally darkened lake. Ecosphere 6:art33. doi:10.1890/ES14-00241.1.
- Beall, B. F. N., M. R. Twiss, D. E. Smith, B. O. Oyserman, M. J. Rozmarynowycz, C. E. Binding, R. A. Bourbonniere, G. S. Bullerjahn, M. E. Palmer, E. D. Reavie, et al. 2016. Ice cover extent drives phytoplankton and bacterial community structure in a large north-temperate lake: Implications for a warming climate. Environmental Microbiology 18:1704–19. doi:10.1111/1462-2920.12819.
- Berger, S. A., S. Diehl, H. Stibor, G. Trommer, and M. Ruhenstroth. 2010. Water temperature and stratification depth independently shift cardinal events during plankton spring succession. Global Change Biology 16:1954–65. doi:10.1111/gcb.2010.16.issue-7.
- Bergersen, R. 1996. Sticklebacks from Greenland. Journal of Fish Biology 48:799–801. doi:10.1111/jfb.1996.48.issue-4.
- Blenckner, T., A. Omstedt, and M. Rummukainen. 2002. A Swedish case study of contemporary and possible future consequences of climate change on lake function. Aquatic Sciences 64:171–84. doi:10.1007/s00027-002-8065-x.
- Boersma, M., K. A. Mathew, B. Niehoff, K. L. Schoo, R. M. Franco-Santos, and C. L. Meunier. 2016. Temperature driven changes in the diet preference of omnivorous copepods: No more meat when it’s hot? Ecology Letters 19:45–53. doi:10.1111/ele.12541.
- Bonente, G., S. Pippa, S. Castellano, R. Bassi, and M. Ballottari. 2012. Acclimation of Chlamydomonas reinhardtii to different growth irradiances. The Journal of Biological Chemistry 287:5833–47. doi:10.1074/jbc.M111.304279.
- Bring, A., I. Fedorova, Y. Dibike, L. Hinzman, J. Mård, S. H. Mernild, T. Prowse, O. Semenova, S. L. Stuefer, M.-K. Woo, et al. 2016. Arctic terrestrial hydrology: A synthesis of processes, regional effects, and research challenges. Journal of Geophysical Research: Biogeosciences 121:621–49. doi:10.1002/2015JG003131.
- Butcher, J. B., D. Nover, T. E. Johnson, and C. M. Clark. 2015. Sensitivity of lake thermal and mixing dynamics to climate change. Climatic Change 129:295–305. doi:10.1007/s10584-015-1326-1.
- Caldwell Eldridge, S. L., T. M. Wood, K. R. Echols, and B. R. Topping. 2013. Microcystins, nutrient dynamics, and other environmental factors during blooms of non-microcystin-producing Aphanizomenon flos-aquae in Upper Klamath Lake, Oregon, 2009. Lake and Reservoir Management 29:68–81. doi:10.1080/10402381.2013.775199.
- Cantin, A., B. E. Beisner, J. M. Gunn, Y. T. Prairie, and J. G. Winter. 2011. Effects of thermocline deepening on lake plankton communities. Canadian Journal of Fisheries and Aquatic Sciences 68:260–76. doi:10.1139/F10-138.
- Charvet, S., W. F. Vincent, and C. Lovejoy. 2012. Chrysophytes and other protists in High Arctic lakes: Molecular gene surveys, pigment signatures and microscopy. Polar Biology 35:733–48. doi:10.1007/s00300-011-1118-7.
- Charvet, S., W. F. Vincent, and C. Lovejoy. 2014. Effects of light and prey availability on Arctic freshwater protist communities examined by high-throughput DNA and RNA sequencing. FEMS Microbiology Ecology 88:550–64. doi:10.1111/fem.2014.88.issue-3.
- Cottingham, K. L., H. A. Ewing, M. L. Greer, C. C. Carey, and K. C. Weathers. 2015. Cyanobacteria as biological drivers of lake nitrogen and phosphorous cycling. Ecosphere 6. doi:10.1890/ES14-00171.1.
- Diehl, S., S. Berger, R. Ptacnik, and A. Wild. 2002. Phytoplankton, light, and nutrients in a gradient of mixing depths: Field experiments. Ecology 83:399–411. doi:10.1890/0012-9658(2002)083[0399:PLANIA]2.0.CO;2.
- Dokulil, M. T., and C. Skolaut. 1991. Aspects of phytoplankton seasonal succession in Mondsee, Austria, with particular reference to the ecology of Dinobryon Ehrenb. International Journal of Theoretical and Applied Limnology 24:968–73.
- Douglas, R. W., B. Rippey, and C. E. Gibson. 2003. Estimation of the in‐situ settling velocity of particles in lakes using a time series sediment trap. Freshwater Biology 48:512–18. doi:10.1046/j.1365-2427.2003.01027.x.
- Downing, J. A., Y. T. Prairie, J. J. Cole, C. M. Duarte, L. J. Tranvik, R. G. Striegl, and Middelburg, J. J. 2006. The global abundance and size distribution of lakes, ponds, and impoundments. Limnology and Oceanography 51:2388–97. doi:10.4319/lo.2006.51.5.2388.
- Edwards, K. F., M. K. Thomas, C. A. Klausmeier, and E. Litchman. 2016. Phytoplankton growth and the interaction of light and temperature: A synthesis at the species and community level. Limnology and Oceanography 61:1232–1244. doi:10.1002/lno.10282.
- Felip, M., and J. Catalan. 2000. The relationship between phytoplankton biovolume and chlorophyll in a deep oligotrophic lake: Decoupling in their spatial and temporal maxima. Journal of Plankton Research 22:91–105. doi:10.1093/plankt/22.1.91.
- Giling, D. P., J. C. Nejstgaard, S. A. Berger, H.-P. Grossart, G. Kirillin, A. Penske, M. Lentz, P. Casper, J. Sareyka, M. O. Gessner, et al. 2017. Thermocline deepening boosts ecosystem metabolism: Evidence from a large-scale lake enclosure experiment simulating a summer storm. Global Change Biology 23:1448–62. doi:10.1111/gcb.2017.23.issue-4.
- Hamilton, D. P., N. Salmaso, and H. W. Paerl. 2016. Mitigating harmful cyanobacterial blooms: Strategies for control of nitrogen and phosphorous loads. Aquatic Ecology 50:351–66. doi:10.1007/s10452-016-9594-z.
- Harmon, L. J., B. Matthews, S. Des Roches, J. M. Chase, J. B. Shurin, and D. Schluter. 2009. Evolutionary diversification in stickleback affects ecosystem functioning. Nature 458:1167–70. doi:10.1038/nature07974.
- Kienel, U., G. Kirillin, B. Brademann, B. Plessen, R. Lampe, and A. Brauer. 2017. Effects of spring warming and mixing duration on diatom deposition in deep Tiefer See, NE Germany. Journal of Paleolimnology 57:37–49. doi:10.1007/s10933-016-9925-z.
- Kovacs, A. W., M. Presing, and L. Voros. 2016. Thermal-dependent growth characteristics for Cylindrospermopsis raciborskii (Cyanoprokaryota) at different light availabilities: Methodological considerations. Aquatic Ecology 50:623–38. doi:10.1007/s10452-016-9582-3.
- Kraemer, B. M., O. Anneville, S. Chandra, M. Dix, E. Kuusisto, D. M. Livingstone, A. Rimmer, S. G. Schladow, E. Silow, L. M. Sitoki, et al. 2015. Morphometry and average temperature affect lake stratification responses to climate change. Geophysical Research Letters 42:4981–88. doi:10.1002/2015GL064097.
- Kraemer, B. M., T. Mehner, and R. Adrian. 2017. Reconciling the opposing effects of warming on phytoplankton biomass in 188 large lakes. Scientific Reports UK 7. doi:10.1038/s41598-017-11167-3.
- LaBaugh, J. W. 1995. Relation of algal biovolume to chlorophyll a in selected lakes and wetlands in the north-central United States. Canadian Journal of Fisheries and Aquatic Sciences 52:416–24. doi:10.1139/f95-043.
- Laybourn-Parry, J., and W. A. Marshall. 2003. Photosynthesis, mixotrophy and microbial plankton dynamics in two high Arctic lakes during summer. Polar Biology 26:517–24. doi:10.1007/s00300-003-0514-z.
- Lydersen, E., K. J. Aanes, S. Andersen, T. Andersen, P. Brettum, T. Baekken, L. Lien, E. A. Lindstrøm, J. E. Løvik, M. Mjelde, et al. 2008. Ecosystem effects of thermal manipulation of a whole lake, Lake Breisjoen, southern Norway (THERMOS project). Hydrology and Earth System Sciences Discussions 12:509–22. doi:10.5194/hess-12-509-2008.
- Malik, H. I., and J. E. Saros. 2016. Effects of temperature, light and nutrients on five Cyclotella sensu lato taxa assessed with in situ experiments in arctic lakes. Journal of Plankton Research 38:431–42. doi:10.1093/plankt/fbw002.
- Malik, H. I., R. M. Northington, and J. E. Saros. 2017. Nutrient limitation status of Arctic lakes affects the responses of Cyclotella sensu lato diatom species to light: Implications for distribution patterns. Polar Biology 40:2445–2456. doi:10.1007/s00300-017-2156-6.
- Mayewski, P. A., S. B. Sneed, S. D. Birkel, A. V. Kurbatov, and K. A. Maasch. 2014. Holocene warming marked by abrupt onset of longer summers and reduced storm frequency around Greenland. Journal of Quaternary Science 29:99–104. doi:10.1002/jqs.2684.
- Michelutti, N., A. P. Wolfe, R. D. Vinebrooke, B. Rivard, and J. P. Briner. 2005. Recent primary production increases in arctic lakes. Geophysical Research Letters 32. doi:10.1029/2005GL023693.
- Morgan-Kiss, R. M., M. P. Lizotte, W. Kong, and J. C. Priscu. 2016. Photoadaptation to the polar night by phytoplankton in a permanently ice-covered Antarctic lake. Limnology and Oceanography 61:3–13. doi:10.1002/lno.10107.
- Negandhi, K., I. Laurion, and C. Lovejoy. 2016. Temperature effects on net greenhouse gas production and bacterial communities in arctic thaw ponds. FEMS Microbiology Ecology 92:fiw117. doi:10.1093/femsec/fiw117.
- Northington, R. M., and J. E. Saros. 2016. Factors controlling methane in Arctic lakes of southwest Greenland. PLoS One 11:e0159642. doi:10.1371/journal.pone.0159642.
- Obrador, B., P. A. Staehr, and J. P. C. Christiansen. 2014. Vertical patterns of metabolism in three contrasting stratified lakes. Limnology and Oceanography 59:1228–40. doi:10.4319/lo.2014.59.4.1228.
- Obryk, M. K., P. T. Doran, A. S. Friedlaender, M. N. Gooseff, W. Li, R. M. Morgan-Kiss, J. C. Priscu, O. Schofield, S. E. Stammerjohn, D. K. Steinberg, et al. 2016. Responses of Antarctic marine and freshwater ecosystems to changing ice conditions. BioScience 66:864–79. doi:10.1093/biosci/biw109.
- Olsen, J., N. J. Anderson, and M. F. Knudsen. 2012. Variability of the North Atlantic Oscillation over the past 5,200 years. Nature Geoscience 5:808–12. doi:10.1038/ngeo1589.
- Oullet Jobin, V., and B. E. Beisner. 2014. Deep chlorophyll maxima, spatial overlap and diversity of phytoplankton exposed to experimentally altered thermal stratification. Journal of Plankton Research 36:933–42. doi:10.1093/plankt/fbu036.
- Pannard, A., D. Planas, and B. E. Beisner. 2015. Macrozooplankton and the persistence of the deep chlorophyll maximum in a stratified lake. Freshwater Biology 60:1717–33. doi:10.1111/fwb.2015.60.issue-8.
- Parkinson, C. L., and N. E. DiGirolamo. 2016. New visualizations highlight new information on the contrasting Arctic and Antarctic sea-ice trends since the late 1970s. Remote Sensing of Environment 183:198–204. doi:10.1016/j.rse.2016.05.020.
- Rolland, D. C., S. Bourget, A. Warren, I. Laurion, and W. Vincent. 2013. Extreme variability of cyanobacterial blooms in an urban drinking water supply. Journal of Plankton Research 35:744–58. doi:10.1093/plankt/fbt042.
- Saros, J. E., R. M. Northington, D. S. Anderson, and N. J. Anderson. 2016. A whole-lake experiment confirms a small centric diatom species as an indicator of changing lake thermal structure. Limnology and Oceanography Letters 1:27–35. doi:10.1002/lol2.10024.
- Saros, J. E., R. M. Northington, C. L. Osburn, B. T. Burpee, and N. J. Anderson. 2016. Thermal stratification in small arctic lakes of southwest Greenland affected by water transparency and epilimnetic temperatures. Limnology and Oceanography 61:1530–42. doi:10.1002/lno.10314.
- Saros, J. E., C. L. Osburn, R. M. Northington, S. D. Birkel, J. D. Auger, C. A. Stedmon, and N. J. Anderson. 2015. Recent decrease in DOC concentrations in Arctic lakes of southwest Greenland. Geophysical Research Letters 42:6703–09. doi:10.1002/grl.v42.16.
- Saros, J. E., J. R. Stone, G. T. Pederson, K. E. Slemmons, T. Spanbauer, A. Schliep, D. Cahl, C. E. Williamson, and D. R. Engstrom. 2012. Climate‐induced changes in lake ecosystem structure inferred from coupled neo‐and paleoecological approaches. Ecology 93:2155–64. doi:10.1890/11-2218.1.
- Sastri, A. R., J. Gauthier, P. Juneau, and B. E. Beisner. 2014. Biomass and productivity responses of zooplankton communities to experimental thermocline deepening. Limnology and Oceanography 59:1–16. doi:10.4319/lo.2014.59.1.0001.
- Smejkalova, T., M. E. Edwards, and J. Dash. 2016. Arctic lakes show strong decadal trend in earlier spring ice-out. Scientific Reports UK 6. doi:10.1038/srep38449.
- Smol, J. P., A. P. Wolfe, H. J. B. Birks, M. S. Douglas, V. J. Jones, A. Korhola, R. Pienitz, K. Ruhland, S. Sorvari, D. Antoniades, et al. 2005. Climate-driven regime shifts in the biological communities of arctic lakes. Proceedings of the National Academy of Sciences 102:4397–402. doi:10.1073/pnas.0500245102.
- Sorvari, S., A. Korhola, and R. Thompson. 2002. Lake diatom response to recent Arctic warming in Finnish Lapland. Global Change Biology 8:171–81. doi:10.1046/j.1365-2486.2002.00463.x.
- Striebel, M., S. Schabhuettl, D. Hodapp, P. Hingsamer, and H. Hillebrand. 2016. Phytoplankton responses to temperature increases are constrained by abiotic conditions and community composition. Oecologia 182:815–27. doi:10.1007/s00442-016-3693-3.
- Surdu, C. M., C. R. Duguay, and D. F. Prieto. 2016. Evidence of recent changes in the ice regime of lakes in the Canadian High Arctic from spaceborne satellite observations. The Cryosphere 10:941–60. doi:10.5194/tc-10-941-2016.
- Tilzer, M. M., and C. R. Goldman. 1978. Importance of mixing, thermal stratification, and light adaptation for phytoplankton productivity in Lake Tahoe (California-Nevada). Ecology 59:810–21. doi:10.2307/1938785.
- Veillette, J., M. Martineau, D. Antoniades, D. Sarrazin, and W. F. Vincent. 2010. Effects of perennial lake ice on mixing and phytoplankton dynamics: Insights from High Arctic Canada. Annals of Glaciology 51:56–70. doi:10.3189/172756411795931921.
- Warner, K. W., R. A. Fowler, R. M. Northington, H. I. Malik, J. McCue, and J. E. Saros. 2018. How does changing ice-out affect arctic versus boreal lakes? A comparison using two years with ice-out that differed by more than three weeks. Water 10:78. doi:10.3390/w10010078.
- Whiteford, E. J., S. McGowan, C. D. Barry, and N. J. Anderson. 2016. Seasonal and regional controls of phytoplankton production along a climate gradient in South-West Greenland during ice-cover and ice-free conditions. Arctic, Antarctic, and Alpine Research 48:139–59. doi:10.1657/AAAR0015-003.
- Williamson, C. E., J. E. Saros, and D. W. Schindler. 2009. Sentinels of change. Science 323:887–88. doi:10.1126/science.1169443.
- Zhang, M., J. Xu, and L. Hansson. 2015. Local environment overrides regional climate influence on regime shift in a north temperate lake. Aquatic Ecology 49:105–13. doi:10.1007/s10452-015-9509-4.