
 ?Mathematical formulae have been encoded as MathML and are displayed in this HTML version using MathJax in order to improve their display. Uncheck the box to turn MathJax off. This feature requires Javascript. Click on a formula to zoom.
ABSTRACT
The upper Nu–Salween River basin in the Tibetan Plateau is mainly covered with seasonal frozen soils. We used daily surface freeze–thaw states, detected from Special Sensor Microwave/Imager (SSM/I) daily brightness temperature data, to analyze the variations in surface freeze–thaw states and the relationship with air temperature. We also examined baseflow to explore the influences of interannual variations in the start time of soil freezing on hydrological processes. The results showed that (1) interannual air temperature fluctuations led to differences in the area and start time of surface freezing. When surface soil froze, flow was mainly dependent on existing groundwater storage. (2) The interannual variation in the surface freezing time directly affected the flow generation processes. When soil water froze and remained in the frozen layer, it was hard to generate surface flow, so flow mainly consisted of baseflow, causing the proportion of the baseflow in the total flow to gradually increase. (3) The surface freeze–thaw states obtained from the passive microwave remote sensing data may be applied to support further research on the hydrological impacts of freeze–thaw cycle variations in plateau mountain basins.
Introduction
The soil freeze–thaw cycle, accompanied by energy and water transformation, is one of the main processes of the hydrological cycle in alpine basins (Riseborough et al. Citation2008; Lu, Zhang, and Pei Citation2019). Impermeable or slightly permeable frozen soil can obstruct or weaken the hydraulic connection between surface water and groundwater, and this plays an important role in the formation, migration, and distribution of groundwater in cold areas (Lawrence and Slater Citation2005; Iwata et al. Citation2011). Variations in surface soil freezing processes because of global warming may change the spatiotemporal pattern of infiltration (J. Liu et al. Citation2011; Niu et al. Citation2011; Lundberg et al. Citation2016). However, as a result of limited data describing soil freeze–thaw states, current understanding on the spatiotemporal distribution of soil freezing and groundwater recharge processes in cold regions remain inadequate, restricting research on the connection between surface soil freezing and flow generation (Woo et al. Citation2008).
The Tibetan Plateau, with an area of 2.5 × 10⁶ km2 and an average altitude exceeding 4,000 m, is the largest and highest plateau on earth, and permafrost in the Tibetan Plateau covers approximately 1.5 × 10⁶ km2 (Shen et al. Citation2018). The properties of frozen soil on the Tibetan Plateau have changed dramatically because of climate change. In the past half century, part of the permafrost has become seasonal frozen soil. For seasonally frozen soil, the duration of the frozen state has reduced, and freezing depth has become shallower (Wu and Zhang Citation2008; Kang et al. Citation2010; X. Li et al. Citation2012; Ran, Li, and Cheng Citation2018). Over the coming decades, regional permafrost degradation is expected to continue or even accelerate (Guo, Wang, and Li Citation2012).
The Tibetan Plateau is the origin of several major Asian rivers, such as the Yellow River, the Yangtze River, the Lancang–Mekong River, the Nu–Salween River, and the Yarlung Tsangpo–Brahmaputra River. Hydrological processes in major river basins are closely linked to the interactions between climate and freeze–thaw cycle, and research on the hydrological effects of changes in the freeze–thaw cycle is of great importance in understanding water cycle variations, as well as the formation and evolution of water resources under climate change (Jiang et al. Citation2018; W. Wang et al. Citation2018).
Comprehensive study of the hydrological processes affected by changes in freeze–thaw cycle is restricted by sparse and unevenly distributed monitoring sites (Oelke and Zhang Citation2007; D. Luo et al. Citation2018). Microwaves can be used to obtain the surface freeze–thaw states because of the major differences in the dielectric properties between frozen and thawing soil (Farhadi et al. Citation2015). Among microwave techniques, passive microwave remote sensing at a high temporal resolution is able to monitor large-scale daily surface freeze–thaw states (Jin, Li, and Che Citation2009).
In the current study, we applied both passive microwave remote sensing data and ground observation data in the Tibetan Plateau to study hydrological impacts of frozen soil variations under climate change. We first analyzed the spatiotemporal distribution of surface freeze–thaw states (obtained from passive microwave remote sensing data), the air temperature, and hydrological characteristics in the upper Nu–Salween River basin. Then, baseflows were compared to assess the influences of interannual variations in freeze–thaw cycle on hydrological processes. Through this study, we expect to better understand how freeze–thaw variations affected by climate change influence flow generation in the Tibetan Plateau. The results may provide support for water resource utilization in the upper Nu–Salween River basin.
Study area, data, and method
Study area
The Nu–Salween River is a large river in Southeast Asia and flows for 3,673 km from the Tibetan Plateau to the Andaman Sea. The Nu–Salween River basin has an area of approximately 325 × 103 km2. In China, the upper Nu–Salween River basin is mostly located in the Tibetan Plateau and Hengduan Mountains and has a particularly complex geographical environment. Over the past fifty years, the air temperatures in winter and spring have shown increasing trends in the upper Nu–Salween River basin, and the magnitude of warming increases with altitude. For example, during the last fifty years, the average air temperature in winter rose by 0.81°C per decade at Nagchu station (), which is located in the river source area (X. Luo et al. Citation2016). As a result, variations in surface soil freezing processes were considerable. The maximum freezing depths at Nagchu, Sog County, and Dingqing stations () in the 1960s were 253.9, 107.4, and 84.5 cm, respectively; those in the 2000s were 171.2, 72.1, and 62.8 cm, respectively. From 1961 to 2010, the maximum freezing depth at the abovementioned stations showed significant declining trends, with respective change rates of −21.3, −7.4, and −6.2 cm per decade (Du et al. Citation2012).
Figure 1. Distribution of the seventeen meteorological stations and Gongshan hydrological station in the upper Nu–Salween River basin. Meteorological stations include Amdo (1), Nagchu (2), Damxung (3), Sog County (4), Biru (5), Dingqing (6), Neiwugi (7), Qamdo (8), Lhari (9), Luolong (10), Bomi (11), Baxiu (12), Zuogong (13), Markam (14), Chayu (15), Deqin (16), and Gongshan stations, and the numbers in the brackets link those in the map
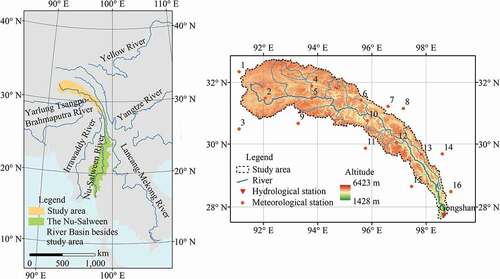
Gongshan hydrological station (27°44′ N, 98°41′ E, ) has a catchment area of about 107.3 × 10³ km2. Most of the watershed below Gongshan station is located at low altitude and has a high temperature. Therefore, the catchment above Gongshan station was chosen as the study area (). The altitudes of the study area mostly range from 3,000 to 6,000 m. The areas with altitudes of 3,000–4,000 m, 4,000–5,000 m, and 5,000–6,000 m cover 8 × 10³, 71 × 103, and 26 × 103 km2, respectively, and account for 7.3, 66.3, and 24.6 percent of the study area, respectively. The main vegetation cover consists of meadow and shrub. The streamflow is mainly from groundwater in winter and from rainfall and meltwater in summer (D. Liu, Shen, and Wang Citation2008). Flow observations at Gongshan station began in 1987, and we took 1988–2008 as the study period.
Data
Air temperature observations at 17 meteorological stations in the upper Nu–Salween River basin and surrounding areas () were collected from the National Meteorological Information Center (http://www.nmic.cn/). In the study area, air temperature variation is strongly influenced by topography, and elevation can be used as auxiliary information for air temperature interpolation. Co-kriging takes into consideration the effects of topography on climate using digital elevation model data as a secondary variable (Apaydin, Anli, and Ozturk Citation2011), and we used this interpolation method to obtain monthly average air temperature in the study area.
Data on surface freeze–thaw states were sourced from the long-term surface soil freeze/thaw states dataset of China using the dual-indies algorithm (provided by the Environmental & Ecological Science Data Center for West China, National Natural Science Foundation of China, http://westdc.westgis.ac.cn/). In this data set, surface freeze–thaw states at a spatial resolution of 25.1 km were detected from Special Sensor Microwave/Imager (SSM/I) daily brightness temperature data, using a dual-indices classification algorithm (X. Li et al. Citation2012). The two indices were the 37 GHz brightness temperature (TB37v) and the spectral gradient between the 37 GHz and 18/19 GHz brightness temperature (SD). TB37v has significant correlations with ground temperature and air temperature. When soil freezes, the attenuation caused by volume scattering is more significant at higher frequencies, reducing the brightness temperature at higher frequencies more than those at lower frequencies (X. Li et al. Citation2012). The daily minimum ground surface temperature data, measured at the soil surface with minimum thermometer from the meteorological stations of the Chinese Meteorological Administration, were applied in calibration and validation. The thresholds of TB37v and SD in the freezing state were determined for each land cover type using the daily minimum ground surface temperatures corresponding to the soil freezing point (0°C) to separate freezing and thawing states. X. Li et al. (Citation2012) applied the dual-indices classification algorithm to detect daily soil freeze–thaw states from 1988 to 2006 in China. The accuracy was approximately 88.7 percent, which indicates that it can detect the surface freeze–thaw states with sufficient accuracy. The SSM/I sensor did not supply continuous information, and the percentage of missing values in the study area was 54.2 percent. The classification data at the nearest time were used to fill in the missing values.
Digital filter algorithm
During the cold, dry season, the streamflow in the study area is mainly from baseflow (D. Liu, Shen, and Wang Citation2008). Baseflow responds slowly to precipitation and is usually associated with flow from groundwater storage (Eckhardt Citation2008; J. Zhang et al. Citation2017). To analyze the influences of freeze–thaw cycle variations on groundwater recharge processes, baseflow should be separated from streamflow.
The digital filter algorithm is a widely applied baseflow separation method (Fan et al. Citation2013). In the frequency spectrum of a hydrograph, baseflow is similar to the low-frequency component, whereas the high-frequency component is primarily caused by surface flow. By separating the high- and low-frequency signals, the digital filter algorithm may be used for baseflow separation (Longobardi and Villani Citation2008). The filter equation is shown in EquationEquation (1)(1)
(1) :
where qt and qt−1 are the surface flow obtained by filters at time t and t − 1, respectively; Qt and Qt−1 are the total flow at time t and t − 1; and α is the filter parameter, which is usually selected as 0.90, 0.925, or 0.95. Total flow and surface flow can be used to calculate baseflow, as shown in EquationEquation (2)(2)
(2) :
where bt is the baseflow at time t. The filter can usually pass over the streamflow data one, two, or three times. As filter parameter α or filter time increases, the variation in baseflow becomes smoother.
Baseflow index is the proportion of baseflow accounted for in total streamflow, which is able to effectively indicate the influence of geographical factors on low flow (Smakhtin Citation2001). The equation for calculating baseflow index is shown in EquationEquation (3)(3)
(3) :
where t1 and t2 are the start time and end time, respectively. The greater the baseflow index, the larger the proportion of baseflow. The relationship between freezing processes of surface soil and groundwater storage can be explored by comparing baseflow indexes.
The influences of air temperature on surface freeze–thaw states
Spatial distribution of surface freezing time
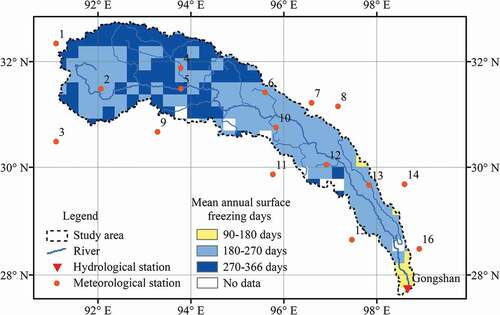
We analyzed the spatial distribution of surface freezing time in the study area detected from SSM/I daily brightness temperature data. The distribution of mean annual surface freezing days is shown in . In most of the study area, surface soil freezes for more than 180 days within a year. The region with between 180 and 270 surface freezing days covered 67 × 103 km2 and was mostly at the altitudes between 4,000 and 5,000 m, accounting for 62.3 percent of the study area. The area with more than 270 surface soil freezing days covered 34 × 103 km2 and was mostly higher than 4,600 m, accounting for 32.0 percent of the total area. The correlation coefficient between mean annual surface freezing days and altitude was 0.60, and the correlation was significant (p < .01). Overall, annual surface freezing days increased by about sixty-two days with every 1,000 m of altitude. Previous research showed that in the study area, seasonal frozen soil spread over the river valley, whereas discontinuous and continuous permafrost was mainly distributed in the high altitude area at elevations greater than 4,600–5,000 m (Y. Zhou et al. Citation2000). Using the Gaussian curve proposed by Cheng (Citation1984), we also calculated the lower altitudinal limit of permafrost in the upstream, which ranged from 4,520 to 4,770 m. Our study found that the area with more than 300 surface freezing days was mostly located in the upstream uplands at the altitudes higher than 4,800 m. This was close to the results of previous research and the lower altitudinal limit of permafrost calculated from the Gaussian curve.
Figure 2. Distribution of mean annual surface freezing days detected from SSM/I daily brightness temperature data in the study area. The numbers for the meteorological stations are the same as those in
Characteristics of intra-annual variations in air temperature and surface freezing area
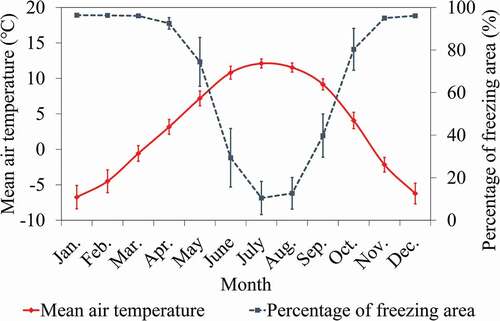
Intra-annual variations in air temperature and freezing area are shown in . From November to March, the mean monthly air temperature was below 0°C and the air temperature in January was the lowest at −6.7°C. The mean annual temperature then increased until reaching its highest value of 12.1°C in July. The surface freezing area was close to 103 × 103 km2 from November to March, and most of the surface soil in the study area was frozen. The surface soil began to thaw in April, and the surface freezing area reached its minimum in July. The surface freezing area in July was 11 × 103 km2 at the altitudes of higher than 5,000 m. After September, as air temperature dropped, the surface soil in the study area gradually froze, with an average surface freezing area of 43 × 103 and 86 × 103 km2 in September and October, respectively. By November, most of the surface soil in the study area was frozen.
Figure 3. Mean monthly air temperature and surface freezing area variations in the study area (1988–2008). Error bar represents one standard deviation
Interannual variations in air temperature and surface freeze–thaw states in the early freezing stage
Interannual variations in air temperature and freezing areas during the early freezing stage (September to October) are shown in . In September in the 1990s and 2000s, the mean air temperatures were 8.9°C and 9.5°C, respectively, and those in October were 3.9°C and 4.3°C, respectively. The air temperatures from September to October in the 2000s were higher than those in the 1990s, and a t-test showed that the differences in September were significant (p < .1).
Figure 4. Interannual variations in mean air temperature and surface freezing area in the study area in (a) September and (b) October
In the 1990s, the average surface freezing areas were 47 × 103 and 91 × 103 km2 in September and October, respectively. From 2000 to 2008, they were 35 × 103 and 80 × 103 km2, respectively. A t test showed that the surface freezing areas in September and October from 2000 to 2008 were both significantly less than those in the 1990s (p < .05).
The onset date of continuous surface freezing is defined as the date on which the surface soil in a grid converts from a thawed state to a frozen state, and the frozen state continues until the following year. The average onset day of continuous surface freezing in the study area was calculated for each year (). During the twenty-one-year period between 1988 and 2008, the average onset day of continuous surface freezing in the study area was 2 October. Surface soil froze earliest in 1993, with an onset day for continuous surface freezing of 16 September. The latest occurred in 2007 and began on 19 October, thirty-three days later than that in 1993. In the 1990s, the average onset day of continuous surface freezing was 28 September, compared to 8 October during the period 2000–2008, an average delay over the 1990s of about ten days.
Figure 5. Changes in the average onset date of continuous surface freezing in the study area
Relationship between air temperature and freezing area in the early freezing stage
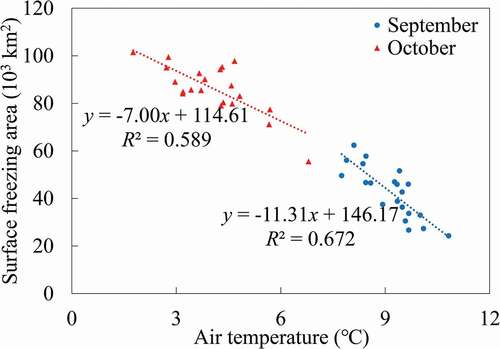
The relationship between mean air temperature and surface freezing area in September and October is shown in . During the study period, the surface freezing area had significant negative correlation with the mean air temperature in September and October (p < .01), with R2 of 0.67 and 0.59, respectively. When the mean air temperature increased by 1.0°C, the respective average surface freezing areas reduced by about 11 × 103 km2 in September and 7 × 10³ km2 in October.
Figure 6. Relationship between mean air temperature and surface freezing area in the study area in September and October
Hydrological impacts of interannual variations in surface soil freezing processes
Flow characteristics
The intra-annual distribution of streamflow at Gongshan station is shown in . The mean annual flow at Gongshan station was 42.46 × 10⁹ m3 and was mainly concentrated in the flood season. The flow from May to October was 35.63 × 10⁹ m3, accounting for 83.9 percent of the annual flow. During the early surface freezing stage, the mean monthly flows in September and October were 6.24 × 10⁹ and 3.66 × 10⁹ m3, respectively, accounting for 14.7 and 8.6 percent of the annual flow, respectively. From November to the following April, the flow was 6.83 × 10⁹ m3, accounting for 16.1 percent of the annual total. The minimum monthly flow was in February and was only 0.74 × 10⁹ m3, accounting for only 1.7 percent of the annual flow.
Table 1. Intra-annual distribution of streamflow at Gongshan station (1988–2008)
To examine flow variations before and after the surface freeze, we analyzed the flow relationship between October (prior to most of the surface freezing in the study area) and the flow recession period (from November to the following February) at Gongshan station (). The results indicated that the correlation between flow in October and that from November to the following February was significant (p < .01), with R2 of 0.64. The larger the flow in October, the greater the flow from November to the following February.
Figure 7. Relationship between the flow at Gongshan station in October and that from November to the following February in the study area
In the upper Nu–Salween River basin, most of the precipitation from November to the following February occurs as snow. The generation of surface flow from precipitation and snowmelt is limited because of the low temperature, and streamflow is thus mainly from baseflow. As a result, the groundwater storage in the early freezing stage has a great influence on the flow in the subsequent dry season.
Relationship between baseflow index and the onset date of continuous surface freezing
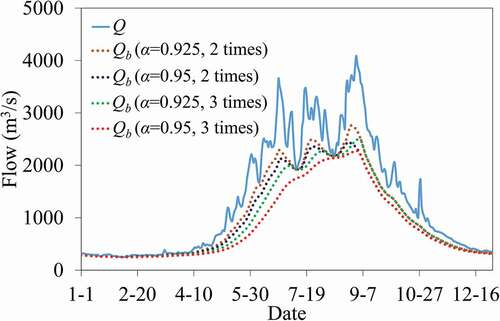
In this study, a digital filter algorithm was used to divide surface water and baseflow at Gongshan station to calculate the baseflow index from September to October. We compared baseflow separation results for different filter parameters α and times, and some of the results are shown in . When filter parameter α and time were set as 0.95 and three times, respectively, baseflow varied more smoothly. The baseflow index during the study period was 0.65, which corresponded with the suggestion of Eckhardt (Citation2005) that baseflow index should be less than 0.80 for perennial streams with porous aquifers. The result was also similar to those obtained by hydrograph separation, hydrology model, or isotope method in other basins in the Tibetan Plateau (G. Wang, Hu, and Li Citation2009; J. Zhou et al. Citation2015; Qin et al. Citation2017). Hence, the filter parameter α and time were set as 0.95 and three times, respectively, to calculate baseflow at Gongshan station, and the mean depth of annual total flow and baseflow in the study area were 395.3 and 257.7 mm, respectively.
Figure 8. Baseflow at Gongshan station calculated from digital filter algorithm using different filter parameters and times
The relationship between the baseflow index from September to October and the onset date of continuous surface freezing is shown in . The baseflow index from September to October had a significant negative correlation with the onset date of continuous surface freezing (p < .01), with R2 of 0.46. Over the twenty-one-year period from 1988 to 2008, in the eight years when the onset date of continuous surface freezing was in September, the baseflow indexes from September to October were all greater than 0.70. In contrast, in nine of the thirteen years when the onset date of continuous surface freezing was in October, the baseflow indexes from September to October were less than 0.70. The later the surface soil froze, the smaller the baseflow index from September to October and thus the lower the proportion of baseflow in the total flow.
Figure 9. Relationship between the baseflow index at Gongshan station from September to October and the onset date of continuous surface freezing
Discussion
Surface soil freezing processes play an important role in runoff generation processes in cold regions (Koren, Smith, and Cui Citation2014). Water-phase transition greatly alters soil water potential, which influences redistribution and evaporation of soil water. Infiltration capacity, hydraulic conductivity, and soil water transfer are modulated by the ice in frozen soil (Y. Zhang et al. Citation2013). From the time soil begins to freeze until it reaches maximum freezing depth, soil moisture is influenced by gravitational potential, capillary potential, and temperature potential. Soil water in the vadose zone moves to frozen layer through soil profile, forming ice crystals on frozen fringe and filling in the soil pores (Yang et al. Citation2007). In the frozen layer, little moisture can move, and almost no moisture moves to the phreatic zone or evaporates. Consequently, flow in superficial soil layers is restricted by the blocking effect of ice and retention of soil water, and frost delays much of the flow from draining to the river (Nyberg et al. Citation2001). If surface soil freezes earlier, more soil water freezes and is retained in the frozen layer before it flows to the river, leading to a reduction in surface and lateral flow generation. In contrast, when surface soil freezes later, surface and lateral flow from September to October is less affected by freezing processes, and the corresponding baseflow index is relatively small. In general, the freezing time of surface soil is important in determining the soil water storage and streamflow generation from September to October in the study area.
There were great interannual differences in the start time of surface freezing in the upper Nu–Salween River basin, and they were similar to those throughout the Tibetan Plateau (X. Li et al. Citation2012). These variations may influence soil water storage and flow generation processes and contribute to the differences in low flow amounts. Surface soil freezing processes are particularly sensitive to changes in air temperature. The Tibetan Plateau has experienced a significant warming trend over the past five decades (L. Li et al. Citation2010), and the air temperature has increased by 0.3°C–0.4°C per decade (D. Chen et al. Citation2015). The warming trend will continue in the future (H. Chen et al. Citation2013) and may considerably delay surface soil freezing processes. In September and October, water may be less restricted and retained in superficial soil layers, resulting in increasing river flow. Related research may help to predict low flow variations under climate change and provide support for water resource utilization in the upper Nu–Salween River basin.
Significant changes are occurring in permafrost and seasonally frozen ground because of climate change, which may have complex impacts on surface and subsurface hydrology (Wu and Zhang Citation2008). However, our understanding of the hydrological cycle in cold regions remains inadequate. First, meteorological and hydrological data are scarce and difficult to obtain. Second, research on hydrological processes is limited and is often at the small watershed scale (Woo et al. Citation2008). Observational data shortages restrict understanding of the hydrological effects of variations in frozen soil. In large watersheds, passive remote sensing data could be effectively applied to investigate the timing, duration, and areal extent of surface soil freeze–thaw states, which would provide useful information for the study of hydrological processes.
Conclusions
In this study, we used surface freeze–thaw states obtained from passive remote sensing data to analyze the relationship between freezing area and air temperature in the upper Nu–Salween River basin during the early freezing stage. We also examined the influences of freezing processes on flow generation processes. The following conclusions were drawn:
The surface soil gradually freezes in the upper Nu–Salween River basin above Gongshan station from September to October, and the average surface freezing areas in these two months were 43 × 103 and 86 × 103 km2, respectively. The interannual air temperature variations led to large differences in the freezing area during this stage. Each 1.0°C increase in the mean air temperature reduced surface freezing areas by about 11 × 103 km2 in September and 7 × 10³ km2 in October. The classification of surface freeze–thaw states in large watersheds can be obtained from passive remote sensing data and assists research into surface soil freezing processes and their hydrological impacts.
The flow from November to the following February was significantly correlated with that in October (p < .01). Because the temperature is low, most of the surface soil is frozen in the cold season, and snow is not likely to melt and generate river flow. Streamflow mainly consists of baseflow, and the groundwater storage in the early freezing stage has a great influence on the flow after surface soil freezing.
From September to October, earlier onset times of surface soil freezing are associated with higher baseflow indexes. When surface soil freezes, soil water is retained in the frozen layer and thus it is hard to generate surface flow, leading to an increased proportion of baseflow in the total flow in the upper Nu–Salween River basin. The interannual variations in surface freezing time may influence soil water storage and flow generation processes, and the potential impacts of climate change on surface soil freezing and hydrological processes in the Tibetan Plateau should be investigated more comprehensively.
Disclosure statement
No potential conflict of interest was reported by the authors.
Additional information
Funding
Related Research Data
References
- Apaydin, H., A. S. Anli, and F. Ozturk. 2011. Evaluation of topographical and geographical effects on some climatic parameters in the Central Anatolia Region of Turkey. International Journal of Climatology 31:1264–79. doi:https://doi.org/10.1002/joc.2154.
- Chen, D., B. Xu, T. Yao, Z. Guo, P. Cui, F. Chen, R. Zhang, X. Zhang, Y. Zhang, J. Fan, et al. 2015. Assessment of past, present and future environmental changes on the Tibetan Plateau. Chinese Science Bulletin 60 (32):3025–35. doi:https://doi.org/10.1360/N972014-01370.
- Chen, H., Q. Zhu, C. Peng, N. Wu, Y. Wang, X. Fang, Y. Gao, D. Zhu, G. Yang, and J. Tian. 2013. The impacts of climate change and human activities on biogeochemical cycles on the Qinghai-Tibetan Plateau. Global Change Biology 19:2940–55. doi:https://doi.org/10.1111/gcb.12277.
- Cheng, G. 1984. Problems on zonation of high-altitude permafrost. Acta Geographica Sinica 39 (2):185–93.
- Du, J., J. Jian, J. Hong, H. Lu, and D. Chen. 2012. Response of seasonal frozen soil to climate change on Tibet Region from 1961 to 2010. Journal of Glaciology and Geocryology 34 (3):512–21.
- Eckhardt, K. 2005. How to construct recursive digital filters for baseflow separation. Hydrological Processes 19:507–15. doi:https://doi.org/10.1002/hyp.5675.
- Eckhardt, K. 2008. A comparison of baseflow indices, which were calculated with seven different baseflow separation methods. Journal of Hydrology 352:168–73. doi:https://doi.org/10.1016/j.jhydrol.2008.01.005.
- Fan, Y., Y. Chen, Y. Liu, and W. Li. 2013. Variation of baseflows in the headstreams of the Tarim River Basin during 1960–2007. Journal of Hydrology 487:98–108. doi:https://doi.org/10.1016/j.jhydrol.2013.02.037.
- Farhadi, L., R. H. Reichle, G. J. M. de Lannoy, and J. S. Kimball. 2015. Assimilation of freeze–thaw observations into the NASA Catchment land surface model. Journal of Hydrometeorology 16:730–43. doi:https://doi.org/10.1175/JHM-D-14-0065.1.
- Guo, D., H. Wang, and D. Li. 2012. A projection of permafrost degradation on the Tibetan Plateau during the 21st century. Journal of Geophysical Research 117:D05106. doi:https://doi.org/10.1029/2011JD016545.
- Iwata, Y., M. Nemoto, S. Hasegawa, Y. Yanai, K. Kuwao, and T. Hirota. 2011. Influence of rain, air temperature, and snow cover on subsequent spring-snowmelt infiltration into thin frozen soil layer in northern Japan. Journal of Hydrology 401:165–76. doi:https://doi.org/10.1016/j.jhydrol.2011.02.019.
- Jiang, H., W. Zhang, Y. Yi, K. Yang, G. Li, and G. Wang. 2018. The impacts of soil freeze/thaw dynamics on soil water transfer and spring phenology in the Tibetan Plateau. Arctic, Antarctic, and Alpine Research 50 (1):e1439155. doi:https://doi.org/10.1080/15230430.2018.1439155.
- Jin, R., X. Li, and T. Che. 2009. A decision tree algorithm for surface soil freeze/thaw classification over China using SSM/I brightness temperature. Remote Sensing of Environment 113:2651–60. doi:https://doi.org/10.1016/j.rse.2009.08.003.
- Kang, S., Y. Xu, Q. You, W. A. Flügel, N. Pepin, and T. Yao. 2010. Review of climate and cryospheric change in the Tibetan Plateau. Environmental Research Letters 5 (1):015101. doi:https://doi.org/10.1088/1748-9326/5/1/015101.
- Koren, V., M. Smith, and Z. Cui. 2014. Physically-based modifications to the Sacramento Soil Moisture Accounting model. Part A: Modeling the effects of frozen ground on the runoff generation process. Journal of Hydrology 519:3475–91. doi:https://doi.org/10.1016/j.jhydrol.2014.03.004.
- Lawrence, D. M., and A. G. Slater. 2005. A projection of severe near-surface permafrost degradation during the 21st century. Geophysical Research Letters 32:L24401. doi:https://doi.org/10.1029/2005gl025080.
- Li, L., S. Yang, Z. Wang, X. Zhu, and H. Tang. 2010. Evidence of warming and wetting climate over the Qinghai-Tibet Plateau. Arctic, Antarctic, and Alpine Research 42 (4):449–57. doi:https://doi.org/10.1657/1938-4246-42.4.449.
- Li, X., R. Jin, X. Pan, T. Zhang, and J. Guo. 2012. Changes in the near-surface soil freeze-thaw cycle on the Qinghai-Tibetan Plateau. International Journal of Applied Earth Observation and Geoinformation 17:33–42. doi:https://doi.org/10.1016/j.jag.2011.12.002.
- Liu, D., Y. Shen, and Z. Wang. 2008. Water resource characteristics in the Nujiang River Basin. Yangtze River 39 (17):64–66.
- Liu, J., J. Xie, T. Gong, H. Wang, and Y. Xie. 2011. Impacts of winter warming and permafrost degradation on water variability, upper Lhasa River, Tibet. Quaternary International 244:178–84. doi:https://doi.org/10.1016/j.quaint.2010.12.018.
- Longobardi, A., and P. Villani. 2008. Baseflow index regionalization analysis in a Mediterranean area and data scarcity context: Role of the catchment permeability index. Journal of Hydrology 355:63–75. doi:https://doi.org/10.1016/j.jhydrol.2008.03.011.
- Lu, J., M. Zhang, and W. Pei. 2019. Hydro-thermal behaviors of the ground under different surfaces in the Qinghai-Tibet Plateau. Cold Regions Science and Technology 161:99–106. doi:https://doi.org/10.1016/j.coldregions.2019.03.002.
- Lundberg, A., P. Ala-Aho, O. M. Eklo, B. Klöve, J. Kvœrner, and C. Stumpp. 2016. Snow and frost: Implications for spatiotemporal infiltration patterns - a review. Hydrological Processes 30 (8):1230–50. doi:https://doi.org/10.1002/hyp.10703.
- Luo, D., H. Jin, Q. Wu, V. Bense, R. He, Q. Ma, S. Gao, X. Jin, and L. Lü. 2018. Thermal regime of warm-dry permafrost in relation to ground surface temperature in the source areas of the Yangtze and Yellow rivers on the Qinghai-Tibet Plateau, SW China. Science of the Total Environment 618:1033–45. doi:https://doi.org/10.1016/j.scitotenv.2017.09.083.
- Luo, X., D. He, X. Ji, Y. Lu, and Y. Li. 2016. Low flow variations in the middle and upper Nujiang River Basin and possible responds to climate change in recent 50 years. Scientia Geographica Sinica 36 (1):107–13.
- Niu, L., B. Ye, J. Li, and Y. Sheng. 2011. Effect of permafrost degradation on hydrological processes in typical basins with various permafrost coverage in Western China. Science China (Earth Sciences) 54 (4):615–24. doi:https://doi.org/10.1007/s11430-010-4073-1.
- Nyberg, L., M. Stähli, P. E. Mellander, and K. H. Bishop. 2001. Soil frost effects on soil water and runoff dynamics along a boreal forest transect: 1. Field investigations. Hydrological Processes 15:909–26. doi:https://doi.org/10.1002/hyp.256.
- Oelke, C., and T. Zhang. 2007. Modeling the active-layer depth over the Tibetan Plateau. Arctic, Antarctic, and Alpine Research 39 (4):714–22. doi:https://doi.org/10.1657/1523-0430(06-200)[OELKE]2.0.CO;2.
- Qin, J., Y. Ding, T. Han, and Y. Liu. 2017. Identification of the factors influencing the baseflow in the permafrost region of the northeastern Qinghai-Tibet Plateau. Water 9:666. doi:https://doi.org/10.3390/w9090666.
- Ran, Y., X. Li, and G. Cheng. 2018. Climate warming over the past half century has led to thermal degradation of permafrost on the Qinghai–Tibet Plateau. The Cryosphere 12:595–608. doi:https://doi.org/10.5194/tc-12-595-2018.
- Riseborough, D., N. Shiklomanov, B. Etzelmüller, S. Gruber, and S. Marchenko. 2008. Recent advances in permafrost modelling. Permafrost and Periglacial Processes 19:137–56. doi:https://doi.org/10.1002/ppp.615.
- Shen, Y., R. Zuo, J. Liu, Y. Tian, and Q. Wang. 2018. Characterization and evaluation of permafrost thawing using GPR attributes in the Qinghai-Tibet Plateau. Cold Regions Science and Technology 151:302–13. doi:https://doi.org/10.1016/j.coldregions.2018.03.028.
- Smakhtin, V. U. 2001. Low flow hydrology: A review. Journal of Hydrology 240:147–86. doi:https://doi.org/10.1016/S0022-1694(00)00340-1.
- Wang, G., H. Hu, and T. Li. 2009. The influence of freeze–thaw cycles of active soil layer on surface runoff in a permafrost watershed. Journal of Hydrology 375:438–49. doi:https://doi.org/10.1016/j.jhydrol.2009.06.046.
- Wang, W., T. Wu, L. Zhao, R. Li, X. Zhu, W. Wang, S. Yang, Y. Qin, and J. Hao. 2018. Exploring the ground ice recharge near permafrost table on the central Qinghai-Tibet Plateau using chemical and isotopic data. Journal of Hydrology 560:220–29. doi:https://doi.org/10.1016/j.jhydrol.2018.03.032.
- Woo, M. K., D. L. Kane, S. K. Carey, and D. Yang. 2008. Progress in permafrost hydrology in the new millennium. Permafrost and Periglacial Processes 19:237–54. doi:https://doi.org/10.1002/ppp.613.
- Wu, Q., and T. Zhang. 2008. Recent permafrost warming on the Qinghai-Tibetan Plateau. Journal of Geophysical Research 113:D13108. doi:https://doi.org/10.1029/2007JD009539.
- Yang, G., F. Yin, X. Liu, and D. Xiao. 2007. Study on hydrological characteristics and runoff producing mechanism of frozen soil in cold region. Water Resources and Hydropower Engineering 38 (1):39–42.
- Zhang, J., Y. Zhang, J. Song, and L. Cheng. 2017. Evaluating relative merits of four baseflow separation methods in Eastern Australia. Journal of Hydrology 549:252–63. doi:https://doi.org/10.1016/j.jhydrol.2017.04.004.
- Zhang, Y., G. Cheng, X. Li, X. Han, L. Wang, H. Li, X. Chang, and G. N. Flerchinger. 2013. Coupling of a simultaneous heat and water model with a distributed hydrological model and evaluation of the combined model in a cold region watershed. Hydrological Processes 27:3762–76. doi:https://doi.org/10.1002/hyp.9514.
- Zhou, J., J. Wu, S. Liu, G. Zeng, J. Qin, X. Wang, and Q. Zhao. 2015. Hydrograph separation in the headwaters of the Shule River Basin: Combining water chemistry and stable isotopes. Advances in Meteorology 2015:830306. doi:https://doi.org/10.1155/2015/830306.
- Zhou, Y., D. Guo, G. Qiu, G. Cheng, and S. Li. 2000. Geocryology in China. Beijing: Science Press.