
ABSTRACT
Over the past decades, warmer air temperature and spatiotemporal changes in the amount and patterns of precipitation have been observed at high latitudes. Such interannual variability in climatic conditions has a strong influence on the dynamics of biological processes regulating terrestrial ecosystems. Dendroclimatology can improve our understanding of the impacts of climate change on vegetation. Based on ring width and frost rings of bearberry willow (Salix uva-ursi) individuals sampled on the southeastern shore of Hudson Bay, Nunavik (Subarctic Québec, Canada), we built a reliable 105-year growth chronology. A complex dendroclimatological analysis, using the standard approach (mean temperature and precipitation sums), extreme variables, and various climatological indices based on daily data, was conducted in order to precisely describe the relationship between annual variations in growth rings and climatic conditions. The growth of Low Arctic willows in the Hudson Bay region is determined by changes in air temperatures as well as precipitation during the summer. However, temperature increases and reductions in amounts of rainfall may intensify drought stress, which is unfavorable for this species. We found that analysis of daily amounts and intensity of precipitation improved our understanding of the factors conditioning the growth of the studied species in an extreme habitat.
Introduction
The large-scale warming of the Arctic and Subarctic has accelerated over the past decades and is now occurring at more than twice the global rate (AMAP Citation2017). In this region where climate variability is high, increases in air temperature and extreme precipitation events have been conspicuous over the past decades (Callaghan et al. Citation2002; Hill and Henry Citation2011; Frost and Epstein Citation2014). Concurrently, historical disturbance regimes are altered, whether rapid permafrost thaw, extreme drought events, or wildfire frequency and intensity. Although the pattern of these changes over different parts of the circumpolar Arctic is complex and heterogeneous, biome shifts are now underway: Some treelines are trending northwards (Harsch et al. Citation2009) and erect shrub species are expanding (Myers-Smith et al. Citation2011).
All of the aforementioned changes result in significant impacts on biological and biogeochemical processes in terrestrial ecosystems (Raynolds et al. Citation2008; Wolf, Larsson, and Callaghan Citation2008; Przybylak Citation2016) that could alter vegetation productivity. Vegetation development is influenced by both regional climatic conditions and local topography, which has triggered cascading effects on snow cover dynamics and wind exposure. Therefore, field-level studies and detailed laboratory analyses are needed to assess vegetation productivity trends on a variety of scales, from the size and shape of single plant individuals to changes in growth rates (changes in annual growth ring widths and cell sizes) (AMAP Citation2017). Fortunately, woody species (trees, erect or dwarf shrubs) growing in the circumpolar taiga–tundra ecotone are well known to respond strongly to climate and, therefore, constitute a valuable ecological archive of global changes (IPCC Citation2013).
Simulations carried out using the Coupled Global Climate Model, developed by Environment Canada, indicate ongoing changes between the 1961–1990 reference period and 2050 (Atlas of Canada Citation2010). This model predicts increases in both summer (ranging from 3°C to 4°C) and winter temperatures (ranging from 5°C to 6°C), resulting in warmer growing seasons and milder winters. It also predicts that annual precipitation will increase by 10 to 20 percent over the northern part of Canada, although summer precipitation (June–August) should only increase by ca. 10 percent and winter precipitation could increase by as much as 20 percent (Murdock, Sobie, and Hiebert Citation2014). Such changes in climatic conditions should lead to a significant northward trend in the geographical distribution of plant communities (MacDonald et al. Citation1998; Chapin et al. Citation2004; Hofgaard et al. Citation2013).
The forest–tundra ecotone, the transition zone from the boreal forest to the treeless tundra (Harper et al. Citation2011), is a suitable location to study the influence of extreme climatic conditions on the performance of woody species. Because changes in vegetation are expected to be particularly pronounced near the northern treeline, vegetation in the forest–tundra transition zone is becoming the object of special interest (Tape, Sturm, and Racine Citation2006; Jia, Epstein, and Walker Citation2009; Ropars and Boudreau Citation2012; Tremblay, Levesque, and Boudreau Citation2012). As such, the area near the Whapmagoostui–Kuujjuarapik communities, along the eastern Hudson Bay shore in Nunavik, is a region of interest to study the performance of woody species submitted to harsh climatic conditions. Although several dendrochronological studies have been conducted in this region over the last forty years (Jacoby Citation1983; Guiot Citation1985; Payette et al. Citation1985; Jacoby, Ivanciu, and Ulan Citation1988), the recent warming trend and the increased frequency of observed extreme climatic events warrant the need for new dendrochronological studies. The use of a nonclassical dendroclimatological approach is now necessary in order to evaluate more detailed climate indicators in addition to the standard monthly average temperatures and precipitation.
Although the dendroclimatological potential of black and white spruce (Picea mariana (Mill.) B.S.P., P. glauca (Moench) Voss) was recognized several years ago in the Whapmagoostui–Kuujjuarapik region (Payette et al. Citation1985), little research has been conducted on other woody species (Bhiry et al. Citation2011). Shrub dendrochronology has become the focus of an increasing number of studies only over the last decade (Blok et al. Citation2011; Myers-Smith et al. Citation2011, Citation2015; Jørgensen et al. Citation2015; Owczarek and Opała Citation2016; Young et al. Citation2016; Ropars et al. Citation2017; Weijers et al. Citation2017; Weijers, Pape, Löffler, and Myers-Smith Citation2018; Le Moullec et al. Citation2019). Therefore, the objective of our study was to investigate, for the first time, the dendroclimatic potential of bearberry willow (Salix uva-ursi Pursh). To do so, we aimed to develop a robust growth chronology of this species and investigate the impacts of extreme climatic conditions on its growth. Moreover, we wanted to assess the stability of the relevant dendroclimatic signal over time.
Geographical settings, climatic conditions, and vegetation structure
The study area is located near the communities of Whapmagoostui and Kuujjuarapik, on the southeastern shore of Hudson Bay, at the mouth of the Great Whale River (la Grande rivière de la Baleine; 55°17′ N, 77°47′ W; ). The area is characterized by low-elevation rolling hills (up to 250 m a.s.l.) of Archean granito-gneissic rocks (see ). This Precambrian rock formation is partly overlain by fluvioglacial and morainic deposits and by sandy and marine clay deposits in depressions and valley bottoms (Bhiry et al. Citation2011). These Quaternary sedimentary rocks are subject to landslide processes, which are clearly visible along the Great Whale River valley. The topography of the area is still undergoing rapid postglacial isostatic uplift (Bhiry et al. Citation2011).
Figure 1. Location of the study area: (A) (1) the meteorological station in Kuujjuarapik (black square) and the other meteorological stations (black dots): (2) Kuujjuaq (Quebec), (3) Inukjuak (Quebec), (4) Fort George (Quebec), and (5) Moosonee (Ontario). (B) Detailed location of the sampling sites (red circles)
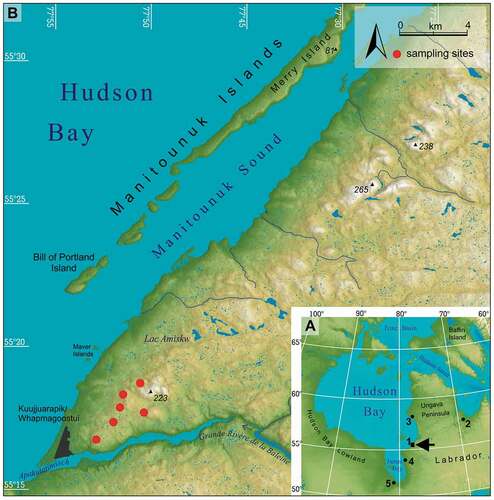
Figure 2. Average (A) monthly climate variations, (B) monthly extreme air temperatures, (C) monthly number of days with rain or snow, and (D) snow cover depth for the Kuujjuarapik meteorological station (12.2 m a.s.l., Quebec, Canada). Tmax abs = the highest monthly averaged daily maximum air temperatures; Tmax avg = average of Tmax; Tmin avg = average of Tmin; Tmin abs = the lowest monthly averaged minimum daily air temperatures. Averages calculated from years with complete monthly data between 1925 and 2017 as shown in Figure 6.
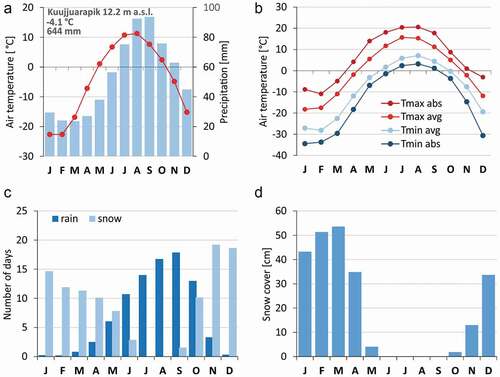
The study area is located in the warmest, southernmost part of the Canadian Arctic according to the climatological border (July air temperature <10°C), within a distinct transitional zone between the Köppen subarctic (Dfc) and tundra climate (ET; Canada Department of Mines and Technical Surveys Citation1959; Latifovic and Pouliot Citation2005; Przybylak Citation2016). The regional climate is strongly influenced by the proximity of Hudson Bay, which generates a significant cooling effect. Mean annual air temperatures at the Kuujjuarapik station can be as low as −4.1°C, varying from −23°C in January and February to 11°C in August. Monthly air temperatures exceed 10°C only in July and August (). The thrust of the arctic front over this area leads to both inflow of cold air masses and higher precipitation (ca. 650 mm annually). Precipitation is unevenly distributed throughout the year and is more abundant during summer (41 percent from June to August) than in winter (15 percent from December to February). Snow precipitation can occur from September to June and accounts for most precipitation during the winter. Snow cover usually forms in October and persists until May (). The frost-free period (June 22 to September 25) lasts ninety-four days on average. Przybylak (Citation2016) stressed the high year-to-year variability of monthly and seasonal precipitation. According to Rouse (Citation1991), any warming or cooling of the Hudson Bay will exert an enhanced impact on the neighboring terrestrial ecosystems.
Figure 3. Photographs of (A) lichen–spruce woodlands with Picea glauca [Moench] Voss and shrub vegetation on rocky outcrops and (B) bearberry willow growing on exposed granitic rock cracks
![Figure 3. Photographs of (A) lichen–spruce woodlands with Picea glauca [Moench] Voss and shrub vegetation on rocky outcrops and (B) bearberry willow growing on exposed granitic rock cracks](/cms/asset/a56ca928-3eb2-4796-ae52-e62f17769bc5/uaar_a_1722397_f0003_oc.jpg)
The study area is located in the forest subzone of the forest tundra (; Payette Citation1983) in Nunavik. The vegetation cover is dominated by lichen–spruce woodlands found on sandy terraces, by grasses along the coastal sand dune system, and by lichen heath on rocky outcrops (Payette and Gauthier Citation1972). The latter is found mainly northeast of the village on exposed granitic outcrops. At sites with thin organic deposits, the vegetation cover is dominated by low shrub species such as Rhododendron spp. and Vaccinium spp. Bearberry willow is also found on the most exposed sites (; Bélisle and Maillette Citation1988).
Materials and methods
Collection and preparation of samples and construction of the chronology
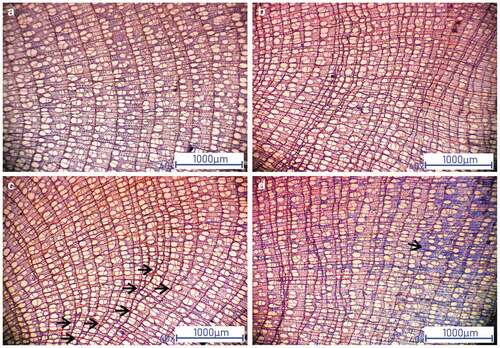
Bearberry is a prostrate, slow-growing, deciduous willow species with an arctic–alpine distribution (Bélisle and Maillette Citation1988), restricted to North America, where it is found in Nunavut, Nunavik, Labrador, Baffin Island, and western Greenland. It is a low (0.01–0.05 m high) dwarf shrub, forming compact clonal mats through layering (Argus, Eckenwalder, and Kiger Citation2010). It grows on exposed granitic hilltops, where it becomes established in cracks filled with poorly developed mineral soil (). Bearberry willow exhibits a limited growth rate, extended individual longevity, and sporadic reproduction that enables its survival in harsh subarctic environments (Bélisle and Maillette Citation1988). However, these characteristics hinder its ability to compete with other vascular species in milder environments (Maillette, Bélisle, and Seguin Citation1988). Bearberry willow is a semi-ring porous species with well-defined growth rings (, ), although missing and discontinuous rings can be observed (–). Reaction wood with gelatinous cells, associated with mechanical stresses, is commonly observed (). In a population study conducted in the Whapmagoostui–Kuujjuarapik area, some bearberry willow individuals were over 100 years old, with the oldest one reaching 170 years (Bélisle and Maillette Citation1988). To our knowledge, this is the first dendrochronological study on this species.
Figure 4. Selected features of bearberry willow wood anatomy, important from a dendrochronology point of view: well-defined semi-ring porous growth rings with (A) regular and (B) variable widths, (C) wedging and locally absent growth rings, and (D) reaction wood with gelatinous cells
In August 2017, we collected forty bearberry willow individuals from the Whapmagoostui–Kuujjuarapik area. Individuals were sampled at an altitude of ca. 120 m a.s.l. In order to obtain the longest possible time series, we sampled the largest and potentially oldest willow individuals. We sampled different parts of the dwarf shrub (roots, root collars, and stems) in order to fulfill the requirements for applying the serial sectioning technique (), as described in detail by Kolishchuk (Citation1990). According to this technique, sampling and measurement of cross sections at several locations on the same individual allows for proper age determination and to more accurate growth chronology construction (Myers-Smith et al. Citation2015). Upon collection, samples were cut into small pieces, labeled, air-dried, and transported to the laboratory of the University of Silesia for further processing. Because microscopic examination of specimens was necessary for age determination and growth measurements due to the very narrow rings of this species, thin sections (ca. 20 μm) were prepared. In order to soften the wood, samples were boiled in water prior to being cut with a WSL-1 sliding microtome (Gärtner et al. Citation2015). Next, thin sections were stained with a mixture of safranin and astra blue and subsequently dehydrated using 96 and 99 percent alcohol before being permanently mounted onto microscope slides, using Petropoxy as an agent. Digital photographs of each sample were taken under a microscope. A mosaic of pictures was assembled by combining several images with overlapping areas (using Helicon Remote and Adobe Photoshop software). To avoid distortion toward the edges, only the inner parts of the pictures were used, overlapped with each other and fit together. Due to the large number of wedging rings, at least two (but as many as five) radii were measured for each microsection using the WinDENDRO automatic tree ring measuring system (Régent Instruments Citation2014). Additionally, we measured each photomicrograph separately using an on-screen measuring system (OSM4—On Screen Measuring and Image Analysis; VIAS Citation2006). We compared both measurements and did not find significant differences.
Figure 5. Example of the bearberry willow serial sectioning technique. Positions of sampling microtome sections within individual plant and corresponding growth ring width curves
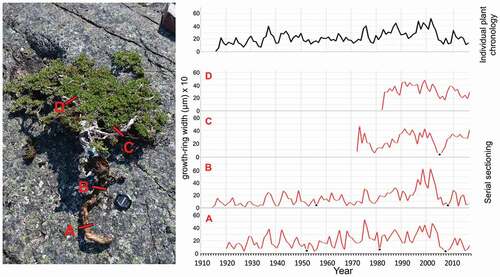
All growth ring measurements were cross-dated visually and statistically tested using COFECHA software (Holmes Citation1983). Series that were characterized by poor quality and weakly correlated to the master chronology were excluded from further analyses. The complete radius measurements from each of the cross sections from individual plants (–) were cross-dated, averaged, and used to plot individual shrub ring curves (; individual plant chronology). Individual detrending was determined as the best-fitting method and applied to the data. Well-correlated, detrended, standardized individual radial growth curves were averaged to construct the overall site chronology for subsequent analyses.
Meteorological data and methods
We used chronological series of daily air temperatures (mean, max, min), daily precipitation (rain, snow), and daily snow cover depth registered at the Kuujjuarapik station (12.2 m a.s.l., 55°17′00″ N, 77°45′00″ W, Québec, Canada) from October 1925 to March 2014. Additional data from April 2014 to December 2017 were only available at higher time resolution (one hour) and did not include precipitation or snow cover. Both data sets were downloaded from the National Climate Archives of Canada (climate.weather.gc.ca; accessed March 1, 2018). The data sets were incomplete; missing data were observed for mean daily temperature (8 percent), maximum and minimum daily air temperature (7 percent), total daily precipitation (7 percent), daily rain precipitation (6 percent of days), and daily snow depth cover (8 percent). The gaps in sub-daily air temperature, calculated as days where at least one measurement was missing, amounted to 3 percent of days. We reduced this value to 1.5 percent by calculating daily averages for days with nonconsecutive gaps and with a maximum of three missing data.
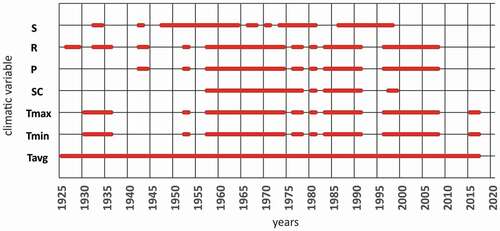
We used these daily data to calculate the monthly and annual values of twenty-two climatological indices (). Months with two or more days with missing data were excluded from further analyses. The precipitation and thermal indices series extend to 2014 and 2017, respectively. The temporal coverage of the data used to calculate the indices is shown in . The indices describe both mean and extreme thermal and moisture conditions, including, in the latter case, the amount and frequency of precipitation and its basic types (snow, rain). Ultimately, the percentage of gaps in the monthly data (between 1925 and either 2014 or 2017, depending on the index) varied: 10 percent for monthly rain totals and 17 percent for monthly snow totals. Only in the case of snow cover depth was this percentage as high as 42 percent. Most of these gaps were for the period between 1925 and 1957. Because air temperature is a crucial meteorological factor and much less spatially variable than precipitation, we decided to fill the gaps in monthly mean air temperature with data from the Global Historical Climatology Network database (Menne et al. Citation2012) for Kuujjuarapik and to use data from other neighboring stations with high correlation coefficients (>0.7) between corresponding monthly air temperatures (). The gaps were replaced by values interpolated from these neighboring stations. This enabled us to obtain complete series of average monthly air temperatures covering the 1925 to 2017 period. In addition to the monthly temperature means and precipitation totals commonly used in dendroclimatic studies, we defined and used a set of thermal and precipitation indices () in order to identify the most important climatic factor influencing the width of annual growth rings.
Table 1. Definitions of thermal and precipitation indices
Table 2. Correlation coefficients between monthly air temperatures at Kuujjuarapik and corresponding air temperatures at neighboring stations. The monthly air temperatures from these stations were used to reduce the gaps in the Kuujjuarapik series. h - altitude m a.s.l
Figure 6. Temporal coverage of climatic data for the Kuujjuarapik station. Lines represent years with complete monthly data calculated according to the rules adopted in this article. S = snow, R = rain, P = precipitation, SC = snow cover, Tmax = maximum air temperature, Tmin = minimum air temperature, Tavg = average air temperature
The climate–growth relationships were explored using Pearson’s correlation coefficients and response function on a monthly, as well as on a seasonal basis. To assess the significance of the correlation analyses, we used a bootstrapping procedure. All statistical analyses were performed using the DENDROCLIM2002 software. In addition to time series correlation analyses, discrete data analyses were conducted (extreme and frost ring years). Frost rings are formed in shrub stems when growing season frosts affect wood cells, producing collapsed cells within the annual tree ring. Frost ring chronologies may be used as proxies of severe frost events occurring during the growing season (Schweingruber Citation1989; Payette, Delwaide, and Simard Citation2010). An extreme year was defined as a specific year in which a single shrub formed a conspicuously narrower ring (Schweingruber Citation1989) using a threshold value of 2 SD.
Results
Bearberry willow growth rings, frost rings, and extreme-year chronologies
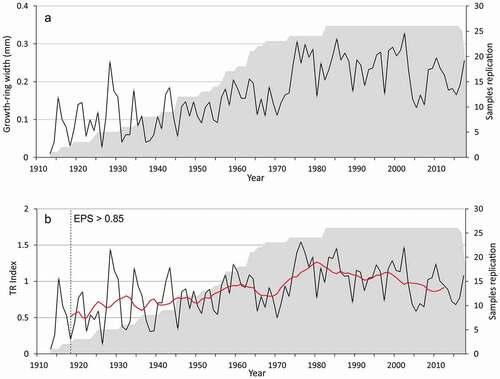
Based on twenty-six of the forty bearberry willow individuals that were sampled, a 105-year growth chronology was established (). The remaining samples were removed due to a large number of missing rings, a pronounced eccentricity, or the presence of scars and reaction wood. Total series intercorrelation between individual series and the master chronology was 0.461, with a mean sensitivity of 0.424. Average annual radial growth was 0.211 mm (± 0.11 SD). The constructed chronologies, both from individual plants and from their different parts, were characterized by high variability. Mean shrub age was 89 years old, with the youngest and oldest individuals being 25 and 105 years old. Since 1919, the growth chronology was characterized by a reasonable common signal, represented by rbar > 0.35 and expressed population signal > 0.85. In general, the long-term course of the chronology showed a positive trend of radial growth (R2 = 0.30). However, the growth ring width decreased from 1965 to 1973 and from 2003 to 2017.
Figure 7. Time series plot of the bearberry willow (A) ring width and (B) index chronologies for the eastern shore of Hudson Bay covering the last 105 years. Red line indicates eleven-year moving average. Gray shading represents changing sample sizes between years. Note the decline in growth in recent decades
Analysis of bearberry willow wood anatomy showed that years with exceptional climatic conditions, triggering the formation of frost rings or extremely narrow rings, could be observed for this species. Frost ring occurrence was correlated to late frosts (in August) in 1982 and 1996. Frost damage associated with early frosts and drops of absolute minimum air temperature below −15°C in May occurred in the years 1983, 1990, and 2017. Extremely narrow rings were the result of extreme meteorological conditions (). In 1980 and 1989, the length of the growth seasons was negatively influence by the persistence of snow cover. Narrow rings were associated with late winter/early spring low temperatures and thick snow cover. Moreover, most extreme climatic years may be associated with the occurrence of freeze–thawing cycles in late spring/early autumn (1980, 1989). For example, in May 1926, there was a sharp increase in temperature (24.4°C) over a few days. The subsequent decrease in air temperature at the end of May led to freezing episodes that likely resulted in damage incurred to the aboveground biomass, limiting the photosynthetic capacity of the individuals and leading to the formation of an extremely narrow ring.
Table 3. Meteorological conditions accompanying the formation of negative dendrochronological years
Influence of climate factors on radial growth
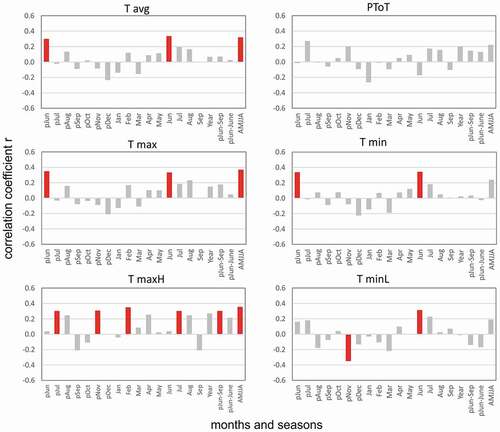
We found generally positive correlations between the bearberry willow growth chronology and warm-season air temperatures (April to August; r = 0.32–0.37, p < .05; ). The correlations with June mean, maximum, and minimum temperatures were similar (r = 0.33–0.34, p < .05), with slightly stronger correlations for minimum temperatures (r = 0.37, p < .05). Absolute maximum temperatures in February (r = 0.35, p < .05) and July (r = 0.31, p < .05) were also significantly correlated to the growth chronology. However, the growth of bearberry willow was not significantly correlated to monthly precipitation.
Figure 8. Single-month and strongest seasonal correlations of the bearberry willow chronology. Tavg = average air temperature; PToT = precipitation total, Tmax = maximum air temperature, Tmin = minimum air temperature, TmaxH = absolute maximum air temperature, TminL = absolute minimum air temperature. Statistically significant values are marked by colored bars (p(a) < .05, n = 35, 1957–1992)
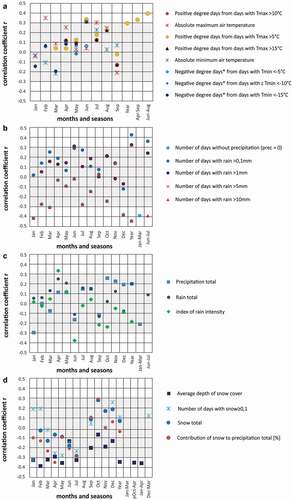
For thermal indices, the highest correlation coefficients were obtained for the growing degree days (days with Tmax > 5°C) summed from May and August (r = 0.40, p < .05; ). The calculated precipitation indices enabled us to conclude that the number of days with rainfall (≥0.1 mm) was more important for shrub growth than the monthly sum of precipitation. We found significant correlations between growth ring width and the number of days with rainfall (≥0.1 mm) in June–July and the number of wet days (1 mm). A similar relation was observed for the annual indices. In contrast, the negative correlation coefficient between the growth chronology and the number of days with high precipitation (≥10 mm) in summer (June–July) was significant (r = −0.39, p < .05; ). We also found significant negative correlations between shrub growth and January snowfall totals (r = −0.30, p < .05) and between shrub growth and depth of snow cover from January to May (r = −0.34, p < .05). The influence of the persistence of snow cover, defined as the latest date with a snow cover, is statistically significant (r = −0.42, p < .05).
Figure 9. Results of climate–growth response analyses comparing the bearberry willow chronology and various (A) thermal, (B), (C) precipitation, and (D) snow indices calculated based on daily data from the Kuujjuarapik meteorological station. Gray shading indicates statistically insignificant values (p(a) > .05, n = 35, 1957–1992)
Discussion and conclusions
In this study, we conducted dendrochronological analyses on bearberry willow individuals (twenty-six) from the east coast of Hudson Bay to produce the first absolutely dated chronology of annual rings of this species. To our knowledge, it is the first time that this species has been analyzed using the dendrochronological method. Our growth chronology covers the period from 1913 to 2017. The chronology, built from samples taken at different locations on the shrubs, exhibits high variability, which was expected because the species is known to become established and grow on rock fissures with poorly developed soils. This high variability in growth ring width is likely associated with the limiting influence of solid rocks and variation in the weathering rate in crevices and their widening, resulting in the sudden release of growth limitation (Malik et al. Citation2019). By using new indicators in dendroclimatology, we were able to put forward a more detailed interpretation of the factors controlling the growth of this species. Our results confirm the potential of this species for use in studies aimed at evaluating the influence of temperature and precipitation changes on the dynamics of tundra vegetation. Our results improve understanding of the complex ecological mechanisms that drive vegetation productivity in the extremely sensitive taiga–tundra ecotone in subarctic Québec.
Warmer temperatures during the growing season and the frequency of days with at least 0.1 mm of rain have a positive effect on radial growth, through the constant supply of moisture to the plant. Because Whapmagoostui–Kuujjuarapik is located along the coast, frequent fogs can also be an additional and significant source of moisture. The importance of advection fog and sea fog during spring to fall, when the Hudson Bay is not frozen, is correlated negatively to the distance from the bay (Gough and He Citation2015). These factors can be substantial drivers of the “greening” of the tundra, mainly associated to the expansion of shrub species. The importance of soil moisture and the role of atmospheric precipitation have been previously observed for willows from the Svalbard Archipelago in the High Arctic (Owczarek and Opała Citation2016; Opała-Owczarek et al. Citation2018) and Siberia (Blok et al. Citation2011) but was often ignored in studies focusing only on the influence of summer temperature (Weijers, Broekman, and Rozema Citation2010; Buchwał et al. Citation2013; Beil et al. Citation2015). For temperature, the highest correlation coefficients were obtained with the sum of maximum temperatures above 5°C from May to August. However, based on complex dendroclimatological investigations, combining our findings with previous research on the relationship of shrub growth to climate, we concluded that temperature cannot be considered the lone factor driving shrub growth. Combining various precipitation indices also enabled us to state that short-term, high-intensity rainfall during the summer season is not beneficial for willow growth. Rapid surface runoff on the bedrock leaves no time for water infiltration into rock crevices and, therefore, a relatively small amount of water is available to plants. On the other hand, rock plants, such as bearberry willow, usually prefer stony and dry exposed rocky bedrock and do not tolerate their roots being in stagnant water for long periods of time (see Körner Citation2003; Argus, Eckenwalder, and Kiger Citation2010). Our results corroborate the latest scientific report of the Arctic Monitoring and Assessment Programme (AMAP Citation2017), which showed that the drivers of shrub growth are diverse and interact in complex ways.
In addition to growing season climatic conditions, large volumes of snowfall and high values of snow cover thickness appear to be important drivers of shrub growth. Moreover, the extended duration of snow cover delayed bearberry willow growing season. By preventing the shrub from having access to light and heat, which delays the initiation of cambium activity, an extended snow cover leads to a decrease in radial growth, resulting in the formation of narrow rings. The positive role of snow cover on annual growth, as presented by Vaganov et al. (Citation1999), was therefore not confirmed. Weijers, Myers-Smith, and Löffler (Citation2018) stated that deeper snow may shorten the growing season; however, they found no evidence for any effect of winter precipitation on shrub growth. Various growth ring responses to snow cover indicate that the complex signals of the winter climate affect radial growth. Moreover, the positive and negative effects of snow cover may cancel each other out, leading to a relative equilibrium (Qin et al. Citation2016; Weijers, Myers-Smith, and Löffler Citation2018). In our study, it is also possible that snow cover measurements at the Kuujjuarapik climatic station (12 m a.s.l.) did not represent snow conditions on mountain tops where the species was sampled.
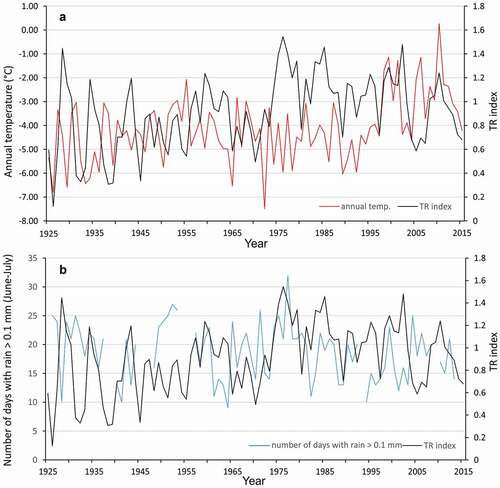
Our results illustrate that temperature is one of several drivers of bearberry willow radial growth (). In fact, the number of days with precipitation might be a better driver to explain the radial growth of this species (). However, interannual growth ring variability is difficult to explain due to the complex interactions of hydrometeorological factors and their variability over time. It should be noted that the observed shrub expansion may be inhibited in the future as a result of a continuous increase in temperatures with relatively low change in precipitation, resulting in a drier environment (; ). In fact, trends for the selected precipitation indices that were significantly correlated to bearberry willow radial growth only showed slight increases in the frequency of days with rain (>0.1 mm, >1 mm, and >10 mm) for the period 1957 to 2014. This trend may lead to a reduction in plant productivity, which could lead to tundra browning (AMAP Citation2017). The reduction in the radial growth of the analyzed bearberry willow specimens over the last fifteen years may be the first indication of this phenomenon.
Table 4. Trends in selected precipitation indices and mean temperature impacting (significantly correlated) the radial growth of bearberry willow for the period 1957–2014
Figure 10. Comparisons of variability of bearberry willow growth rings indices with (A) annual mean temperature and (B) number of days with rain >0.1 mm
Acknowledgments
The authors thank Maxime Saunier and the staff of the Whapmagoostui–Kuujjuarapik Research Station for their assistance in fieldwork and Najat Bhiry from the Centre for Northern Studies, Laval University, for field discussions. We also thank the local community of Whapmagoostui–Kuujjuarapik for kind permission to conduct field research within their traditional territory. We gratefully acknowledge two anonymous reviewers for their constructive comments.
Disclosure statement
No potential conflict of interest was reported by the authors.
Additional information
Funding
References
- AMAP (Arctic Monitoring and Assessment Programme). 2017. Snow, water, ice and permafrost in the Arctic (SWIPA) 2017. Oslo, Norway: Arctic Monitoring and Assessment Programme.
- Argus, G. W., J. E. Eckenwalder, and R. W. Kiger. 2010. Salicaceae. In Flora of North America North of Mexico, ed. Flora of North America Editorial Committee, Vol. 7, 3–164. New York and Oxford: Oxford University Press.
- Atlas of Canada. 2010. Atlas of Canada Reference Outline Map Series 61, (ed. 6), Natural Resources Canada.
- Beil, I., A. Buras, M. Hallinger, M. Smiljanić, and M. Wilmking. 2015. Shrubs tracing sea surface temperature - Calluna vulgaris on the Faroe Islands. International Journal of Biometeorology 59 (11):1567–75. doi:https://doi.org/10.1007/s00484-015-0963-4.
- Bélisle, L., and L. Maillette. 1988. Stratégie de tolérance au vent chez Salix uva-ursi, une espèce de la toundra du Nouveau-Québec (Canada). Canadian Journal of Botany 66 (2):272–79. doi:https://doi.org/10.1139/b88-045.
- Bhiry, N., A. Delwaide, M. Allard, Y. Bégin, L. Filion, M. Lavoie, C. Nozais, S. Payette, R. Pienitz, E. Saulnier-Talbot, et al. 2011. Environmental change in the Great Whale River region, Hudson Bay: Five decades of multidisciplinary research by CEN. Ecoscience 18:182–203. doi:https://doi.org/10.2980/18-3-3469.
- Blok, D., U. Sass-Klaassen, G. Schaepman-Strub, M. M. P. D. Heijmans, P. Sauren, and F. Berendse. 2011. What are the main climate drivers for shrub growth in Northeastern Siberian tundra? Biogeosciences 8:1169–79. doi:https://doi.org/10.5194/bg-8-1169-2011.
- Brown, R. J. E. 1979. Permafrost distribution in the southern part of the discontinuous zone in Québec and Labrador. Géographie physique et Quaternaire 33 (3–4):279–89.
- Buchwał, A., G. Rachlewicz, P. Fonti, P. Cherubini, and H. Gärtner. 2013. Temperature modulates intra-plant growth of Salix polaris from a high Arctic site (Svalbard). Polar Biology 36:1305–18. doi:https://doi.org/10.1007/s00300-013-1349-x.
- Callaghan, T. V., R. M. M. Crawford, M. Eronen, A. Hofgaard, S. Payette, W. G. Rees, O. Skre, J. Sveinbjornsson, T. K. Vlassova, and B. R. Werkman. 2002. The dynamics of the tundra-taiga boundary: An overview and suggested coordinated and integrated approach to research. AMBIO 12:3–5.
- Canada Department of Mines and Technical Surveys. 1959. Atlas of Canada, 3rd Edition. Natural Resources Canada.
- Chapin, F. S., T. V. Callaghan, Y. Bergeron, M. Fukuda, J. F. Johnstone, G. Juday, and S. A. Zimov. 2004. Global change and the boreal forest: Thresholds, shifting states or gradual change? AMBIO 33 (6):361–65. doi:https://doi.org/10.1579/0044-7447-33.6.361.
- Frost, G. V., and H. E. Epstein. 2014. Tall shrub and tree expansion in Siberian tundra ecotones since the 1960s. Global Change Biology 20:1264–77. doi:https://doi.org/10.1111/gcb.2014.20.issue-4.
- Gärtner, H., L. Banzer, L. Schneider, F. H. Schweingruber, and A. Bast. 2015. Preparing micro sections of entire (dry) conifer increment cores for wood anatomical time-series analyses. Dendrochronologia 34:19–23. doi:https://doi.org/10.1016/j.dendro.2015.03.004.
- Gough, W. A., and D. He. 2015. Diurnal temperature asymmetries and fog at Churchill, Manitoba. Theoretical and Applied Climatology 121 (1–2):113–19. doi:https://doi.org/10.1007/s00704-014-1227-7.
- Guiot, J. 1985. Reconstruction of seasonal temperatures and sea-level pressures in the Hudson Bay area back to 1700. Climatological Bulletin 19:11–59.
- Harper, K. A., R. Danby, D. De Fields, K. Lewis, A. Trant, B. Starzomski, R. Savidge, and L. Hermanutz. 2011. Tree spatial pattern within the forest–tundra ecotone: A comparison of sites across Canada. Canadian Journal of Forest Research 41 (3):479–89. doi:https://doi.org/10.1139/X10-221.
- Harsch, M. A., P. E. Hulme, M. S. McGlone, and R. P. Duncan. 2009. Are treelines advancing? A global meta-analysis of treeline response to climate warming. Ecology Letters 12:1040–49. doi:https://doi.org/10.1111/ele.2009.12.issue-10.
- Hill, G. B., and G. H. R. Henry. 2011. Responses of high arctic wet sedge tundra to climate warming since 1980. Global Change Biology 17:276–87. doi:https://doi.org/10.1111/gcb.2010.17.issue-1.
- Hofgaard, A., H. Tommervik, G. Rees, and F. Hanssen. 2013. Latitudinal forest advance in northernmost Norway since the early 20th century. Journal of Biogeography 40 (5):938–49. doi:https://doi.org/10.1111/jbi.12053.
- Holmes, R. L. 1983. Computer-assisted quality control in tree-ring dating and measurement. Tree-Ring Bulletin 43:69–78. https://catalog.data.gov/dataset/global-historical-climatology-network-daily-ghcn-daily-version-3.
- IPCC (Intergovernmental Panel on Climate Change). 2013. Climate change 2013: The physical science basis. Cambridge: Cambridge University Press.
- Jacoby, G. C. 1983. A dendroclimatic study in the forest-tundra ecotone on the eastern shore of Hudson Bay. Nordicana 47:95–99.
- Jacoby, G. C., I. S. Ivanciu, and L. D. Ulan. 1988. A 263-year record of summer temperature for northern Québec reconstructed from tree-ring data and evidence of a major climatic shift in the early 1800’s. Palaeogeography, Palaeoclimatology, Palaeoecology 64:69–78. doi:https://doi.org/10.1016/0031-0182(88)90143-5.
- Jia, G. J., H. E. Epstein, and D. A. Walker. 2009. Vegetation greening in the Canadian Arctic related to decadal warming. Journal of Environmental Monitoring 11:2231–38. doi:https://doi.org/10.1039/b911677j.
- Jørgensen, R. H., M. Hallinger, S. Ahlgrimm, J. Friemel, J. Kollmann, and H. Meilby. 2015. Growth response to climatic change over 120 years for Alnus viridis and Salix glauca in West Greenland. Journal of Vegetation Science 26:155–65. doi:https://doi.org/10.1111/jvs.12224.
- Kolishchuk, V. G. 1990. Dendroclimatological study of prostrate woody plants. In Methods of dendro-chronology. Applications in the environmental sciences, ed. E. R. Cook and L. A. Kairiukstis, 51–55. London: Kluwer.
- Körner, C. 2003. Alpine plant life: Functional plant ecology of high mountain ecosystems. Berlin Heidelberg: Springer-Verlag.
- Latifovic, R., and D. Pouliot. 2005. Multitemporal land cover mapping for Canada: Methodology and products. Canadian Journal of Remote Sensing 31 (5):347–63. doi:https://doi.org/10.5589/m05-019.
- Le Moullec, M., A. Buchwal, R. van der Wal, L. Sandal, and B. B. Hansen. 2019. Annual ring growth of a widespread high arctic shrub reflects past fluctuations in community‐level plant biomass. Journal of Ecology 107:436–51. doi:https://doi.org/10.1111/1365-2745.13036.
- MacDonald, G. M., J. M. Szeicz, J. Claricoates, and K. A. Dale. 1998. Response of the central Canadian treeline to recent climatic changes. Annals of the Association of American Geographers 88 (2):183–208. doi:https://doi.org/10.1111/1467-8306.00090.
- Maillette, L., L. Bélisle, and M. K. Seguin. 1988. Perte de compétitivité par adaptation au milieu physique: Cas du Salix uva-ursi dans la toundra du Nouveau-Québec. Canadian Journal of Botany 66 (8):1532–38. doi:https://doi.org/10.1139/b88-211.
- Malik, I., Ł. Pawlik, A. Ślęzak, and M. Wistuba. 2019. A study of the wood anatomy of Picea abies roots and their role in biomechanical weathering of rock cracks. CATENA 173:264–75. doi:https://doi.org/10.1016/j.catena.2018.10.018.
- Menne, M. J., I. Durre, R. S. Vose, B. E. Gleason, and T. G. Houston. 2012. An overview of the global historical climatology network-daily database. Journal of Atmospheric and Oceanic Technology 29:897–910. doi:https://doi.org/10.1175/JTECH-D-11-00103.1.
- Murdock, T., S. Sobie, and J. Hiebert. 2014. Statistical downscaling of future climate projections for North America: report on contract no: KM040-131148/A. https://www.pacificclimate.org/sites/default/files/publications/PCIC_EC_downscaling_report_2014.pdf.
- Myers-Smith, I. H., B. C. Forbes, M. Wilmking, M. Hallinger, T. Lantz, D. Blok, K. D. Tape, M. Macias-Fauria, U. Sass-Klaassen, E. Lévesque, et al. 2011. Shrub expansion in tundra ecosystems: Dynamics, impacts and research priorities. Environmental Research Letters 6:045509. doi:https://doi.org/10.1088/1748-9326/6/4/045509.
- Myers-Smith, I. H., M. Hallinger, D. Blok, U. Sass-Klaassen, S. A. Rayback, S. Weijers, A. J. Trant, K. D. Tape, A. T. Naito, S. Wipf, et al. 2015. Methods for measuring arctic and alpine shrub growth: A review. Earth-Science Reviews 140:1–13. doi:https://doi.org/10.1016/j.earscirev.2014.10.004.
- Opała-Owczarek, M., E. Pirożnikow, P. Owczarek, W. Szymański, B. Luks, D. Kępski, M. Szymanowski, B. Wojtuń, and K. Migała. 2018. The influence of abiotic factors on the growth of two vascular plant species (Saxifraga oppositifolia and Salix polaris) in the High Arctic. Catena 163:219–32. doi:https://doi.org/10.1016/j.catena.2017.12.018.
- Owczarek, P., and M. Opała. 2016. Dendrochronology and extreme pointer years in the tree-ring record (AD 1951–2011) of polar willow from southwestern Spitsbergen (Svalbard, Norway). Geochronometria 43 (1):84–95. doi:https://doi.org/10.1515/geochr-2015-0035.
- Payette, S. 1983. The forest tundra and present tree lines of the northern Québec-Labrador Peninsula. Nordicana 47:3–23.
- Payette, S., A. Delwaide, and M. Simard. 2010. Frost-ring chronologies as dendroclimatic proxies of boreal environments. Geophysical Research Letters 37 (2):L02711. doi:https://doi.org/10.1029/2009GL041849.
- Payette, S., and B. Gauthier. 1972. Les structures de la vegetation: Interpretation geographique et ecologique, classification et application. Le Naturaliste canadien 99 (1):1–26.
- Payette, S., L. Filion, L. Gauthier, and Y. Boutin. 1985. Secular climate change in old- growth tree-line vegetation of northern Québec. Nature 315:135–38. doi:https://doi.org/10.1038/315135a0.
- Przybylak, R. 2016. The climate of the Arctic, 2nd ed. Atmospheric and Oceanographic Sciences Library 52. Switzerland: Springer.
- Qin, L., Y. Yuan, R. Zhang, W. Wei, S. Yu, Z. Fan, F. Chen, T. Zhang, and H. Shang. 2016. Tree-ring response to snow cover and reconstruction of century annual maximum snow depth for northern Tianshan Mountains, China. Geochronometria 43:9–17. doi:https://doi.org/10.1515/geochr-2015-0026.
- Raynolds, M. K., J. C. Comiso, D. A. Walker, and D. Verbyla. 2008. Relationship between satellite-derived land surface temperatures, arctic vegetation types, and NDVI. Remote Sensing of Environment 112:1884–94. doi:https://doi.org/10.1016/j.rse.2007.09.008.
- Régent Instruments. 2014. WinDENDRO: An image analysis system for annual tree-rings analysis. Reference manual. Québec: Régent Instruments.
- Ropars, P., S. Angers‐Blondin, M. Gagnon, I. H. Myers‐Smith, E. Levesque, and S. Boudreau. 2017. Different parts, different stories: Climate sensitivity of growth is stronger in root collars versus stems in tundra shrubs. Global Change Biology 23:3281–91. doi:https://doi.org/10.1111/gcb.13631.
- Ropars, P., and S. Boudreau. 2012. Shrub expansion at the forest–tundra ecotone: Spatial heterogeneity linked to local topography. Environmental Research Letters 7:015501. doi:https://doi.org/10.1088/1748-9326/7/1/015501.
- Rouse, W. R. 1991. Impacts of Hudson Bay on the terrestrial climate of the Hudson Bay lowlands. Arctic and Alpine Research 23 (1):24–30. doi:https://doi.org/10.2307/1551433.
- Schweingruber, F. 1989. Tree rings - basics and applications of dendrochronology. Dordrecht: Kluwer Academic Publishers.
- Tape, K. D., M. Sturm, and C. H. Racine. 2006. The evidence for shrub expansion in northern Alaska and the pan Arctic. Global Change Biology 12:686–702. doi:https://doi.org/10.1111/gcb.2006.12.issue-4.
- Tremblay, B., E. Levesque, and S. Boudreau. 2012. Recent expansion of erect shrubs in the low arctic: Evidence from Eastern Nunavik. Environmental Research Letters 7:035501. doi:https://doi.org/10.1088/1748-9326/7/3/035501.
- Vaganov, E. A., A. V. Kirdyanov, F. H. Schweingruber, and P. P. Silkin. 1999. Influence of snowfall and melt timing on tree growth in subarctic Eurasia. Nature 400:149–51. doi:https://doi.org/10.1038/22087.
- VIAS (Vienna Institute of Archaeological Science). 2006. On Screen Measuring and Image Analysis. Installation and Instruction Manual, Version 2.1. SCIEM – Scientific Engineering & Manufacturing, VIAS, Vienna.
- Weijers, S., A. Buchwal, D. Blok, J. Löffler, and B. Elberling. 2017. High Arctic summer warming tracked by increased Cassiope tetragona growth in the world’s northernmost polar desert. Global Change Biology 23:5006–20. doi:https://doi.org/10.1111/gcb.2017.23.issue-11.
- Weijers, S., I. H. Myers-Smith, and J. Löffler. 2018. A warmer and greener cold world: Summer warming increases shrub growth in the alpine and high arctic tundra. Erdkunde 72 (1):63–85. doi:https://doi.org/10.3112/erdkunde.2018.01.04.
- Weijers, S., R. Broekman, and J. Rozema. 2010. Dendrochronology in the High Arctic: July air temperatures reconstructed from annual shoot length growth of the circumarctic dwarf shrub Cassiope tetragona. Quaternary Science Reviews 29:3831–42. doi:https://doi.org/10.1016/j.quascirev.2010.09.003.
- Weijers, S., R. Pape, J. Löffler, and I. H. Myers-Smith. 2018. Contrasting shrub species respond to early summer temperatures leading to correspondence of shrub growth patterns. Environmental Research Letters 13:034005. doi:https://doi.org/10.1088/1748-9326/aaa5b8.
- Wolf, A., K. Larsson, and T. V. Callaghan. 2008. Future vegetation changes in the Barents region. Climatic Change 87:51–73. doi:https://doi.org/10.1007/s10584-007-9342-4.
- Young, A. B., D. A. Watts, A. H. Taylor, and E. Post. 2016. Species and site differences influence climate-shrub growth responses in West Greenland. Dendrochronologia 37:69–78. doi:https://doi.org/10.1016/j.dendro.2015.12.007.