
 ?Mathematical formulae have been encoded as MathML and are displayed in this HTML version using MathJax in order to improve their display. Uncheck the box to turn MathJax off. This feature requires Javascript. Click on a formula to zoom.
ABSTRACT
Hydrologic processes that control river flow in Bhutan’s Chamkhar Chhu basin are important for understanding water supply vulnerability to downstream populations in a changing climate. Seasonal source waters and flow paths of streamflow of the basin were determined using isotopic and geochemical tracers for water year 2016. Samples including surface water, groundwater, glacier meltwater, and precipitation were collected in premonsoon, monsoon, and postmonsoon seasons along an elevation transect from 2,538 to 5,158 m. Solute trends in surface waters demonstrate the major influence that tributaries can have on main stem hydrochemistry and the increasingly important role of groundwater below 3,500 m. Groundwater’s role in flow is supported by a two-component hydrograph separation using SO42− as a tracer and shows that groundwater is especially important to river flow in the premonsoon. Source waters to river flow were calculated using δ18O as a tracer, indicating that rain and meltwater are more evenly important across the elevation transect in the early monsoon period than in the postmonsoon period when ice melt contributions rapidly wane with distance from the glacier.
Introduction
The Himalayas are regularly referred to as the “Water Towers of Asia,” sourcing river flow in the major basins of Asia, including the Ganges and Brahmaputra Rivers, and providing water to huge population centers downstream (Xu et al. Citation2009). The Brahmaputra originates from the glaciers of the Tibetan Plateau, India, and Bhutan and travels through China and India before flowing into the Bay of Bengal in Bangladesh (Lucarini and Pascale Citation2012; Masood et al. Citation2015). The Brahmaputra basin supports the livelihoods of over 66 million people through subsistence agriculture, industry, and hydropower, in addition to providing important ecological services to the region (Nepal and Shrestha Citation2015; Pervez and Henebry Citation2015). The river discharge of the Brahmaputra basin is mainly controlled by monsoon rainfall, snow, and glacial meltwater. These sources are estimated to provide more than a quarter of the river discharge above an elevation of 2,000 m (Immerzeel, van Beek, and Bierkens Citation2010; Lucarini and Pascale Citation2012).
Cryospheric water sources such as ice and seasonal snow are highly sensitive to warming temperatures, so climate change impacts on the snowpacks and glaciers in High Mountain Asia may have compounding effects on water availability and food security in Asia (Rupper et al. Citation2012). Bhutan’s economy is heavily dependent on agriculture, with approximately 69 percent of the population in Bhutan practicing subsistence farming (Katwal Citation2013). Bhutan’s economy is also reliant on energy exports to India. Its largely untapped hydropower potential is estimated to be 30,000 MW (Tshering and Tamang Citation2004), with national development plans to generate 10,000 MW capacity by 2020 (Chhopel Citation2014). Changes in glacier melt runoff and precipitation phase (snow versus rain) may alter the water reliability and availability to downstream plains and future hydropower projects, affecting economic activity in the region (Nepal, Flügel, and Shrestha Citation2014). A study by Rupper et al. (Citation2012) demonstrated that even if climate were to remain at the present-day mean values, almost 10 percent of Bhutan’s glacierized area would vanish and the meltwater flux would drop by as much as 30 percent.
Growing concerns about the changing flow patterns of streams and rivers attributed to negative glacier mass balance and irregular and erratic monsoons (Iwata Citation2010; Beldring and Voksø Citation2011; Naito et al. Citation2012) motivate improving our understanding of the contributions from monsoon rainfall, seasonal snow, and melting glacier ice to the river discharge. Previous studies have reported dynamics of glacier systems (Li et al. Citation2015) and snow cover (Gurung et al. Citation2011, Citation2017), and their implications to runoff processes in the glacierized basins of Hindu Kush Himalaya including Bhutan using metrological data and remotely sensed data. Though these studies have merit, a gap in current investigations is in using in situ data to more explicitly define the river flow generation processes on the ground that will better support managing the region’s water resources.
Tracer-based mixing models utilize distinctive isotopic and hydrochemical signatures associated with waters from different origins (Drever Citation1988; Laudon et al. Citation2002; Carey and Quinton 2005; Beaulieu, Schreier, and Jost Citation2012; Williams et al. Citation2016; Penna et al. Citation2017) to parse out relative flow contributions from ice, snow, and rain. An advantage of the tracer method in remote and data-scarce regions like Bhutan is that detailed, long-term glaciological and metrological observations are not required. A single synoptic sampling suite is adequate to provide a first-order understanding of the major hydrologic processes within a watershed at a single snapshot in time, as presented by an initial tracer study in the Chamkhar Chhu basin by Williams et al. (Citation2016).
Here we build from Williams et al. (Citation2016) by extending the scope both temporally and spatially. To better describe the hydrologic sources and processes that generate river flow in the Chamkhar Chhu basin, we present data collected over the course of a water year in premonsoon, monsoon, and postmonsoon time periods and over a 2,620 m elevation transect. The study presented here extends from the high-elevation glaciers down to the lower lying areas closer to where people, agriculture, and hydropower utilize the water, increasing the societal relevance of the previous study. This study aims to respond to the following questions:
What is the proportion of streamflow provided separately by glacier ice melt and precipitation along an elevation transect from 2,538 to 5,158 m?
How does the relative contribution of ice melt and precipitation to streamflow change seasonally?
What role does groundwater play in streamflow generation in the basin?
By addressing these research questions, we provide further insights into the potential changes to discharge patterns and water vulnerabilities in meltwater-sourced basins in the context of a warming world.
Study site
Bhutan is in the Eastern Himalayas between India to the south and China to the north, with an estimated population of 700,000 people. The study site, the Chamkhar Chhu (“Chhu” meaning “river”), is one of four glaciated headwater basins that feed the Brahmaputra (Mool et al. Citation2001; ). The Chamkhar Chhu eventually becomes the Manas Chhu (Savada Citation1991), a major tributary of the Brahmaputra River, contributing an estimated 5.48 percent of the Brahmaputra’s total discharge (Singh, Sharma, and Ojha Citation2013).
Figure 1. The study site in Chamkhar Chhu basin including glacial areas, all sampling locations, meteorological station, and flow gauge location. Top left inset: regional locator. Top right inset: cryospheric sampling points at the toe of the Thanagang glacier. Bottom left inset: river sampling locations at the main stem–Riphug tributary confluence
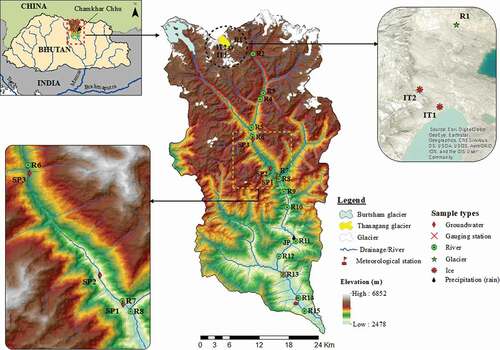
The Chamkhar Chhu basin is in the Bumthang district in North-Central Bhutan (), ranging in elevation from over 6,800 m at the Bhutan–Tibet border to 2,000 m at its lower extent. Bumthang experiences a temperate climate and receives an annual rainfall between 1,000 and 1,500 mm. Land cover in the district varies, including forest (51.79 percent consisting of mainly blue pine species) and glacier and snow-covered areas (10.82 percent; Forest Resources Management Division Citation2017). The upper extent of the study site, and the initial source of the Chamkhar Chhu, is the Thana Glacier at an elevation of 5,500 m. The headwater stream is joined by several other tributaries before reaching the lower boundary of our study domain at Gelikhar (sample point R15, 2,538 m). A discharge measurement site is co-located with sample point R13, and a climate station site is near sample point R14.
Materials and methods
Sampling protocol
Water samples for major ions were collected in high-density polyethylene bottles soaked overnight in deionized water and then rinsed five times with deionized water and dried; bottles were rinsed three times with filtered sample water at the time of collection. The samples were filtered in the field using Millipore 47-mm glass fiber filters (nominal pore size = 1.0 µm) following the protocols discussed in Williams, Seibold, and Chowanski (Citation2009). All filtered samples were stored in the refrigerator at 4°C for the subsequent laboratory analysis. Isotope samples were collected in 25 mL borosilicate vials and capped with airtight caps, leaving no headspace.
Sampling design and collection
A total of eighty-two samples including river surface water, groundwater springs, glacier outflow, glacier ice meltwater, and rain precipitation (, ) were collected during field campaigns in March, June, August, and October 2016. These months correspond to hydrologically important seasons: premonsoon (March), early monsoon (June), late monsoon (August), and postmonsoon (October). An additional sixteen samples were taken in July (monsoon), November (winter), and December (winter) below Damphel (R11, 2,725 m) because the local weather conditions resulted in limited site access.
Table 1. Sampling locations in the Chamkhar Chhu basin
River water samples (n = 74) were collected along an elevational transect from the snout of the Thanagang (Thana) glacier site (R1, 5,147 m) to Gelikhar (R15, 2,538 m; , ). The Thana glacier site (R1) is considered glacier outflow and one of the initial surface water sources to the Chamkhar Chuu basin. Samples were collected above and below locations where tributaries flowed into the main stem of the river to aid in understanding the impact of the tributary on the mainstem’s chemistry and isotopes.
Glacier ice samples (n = 8) were collected at the terminus of two sites at Thana glacier in the ablation zone (shown as IT1 and IT2 in ) during expeditions in March, June, August, and October (). At the time of collection, debris was cleared from the glacier surface and about 15 cm beneath the surface was dug with an ice ax until clean ice was obtained. The glacier ice samples were gathered into clean ziplock plastic bags and allowed to melt at room temperature. The melted glacier ice samples were then filtered and transferred into sampling bottles. Snow was not accessible during the sampling expeditions and thus was not collected.
Bulk precipitation (rain) samples (n = 4) were obtained approximately monthly from the collector located at Chokhortoe (JP in at 2,772 m) from June through October (). The bulk precipitation samples represent a monthly cumulative sample for June, July, August, and October. These provide a monthly, aggregated precipitation sample for chemistry analyses. The bulk precipitation collector was constructed and installed, and samples were collected following the protocol of Wilson (Citation2015). Unfortunately, precipitation collectors were unable to be installed at the higher elevation sites in the study area because of logistical constraints.
Three springs, at Riphug, Semthang, and Tsampawog (SP1, SP2, and SP3, respectively; ) were sampled as a proxy for the groundwater chemistry. These samples (n = 12) were collected during field campaigns in March, June, August, and October 2016.
Lab analysis
All river surface water, glacier meltwater, precipitation, and spring samples were analyzed for the following major ions: Ca2+, Na+, Mg2+, K+, Cl−, NO3−, and SO42−. These analyses were performed at the Kiowa Laboratory at the University of Colorado–Boulder. Analyses of major anions were performed by a Metrohm 930 compact ion chromatograph and major cations were analyzed by a Perkin Elmer AAnalyst 200 atomic absorption spectrometer.
The water-stable isotopes δ18O and δ2 H were analyzed using an L2130-i Picarro cavity ringdown spectrometer at the water chemistry laboratory run by the Center for Science and Environmental Research, Sherubtse College, Royal University of Bhutan. The δ18O and δ2 H values are expressed in conventional delta (δ) notation in per mil (‰) units relative to Vienna Standard Mean Ocean Water, where and
are the ratio of 18O/16O (heavy to light) as shown for
:
The precision of δ18O and δ2 H was ±0.05 and ±0.1 per mil, respectively. The deuterium excess (d) defined by Dansgaard (Citation1964) and derived from the Global Meteoric Water Line (GMWL; Craig Citation1961) was also calculated for all water samples collected. The deuterium excess (d) was calculated as follows:
Hydrograph separation
A two-component hydrograph separation model was used to separate streamflow components along the elevational gradient of the site using ions and isotopes of water as tracers (Sklash, Farvolden, and Fritz Citation1976; Hooper and Shoemaker Citation1986; Liu, Williams, and Caine Citation2004). We leveraged the ability of δ18O to differentiate source waters due to the variations in isotope composition between snow, ice, and rain. Geochemical products are indicative of water–rock interaction and suggest the extent (time and space) of subsurface flow paths. SO42− was preferred over Ca2+ in our model because of the extreme influence that the high-elevation Tsampa tributary has on the Ca2+ concentrations in river water downstream of this confluence. We suspect that the Tsampa’s high Ca2+ concentrations are not due to subsurface flow paths but rather to other geologic features, including the debris-covered glacier at the Tsampa River’s source.
Mixing model calculations were performed using standard mass balance equations. The discharge (Q) and the chemical concentration or isotope value of the water sample (C) are used to determine the contributions from the source waters or flow paths. The type of water sample is denoted by EM (end-member). The derivation is as follows:
Combining EquationEquations (4(4)
(4) ) and (Equation5
(5)
(5) ) and solving for QEM1 yields the following equation for the relative contribution (proportion) of end-member 1 to streamflow:
The applications of this model assume that (1) tracer values of each component must be significantly different, (2) there are only two components contributing to streamflow, and (3) the tracer composition of each component is constant for the duration of the event or variation is known from measurements (Suecker et al. Citation2000).
We conducted two models:
A chemistry-based mixing model using SO42− as the tracer with the Tsampawog site representing highly reacted groundwater and ice meltwater to represent the unreacted water that flows overland into the channel. We generally define waters to be “reacted” if they have high chemistry concentrations such as in Tsampawog spring. We define waters to be “unreacted” if they have low chemistry concentrations such as an overland flow source.
An isotope-based mixing model using δ18O as the tracer to quantify the variations in source waters to river flow with ice meltwater and rain as the end-members.
The uncertainty in the hydrograph separation calculation was estimated using Gaussian error propagation techniques following Genereux (Citation1998). The uncertainty W for the fraction of each end-member was calculated as
where C is tracer concentration, and subscripts EM1, EM2, and river refer to end-member 1, end-member 2, and river water components, respectively. Both models have uncertainty spatially and temporally.
Two glacial meltwater samples were sampled each trip, and the mean was used in the two models. The rain sample was collected as a monthly bulk rain sample. The Tsampawog spring was sampled each campaign. One river sample was collected at each site across the elevational gradient. This type of transactional sampling introduces longitudinal uncertainty into the mixing models, but these uncertainties were unavoidable due to the remote location with limited accessibility and safety concerns with sampling at 5,158 m. Thus, with one monthly sample used for the rain and spring samples and two glacial meltwater samples, the laboratory precision was used as an estimate for in the uncertainty calculations (Genereux Citation1998). The laboratory precisions of 0.05 per mil and 0.0541 µEqL−1 from the δ18O and SO42− measurements, respectively, were used for estimating W for components with a single sample. The river sample collected at each elevation represents the fraction of each end-member at that elevation, and the river sample does not introduce spatial or temporal uncertainty into the models.
Results and discussion
Hydroclimate
The high flow period as measured at the Kurjey flow gauge () coincides with both the warmest months of the year and the monsoon rain season (). The temperature and precipitation within the study region peak from May to September (). The mean peak discharge in the Chamkhar Chhu occurs in mid-July. In 2016, peak flow occurred on 27 July (457 m3 s−1) after a steep rising limb, followed by a similarly steep recession (, bottom). In 2016 there was a notable extreme precipitation event in mid-October, which caused an isolated spike in the hydrograph. This event was uncharacteristic outside of the monsoon season. We note here that the October (postmonsoon) sampling campaign reported in this article was conducted in early October prior to this event. Water sources and flow paths that may have been affected by this major storm are not reflected in our analyses.
Figure 2. Hydroclimate data from 1996 to 2016 including 2016 water year indicating annual fluctuations for (top) temperature, (middle) precipitation, (bottom) and discharge data for the study region
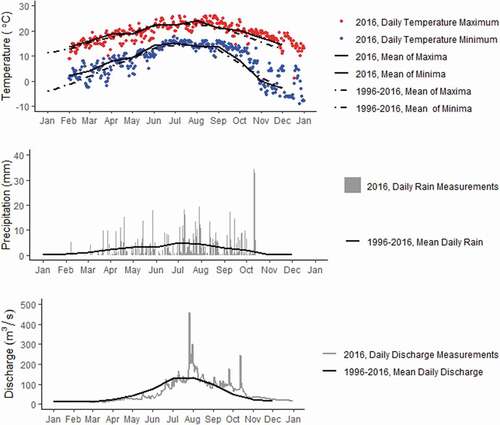
The months with minimum daily temperatures below 0°C measured at the climate station at 2,563 m occur during the dry winter periods from November to February, suggesting that much of the precipitation during this time is snow. At higher elevations, snowfall may occur during other parts of the year as well (Gurung et al. Citation2011, Citation2017).
Isotopic composition of river water
Isotopic elevation gradient
Across all elevations, early monsoon (June) river water is the most enriched in δ18O, followed by premonsoon (March), late monsoon (August), and postmonsoon (October; , Supplemental Table 1). Deuterium excess (Supplemental Figure 1) mostly mirrors the seasonal δ18O patterns, except for the high-elevation (R1 and R2) March samples, which have the highest deuterium excess of all river samples (15.99 and 16.96, respectively).
Figure 3. The δ18O gradient of river water samples with elevation. Precipitation δ18O is available during four months and is shown at the elevation of the rain collector. Dashed lines represent isotopic gradient trendlines for river water below 4,095 m
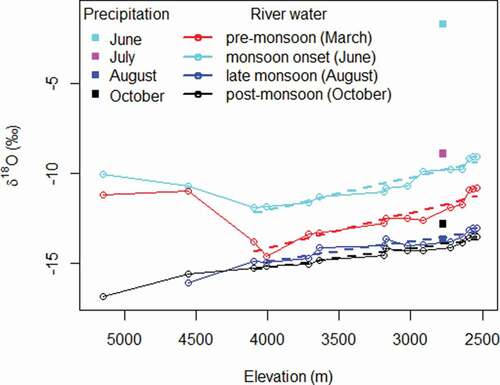
δ18O values in river water show consistent enrichment below 4,095 m with decreasing elevation across all seasons. The regressions of δ18O with elevation (; all significant at the p < .05 level) gives the isotopic rate of change below 4,095 m, with March and June having similar rates (+1.9 and +1.8 per mil per 1,000 m decrease in elevation) and August and October both at +1.0 per mil per 1,000 m elevation loss. The latter is similar to the approximately +0.98 per mil per kilometer reported previously in the Chamkhar Chhu by Williams et al. (Citation2016) for the composite rate for all seasons. Other nearby studies in Nepal report 0.6 per mil per 1,000 m (Racoviteanu, Armstrong, and Williams Citation2013) and 0.9 per mil (Wilson et al. Citation2016).
The two highest elevation sample points (R1 and R2) revealed an inflection point at the 4,095 m elevation in March and June (), suggesting that a separate process influences isotope composition above 4,095 m in the pre- and early monsoon season. The δ18O values of the glacier outflow (R1) showed a marked seasonal variation, with waters becoming progressively more depleted from premonsoon March (−11.18 per mil) and monsoon June (−10.05 per mil) to postmonsoon October (−16.86 per mil; Supplemental Table 1). October glacier outflow was the most depleted among all samples collected across all sampling periods.
The enriched glacier outflow signals for pre- and early monsoon time periods may indicate the relative influence of precipitation at these high elevations. A possible mechanism to account for these enriched samples is that rain from the previous season stored as groundwater is released during the dry season, when there are few new water inputs (Schmieder et al. Citation2016). The potential for precipitation falling as snow and consequently meltwater to be an important water source during relatively drier times of the year may account for the depleted signal in October. Snow samples are not available to confirm, but previous studies have more generally shown the importance of annual snowmelt to supply river flow to the basin (Armstrong et al. Citation2018). Generally, snowfall in Bhutan starts in August or September with peak accumulation in February, after which ablation starts (Gurung et al. Citation2011).
The overall isotope values in each season appear to be influenced by the recent rain’s isotope value. The wide spectrum of seasonal rain isotopic values (for example, June at −1.78 per mil compared to August at −13.72 per mil) is indicative of the variability of moisture source areas and fractionation cycles that precipitation experiences in this region. Additionally, a single monthly bulk sample provides only a mean value—not a spectrum—of rain isotopic values that may have been delivered as inputs to the basin. There is likely variation within the season’s precipitation isotope profile, as well as among seasons, but that variation is not captured in this study.
Isotopes relative to the meteoric water lines
The relative changes of δ2 H and δ18O were evaluated relative to the GMWL (EquationEquation 2(2)
(2) ) and regression line of summer rainfall (RWL) samples (). Regression statistics are summarized in . The RWL was derived from three bulk precipitation samples from June, August, and October. As noted above, there is likely precipitation isotope variation both inter- and intraseasonally, so this RWL is provided only as a reference.
Table 2. Summary statistics for isotopic relationships of seasonal river waters relative to the GMWL (slope = 8, intercept = 10) and RWL as shown in
Figure 4. The isotopic relationship of seasonal river water and end-member samples relative to the GMWL. The RWL shown is derived from three bulk precipitation samples. The highly enriched June rain sample plots off the page (inset)
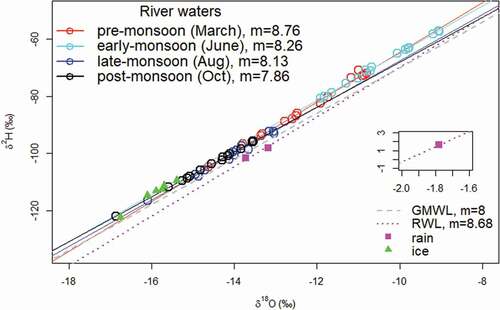
River waters generally fit the GMWL, indicating no major free evaporation processes and little loss of frozen water sources to sublimation. The slopes of the best-fit lines in the equations for premonsoon and monsoon periods were slightly higher than GMWL, suggesting a likely contribution from snow or glacier meltwater and groundwater (Dalai, Bhattacharya, and Krishnaswami Citation2002). October river waters have a slightly lower slope than the GMWL, whereas all other seasons have higher slopes, suggesting more sub-cloud evaporation of rainfall and surface evaporation processes (Ren, Yao, and Xie Citation2016) in the postmonsoon season compared to other times of the year.
The magnitude of the deuterium excess, d, is controlled by meteorological conditions of the vapor source such as relative humidity, temperature, and wind speed over the evaporating surface and water vapor recycling in the area of precipitation (Rozanski, Araguás‐Araguás, and Gonfiantini Citation1993; Dalai, Bhattacharya, and Krishnaswami Citation2002). The mean d value for each season can be considered as the y-intercept of the linear regression lines in (Supplemental Table 1; EquationEquation 3)(3)
(3) . The d values in rain varied from 15.88, 10.07, 8.24, and 7.43 per mil in June, July, August, and October, respectively. Moisture recycling appears to decrease as the monsoon progresses, as demonstrated by rain’s falling d values over this period.
Solute composition of river water
SO42− and Ca2+ () are known tracers that indicate extent of water–rock/soil interaction, and these results are presented here with all other major ion data available in Supplemental Table 2. March river water samples (premonsoon, coinciding with low streamflow; ) exhibit the highest concentrations across elevations, and August samples (late monsoon, hydrograph’s rising limb; ) have the lowest concentrations. Differences in SO42− and Ca2+ concentrations in premonsoon and late-monsoon river water samples suggest changing flow paths, discussed further below. In addition, the larger volume of water in the system during the high-flow period likely aids in diluting chemical concentrations.
Figure 5. The evolution of solute concentrations in river water across the elevation gradient. Solutes shown are SO42− (top) and Ca2+ (bottom)
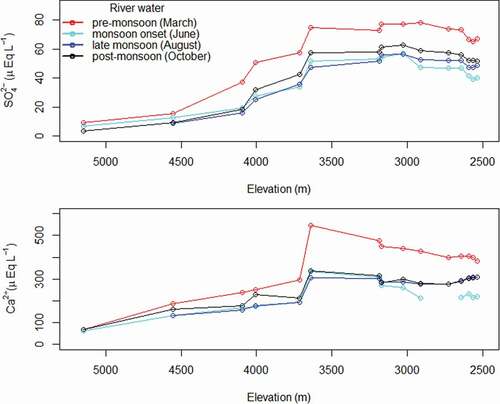
There is an increasing trend in SO42− and Ca2+ content in river water with decreasing elevation, which is consistent with our general understanding of increasing groundwater input (and lessening meltwater input) with greater distance from the glacier snout, as has also been observed in other glacierized catchments (Penna et al. Citation2017). At the two highest elevation sites (R1 and R2), there is little seasonal variation. Glacier outflow (R1) shows little variation in Ca2+ across seasons (61.42–69.03 µEqL−1), with a slightly larger relative range at R1 in SO42− (3.54–9.33 µEqL−1). The differences between seasons increases as you move downstream, with a Ca2+ seasonal range at 3,713 m of 102.0 and 23.8 µEqL−1 for SO42−. The monsoon season samples (June and August) track closely to each other across elevations and are the least concentrated samples at each elevation, suggesting that much of the new inputs from monsoon rain may bypass subsurface flow paths and transit to the river channel overland.
There is a notable step across all seasons between 3,641 and 3,713 m, where concentrations increase considerably (). This step is greater for Ca2+ than SO42− and is especially pronounced for March, where the maximum river concentration of Ca2+ is 547.22 µEqL−1 is reached. The step change is reflective of the major chemistry influence of the Tsampa tributary inflow between these sample points (). This is because Tsampa tributary drains outflow from the debris-covered Burtsham glacier (). Wilson et al. (Citation2016) demonstrated that geochemical concentrations for the debris-covered glacier outflow were consistently higher than the debris-free glacier outflow.
Unlike surface water, the SO42− concentrations in groundwater samples showed little seasonal variability, with slightly higher values in premonsoon and lower values in monsoon and postmonsoon seasons (Supplemental Table 2, ). Throughout the sampling period, the SP1 spring site has consistently lower SO42− concentrations (18.18 to 44.62 µEqL−1) compared to the SP3 spring site (80.32 to 86.97 µEqL−1), indicating a shorter, quick flushing flow path. Conversely, the more concentrated SP3 suggests that waters have either (or both) a longer flow path or a longer residence time (Frisbee et al. Citation2011; Williams et al. Citation2016; Cowie et al. Citation2017).
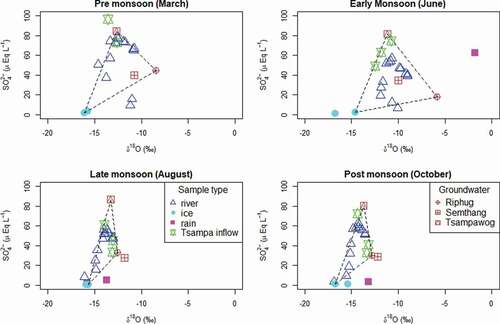
Figure 6. The δ18O–SO42− biplots with river, ice, and groundwater end-members for the months of March, June, August, and October. The Tsampa tributary inflow is also shown for reference. Dashed lines represent mixing lines and mixing triangles connecting likely river water end-members
End-member chemistry and isotopes and their relation to river water
δ18O–SO42− biplots () assist in understanding the relational values of isotopes and chemistry of end-members to each other and the river water. This visualization allows for a qualitative assessment of potential end-members to the river water samples by creating “mixing lines” or “mixing triangles,” as shown in as black dashes. River samples (blue triangles, ) falling on a mixing line suggest that it is primarily made up of the two end-members at the endpoints of the line. River samples lying within a mixing triangle suggest that they are predominantly composed of some combination of the end-members at the triangle vertices. There are almost certainly other smaller inputs from end-members not captured by the triangle, and this analysis varies somewhat depending on the tracers used.
Across all seasons, the mixing triangles are consistently well fit to capture most river samples using ice melt, Riphug spring (less-reacted groundwater), and Tsampawog spring (highly reacted groundwater) as end-members. Also shown in are the Tsampa tributary inflow samples (green stars). Though not considered an end-member per se, this plot assists in understanding the impact that the Tsampa tributary has on increasing concentrations in the downstream river samples.
The δ18O–SO42− plots () show that August and October river water can be reasonably approximated by a mixing line between ice melt and highly reacted groundwater. In contrast, March and June river samples show more spread along the x-axis, implying that less-reacted groundwater plays a more important role in these months.
Groundwater SO42− concentrations have a consistent range between springs. Due to the high chemistry concentrations in Tsampawog spring, we define it as “reacted groundwater.” This implies a longer residence time or more tortuous flow path, allowing it to accrue a larger amount of ions in the water (Williams et al. Citation2016). Riphug and Semthang springs cluster together in both δ18O and SO42− values in all but the early monsoon (June) season. We classify these springs as less-reacted groundwater, with Riphug being the least concentrated in June, suggesting that this is indicative of interflow.
Groundwater samples showed isotopic seasonal variability (, Supplemental Table 1) across the three sampling sites. Among the three groundwater spring sites, the Tsampawog spring showed the most depleted δ18O signal across all sampling seasons (−11.18 per mil in June to −13.71 per mil in October), wheras Riphug spring had the most enriched, particularly in March (−8.46 per mil) and June (−5.84 per mil). Riphug spring showed a large shift in isotope values over time (−6.68 per mil change between June and August), supporting our understanding of it as a shallow groundwater source that responds quickly to new inputs.
The Thana glacier ice collected near the terminus of Thana glacier sites showed consistently similar isotopic values across all sampling seasons. The range of δ18O of glacier ice samples was 1.37 per mil, with a mean value of −15.93 per mil. Of all samples collected, the lowest solute concentrations were measured in glacier ice. Glacier ice SO42− concentrations range from 0.7 µEqL−1 in August to 2.1 µEqL−1 in June. Rain shows wide seasonal variation in both δ18O and SO42−. Rain SO42− concentrations were 62.7, 5.2, and 3.3 µEqL−1 in June, August, and October, respectively. June rain SO42− concentration was unusually higher compared to late monsoon and postmonsoon rain samples. This may be attributable to sulfate aerosols, which are known to show maximum buildup in premonsoon and monsoon seasons (Gautam et al. Citation2009). At the onset of the monsoon season, rainfall virtually removes aerosols from the atmosphere, leading to low loading conditions in the subsequent rainfall (Gautam et al. Citation2009; Sajani et al. Citation2012; Pandey et al. Citation2017).
Hydrograph separation
Flow path model
The role of groundwater as a river source was investigated using SO42− as a tracer in a two-component mixing model over the elevation transect and for each season (). End-members used for this model were ice meltwater representing an “unreacted” overland flow source and Tsampawog spring, classified as “reacted” subsurface water.
Figure 7. Hydrograph separation utilizing the SO42− tracer to identify flow path composition of river water over the elevation gradient. Variations in flow paths are shown seasonally: premonsoon (top left), early monsoon (top right), late monsoon (bottom left), and postmonsoon (bottom right). The error bars (red) represent the uncertainty (95 percent confidence) for each component
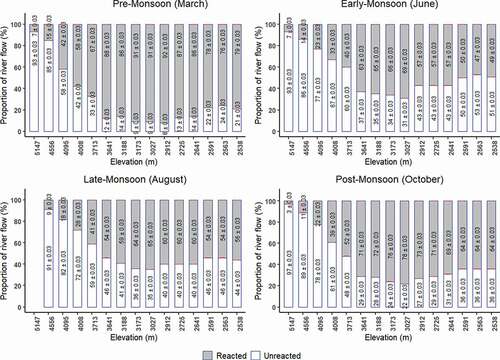
The average unreacted fractions of streamflow in March, June, August, and October were 30 ± 0.03, 54 ± 0.03, 51 ± 0.03, and 45 ± 0.03 percent, respectively. There is a similar trend across all seasons: the higher elevations upstream of 4,100 m are dominated by unreacted water (between 93 and 97 percent at the glacier outflow, R1), followed by reacted water sourcing the majority of river flow below this point. This agrees with our expectation that groundwater increases in importance with greater distance from the cryospheric water sources in the glacierized headwaters. In addition to decreasing meltwater contributions, the increasing catchment size is a proxy for increasing storage and longer flow paths in the bedrock (Muir, Hayashi, and McClymont Citation2011; Engel et al. Citation2019). However, there is a small reversal in this trend below approximately 3,000 m where unreacted water increases its proportion of river flow once again. This may be due to a melt-fed tributary flowing into at Riphug downstream (R8; ).
Seasonally there is an increase in overall groundwater contribution in the premonsoon (March) and postmonsoon (October) periods. The average groundwater fractions of streamflow in March, June, August, and October were 70 ± 0.03, 46 ± 0.03, 49 ± 0.03, and 55 ± 0.03 percent, respectively. Groundwater’s highest contribution, 92 ± 0.03 percent, occurs at 2,912 m in March, likely coinciding with time and location where few new water inputs are received. In contrast, we can expect more unreacted water at mid-elevations during monsoon season (June, August) when precipitation events are contributing to the melt of snow and ice, as well as providing overland flow from high-intensity rainfall.
Source water model
Sources of river water were parsed out using δ18O as a tracer across the elevational transect by two-component hydrograph separation model. Results are limited to June and October (). Models for other months are not included because there was no rain in March, and the August rain sample resulted in an unconstrained model. When δ18O values of river water fall outside of the δ18O values of end-members, a mixing model assumption is violated, namely, that river flow is made up of only two end-members (Suecker et al. Citation2000). We believe that due to the input of isotopically enriched groundwater, river water δ18O values were more enriched than the rain δ18O value. This suggests that during the monsoon months, the Chamkhar Chhu receives contributions from groundwater besides meltwater and rainfall. In August, river samples mostly plot along the mixing line () between ice meltwater and Tsampawog spring, suggesting groundwater as one of the likely end-members.
Figure 8. Hydrograph separation utilizing the δ18O tracer to identify source water composition of river water over the elevation gradient. Variations in flow paths are shown for early monsoon (left) and postmonsoon (right). The error bars (red) represent the uncertainty (95 percent confidence) for each component
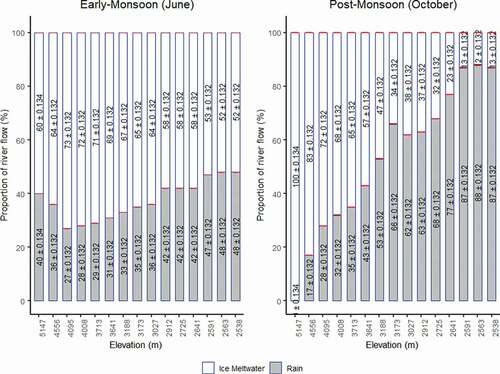
June shows a consistent rain–ice meltwater split across all elevations, with a mean rain contribution of 38 ± 0.13 percent (range of 27 ± 0.13 to 48 ± 0.13 percent; , left). October (, right), in contrast, shows a consistent decrease in ice meltwater contributions with decreasing elevation, from 100 ± 0.13 percent at the glacier snout to 12 ± 0.13 percent at the downstream extent of the domain (2,538 m). We note that because snow was not explicitly sampled, the proportion of river flow attributed to ice meltwater likely also represents snow sources.
Though we typically expect to transition away from melt-dominated inputs with distance from the alpine, much like the postmonsoon separation (, right), the early monsoon result (, left) suggests otherwise. As shown in , the role of groundwater at mid to low elevations is important in river flow, leading to a secondary question of what original source water supplies the groundwater. A possible mechanism in the early monsoon source water result is that groundwater supplying river flow is melt recharged, bearing both a reacted hydrochemical signature and a depleted isotopic one.
Conceptual models
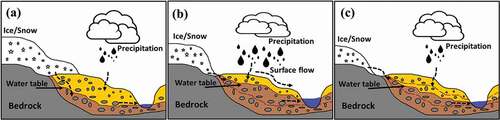
Utilizing the results presented above, we suggest that across elevations the movement of water input to streamflow can be characterized seasonally (). In the premonsoon period (), with few new meteoric inputs, the majority of streamflow is routed through the subsurface and presents as the Chamkhar Chhu baseflow. The source of groundwater is likely a combination of both rain and meltwater. During the monsoon season (), the system transitions to a combination of rainfall–runoff and groundwater-fed river flow. Groundwater is likely predominantly recharged by rain throughout the monsoon season, increasing the water table height. River flow in the postmonsoon period () benefits from the newly rain-recharged groundwater aquifers and is made up mostly of residual rain events and rain-sourced groundwater. Inherent in all of these concepts is the inevitable mixing of rain and meltwaters that occurs both in groundwater storage and in the river itself. A similar conceptual model of the seasonal evolution of streamflow components was presented by Penna et al. (Citation2017) in the glacierized basin of the Suldur River.
Figure 9. Conceptual diagram indicating flow paths during (a) premonsoon, (b) monsoon, and (c) postmonsoon periods in the Chamkhar Chhu basin across elevations
Conclusions
The hydrologic processes that control river flow in the Chamkhar Chhu are important to understand in the context of water supply vulnerability to downstream populations in a changing climate. With its glacial headwater basins, the Chamkhar Chhu has the potential to be highly sensitive to a warming world that may have effects on river flow at lower elevations in the places where people, agriculture, and hydropower utilize the water.
Here we suggest that monsoon rain plays the dominant role in sourcing river flow below 3,500 m during monsoon (contributing 31–48 percent) and postmonsoon (contributing 43–88 percent) periods (July–November). Even during the drier periods such as the premonsoon season (March), much of the river flow may indirectly be precipitation sourced, with dry season baseflow likely a mixture of snow and rain stored as groundwater, in addition to smaller amounts of melting glacier ice. However, the temporal and spatial variability of precipitation patterns due to rising temperature associated with climate may change the current state of the hydrologic system, which may have profound effects on the water resources in the region. Summer monsoon precipitation is expected to be 20 to 40 percent higher in 2071 to 2098 than it was in the baseline period (1961–1990) in the Hindu Kush Himalaya region due to significant warming that will occur toward the twenty-first century (Kulkarni et al. Citation2013).
This study demonstrates the increasingly important role of groundwater in the Chamkhar Chhu basin with decreasing elevation. Groundwater itself bears many unknowns, including uncertainty regarding residence time and thus the lag between recharge and streamflow. The residence time of groundwater aquifers has traditionally been viewed as the “buffer” to climate-induced hydrologic changes within a system (Taylor et al. Citation2013). For example, groundwater can compensate for reductions in melt inputs over the residence timescale. The groundwater dynamics of this basin is an area of future research and will further clarify potential water supply changes, especially outside of the monsoon period.
Snowmelt has been shown to be the major water input in the Brahmaputra hydroclimate (Armstrong et al. Citation2018). This study lacks specific snow samples and is an area for future focus in the basin. Changes to the meltwater supplies such as glacial reservoirs and snow packs in the basin may still be an important contributor to streamflow across elevations, especially in the early monsoon season (June). As the world continues to warm, changes in the timing and rate of melt of these frozen resources may impact the hydrologic regime of the Brahmaputra headwaters and the water supplies to agriculture and municipalities downstream.
Supplemental Material
Download Zip (31.9 KB)Acknowledgments
The authors are grateful to the National Center for Hydrology and Metrology of Bhutan for providing the hydrometeorological data for the Chamkhar basin. Many thanks to Sherubtse College for administrative support and for providing field staff during sample collection.
Disclosure statement
The authors declare no potential conflict of interest.
Supplementary material
Supplemental data for this article can be accessed on the publisher’s website.
Additional information
Funding
Related Research Data
References
- Armstrong, R. L., K. Rittger, M. J. Brodzik, A. Racoviteanu, A. P. Barrett, S.-J. S. Khalsa, and A. M. Wilson. 2018. Runoff from glacier ice and seasonal snow in High Asia: Separating melt water sources in river flow. Regional Environmental Change 19 (5):1249–1261. doi:https://doi.org/10.1007/s10113-018-1429-0.
- Beaulieu, M., H. Schreier, and G. Jost. 2012. A shifting hydrological regime: A field investigation of snowmelt runoff processes and their connection to summer base flow, Sunshine Coast, British Columbia. Hydrological Processes 26 (17):2672–82. doi:https://doi.org/10.1002/hyp.v26.17.
- Beldring, S., and A. Voksø. 2011. Report No. 4—2011: Climate change impacts on the flow regimes of rivers in Bhutan and possible consequences for hydropower development, Norwegian Water Resources and Energy Directorate, Oslo, Norway. ISSN, 1502–3540.
- Carey, S., and W. Quinton. 2005. Evaluating runoff generation during summer using hydrometric, stable isotope and hydrochemical methods in a discontinuous permafrost alpine catchment. Hydrological Processes: An International Journal 19 (1):95–114. doi:https://doi.org/10.1002/()1099-1085.
- Chhopel, G. K. 2014. Sustainability of Bhutan’s hydropower. Hydro Nepal: Journal of Water, Energy and Environment 14:73–76. doi:https://doi.org/10.3126/hn.v14i0.11272.
- Cowie, R. M., J. F. Knowles, K. R. Dailey, M. W. Williams, T. J. Mills, and N. P. Molotch. 2017. Sources of streamflow along a headwater catchment elevational gradient. Journal of Hydrology 549:163–78. doi:https://doi.org/10.1016/j.jhydrol.2017.03.044.
- Craig, H. 1961. Isotopic variations in meteoric waters. Science 133 (3465):1702–03. doi:https://doi.org/10.1126/science.133.3465.1702.
- Dalai, T. K., S. Bhattacharya, and S. Krishnaswami. 2002. Stable isotopes in the source waters of the Yamuna and its tributaries: Seasonal and altitudinal variations and relation to major cations. Hydrological Processes 16 (17):3345–64. doi:https://doi.org/10.1002/()1099-1085.
- Dansgaard, W. 1964. Stable isotopes in precipitation. Tellus 16 (4):436–68. doi:https://doi.org/10.3402/tellusa.v16i4.8993.
- Drever, J. I. 1988. The geochemistry of natural water. Englewood Cliffs, NJ: Pearson Education.
- Engel, M., D. Penna, G. Bertoldi, G. Vignoli, W. Tirler, and F. Comiti. 2019. Controls on spatial and temporal variability in streamflow and hydrochemistry in a glacierized catchment. Hydrology and Earth System Sciences 23 (4):2041–63. doi:https://doi.org/10.5194/hess-23-2041-2019.
- Forest Resources Management Division. 2017. Land use and land cover of Bhutan 2016, maps and statistics. http://www.dofps.gov.bt/wp-content/uploads/2018/07/LULC2016_Maps-and-Statistics.pdf.
- Frisbee, M. D., F. M. Phillips, A. R. Campbell, F. Liu, and S. A. Sanchez. 2011. Streamflow generation in a large, alpine watershed in the southern Rocky Mountains of Colorado: Is streamflow generation simply the aggregation of hillslope runoff responses? Water Resources Research 47 (6). doi: https://doi.org/10.1029/2010wr009391.
- Gautam, R., N. C. Hsu, K. M. Lau, and M. Kafatos. 2009. Aerosol and rainfall variability over the Indian monsoon region: Distributions, trends and coupling. Annals of Geophysics 27 (9):3691–703. doi:https://doi.org/10.5194/angeo-27-3691-2009.
- Genereux, D. 1998. Quantifying uncertainty in tracer-based hydrograph separations. Water Resources Research 34 (4):915–19. doi:https://doi.org/10.1029/98wr00010.
- Gurung, D. R., A. V. Kulkarni, A. Giriraj, K. S. Aung, and B. Shrestha. 2011. Monitoring of seasonal snow cover in Bhutan using remote sensing technique. Current Science (Bangalore) 101 (10):1364–70.
- Gurung, D. R., S. B. Maharjan, A. B. Shrestha, M. S. Shrestha, S. R. Bajracharya, and M. S. R. Murthy. 2017. Climate and topographic controls on snow cover dynamics in the Hindu Kush Himalaya. International Journal of Climatology 37 (10):3873–82. doi:https://doi.org/10.1002/joc.4961.
- Hooper, R. P., and C. A. Shoemaker. 1986. A comparison of chemical and isotopic hydrograph separation. Water Resources Research 22 (10):1444–54. doi:https://doi.org/10.1029/WR022i010p01444.
- Immerzeel, W. W., L. P. van Beek, and M. F. Bierkens. 2010. Climate change will affect the Asian water towers. Science 328 (5984):1382–85. doi:https://doi.org/10.1126/science.1183188.
- Iwata, S. 2010. Glaciers of Bhutan. An overview. Washington, DC: US Geological Survey Professional Paper.
- Katwal, T. 2013. Multiple cropping in Bhutanese agriculture: Present status and opportunities. Paper presented at the Regional consultative meeting on popularizing multiple cropping innovations as a means to raise productivity and farm income in SAARC countries, Peradeniya, Kandy, Sri Lanka. Kandy Google Scholar.
- Kulkarni, A., S. Patwardhan, K. K. Kumar, K. Ashok, and R. Krishnan. 2013. Projected climate change in the Hindu Kush-Himalayan region by using the high-resolution regional climate model PRECIS. Mountain Research and Development 33 (2):142–51. doi:https://doi.org/10.1659/MRD-JOURNAL-D-11-00131.1.
- Laudon, H., H. F. Hemond, R. Krouse, and K. H. Bishop. 2002. Oxygen 18 fractionation during snowmelt: Implications for spring flood hydrograph separation. Water Resources Research 38 (11):40–10. doi:https://doi.org/10.1029/2002WR001510.
- Li, H., S. Beldring, C.-Y. Xu, M. Huss, K. Melvold, and S. K. Jain. 2015. Integrating a glacier retreat model into a hydrological model – Case studies of three glacierised catchments in Norway and Himalayan region. Journal of Hydrology 527:656–67. doi:https://doi.org/10.1016/j.jhydrol.2015.05.017.
- Liu, F., M. W. Williams, and N. Caine. 2004. Source waters and flow paths in an alpine catchment, Colorado Front Range, United States. Water Resources Research 40 (9). doi:https://doi.org/10.1029/2004WR003076.
- Lucarini, V., and S. Pascale. 2012. Hydrological cycle over South and Southeast Asian river basins as simulated by PCMDI/CMIP3 experiments. arXiv preprint arXiv:1301.0020.
- Masood, M., P. J. Yeh, N. Hanasaki, and K. Takeuchi. 2015. Model study of the impacts of future climate change on the hydrology of Ganges-Brahmaputra-Meghna basin. Hydrology and Earth System Sciences 19 (2):747. doi:https://doi.org/10.5194/hess-19-747-2015.
- Mool, P. K., D. Wangda, S. R. Bajracharya, K. Kunzang, D. Gurung, and S. Joshi. 2001. Inventory of glaciers, glacial lakes and glacial lake outburst floods. Monitoring and early warning systems in the Hindu Kush-Himalayan Region: Bhutan. Kathmandu, Nepal: International Centre for Integrated Mountain Development.
- Muir, D. L., M. Hayashi, and A. F. McClymont. 2011. Hydrological storage and transmission characteristics of an alpine talus. Hydrological Processes 25 (19):2954–66. doi:https://doi.org/10.1002/hyp.8060.
- Naito, N., R. Suzuki, J. Komori, Y. Matsuda, S. Yamaguchi, T. Sawagaki, and K. S. Ghalley. 2012. Recent glacier shrinkages in the Lunana region, Bhutan Himalayas. Global Environmental Research 16 (1):13–22.
- Nepal, S., W.-A. Flügel, and A. B. Shrestha. 2014. Upstream-downstream linkages of hydrological processes in the Himalayan region. Ecological Processes 3 (1):19. doi:https://doi.org/10.1186/s13717-014-0019-4.
- Nepal, S., and A. B. Shrestha. 2015. Impact of climate change on the hydrological regime of the Indus, Ganges and Brahmaputra river basins: A review of the literature. International Journal of Water Resources Development 31 (2):201–18. doi:https://doi.org/10.1080/07900627.2015.1030494.
- Pandey, S. K., V. Vinoj, K. Landu, and S. S. Babu. 2017. Declining pre-monsoon dust loading over South Asia: Signature of a changing regional climate. Scientific Reports 7 (1):16062. doi:https://doi.org/10.1038/s41598-017-16338-w.
- Penna, D., M. Engel, G. Bertoldi, and F. Comiti. 2017. Towards a tracer-based conceptualization of meltwater dynamics and streamflow response in a glacierized catchment. Hydrology and Earth System Sciences 21 (1):23–41. doi:https://doi.org/10.5194/hess-21-23-2017.
- Pervez, M. S., and G. M. Henebry. 2015. Assessing the impacts of climate and land use and land cover change on the freshwater availability in the Brahmaputra River basin. Journal of Hydrology: Regional Studies 3:285–311.
- Racoviteanu, A. E., R. Armstrong, and M. W. Williams. 2013. Evaluation of an ice ablation model to estimate the contribution of melting glacier ice to annual discharge in the Nepal Himalaya. Water Resources Research 49 (9):5117–33. doi:https://doi.org/10.1002/wrcr.20370.
- Ren, W., T. Yao, and S. Xie. 2016. Water stable isotopes in the Yarlungzangbo headwater region and its vicinity of the southwestern Tibetan Plateau. Tellus B: Chemical and Physical Meteorology 68 (1):30397. doi:https://doi.org/10.3402/tellusb.v68.30397.
- Rozanski, K., L. Araguás‐Araguás, and R. Gonfiantini. 1993. Isotopic patterns in modern global precipitation. In Climate Change in Continental Isotopic Records, eds P. K. Swart, K. C. Lohmann, J. Mckenzie and S. Savin, 1–36. Washington, DC: American Geophysical Union.
- Rupper, S., J. M. Schaefer, L. K. Burgener, L. S. Koenig, K. Tsering, and E. R. Cook. 2012. Sensitivity and response of Bhutanese glaciers to atmospheric warming. Geophysical Research Letters 39 (19). doi: https://doi.org/10.1029/2012gl053010.
- Sajani, S., K. Krishna Moorthy, K. Rajendran, and R. S. Nanjundiah. 2012. Monsoon sensitivity to aerosol direct radiative forcing in the community atmosphere model. Journal of Earth System Science 121 (4):867–89. doi:https://doi.org/10.1007/s12040-012-0198-2.
- Savada, A. M. 1991. Bhutan: A country study river systems. Washington: GPO for the Library of Congress.
- Schmieder, J., F. Hanzer, T. Marke, J. Garvelmann, M. Warscher, H. Kunstmann, and U. Strasser. 2016. The importance of snowmelt spatiotemporal variability for isotope-based hydrograph separation in a high-elevation catchment. Hydrology and Earth System Sciences 20 (12):5015–33. doi:https://doi.org/10.5194/hess-20-5015-2016.
- Singh, V. P., N. Sharma, and C. S. P. Ojha. 2013. The Brahmaputra basin water resources, Vol. 47. Dordrecht, The Netherlands: Springer Science & Business Media.
- Sklash, M., R. Farvolden, and P. Fritz. 1976. A conceptual model of watershed response to rainfall, developed through the use of oxygen-18 as a natural tracer. Canadian Journal of Earth Sciences 13 (2):271–83. doi:https://doi.org/10.1139/e76-029.
- Suecker, J. K., J. N. Ryan, C. Kendall, and R. D. Jarrett. 2000. Determination of hydrologic pathways during snowmelt for alpine/subalpine basins, Rocky Mountain National Park, Colorado. Water Resources Research 36 (1):63–75. doi:https://doi.org/10.1029/1999WR900296.
- Taylor, R. G., B. Scanlon, P. Döll, M. Rodell, R. van Beek, Y. Wada, L. Longuevergne, M. Leblanc, J. S. Famiglietti, and M. Edmunds. 2013. Ground water and climate change. Nature Climate Change 3 (4):322. doi:https://doi.org/10.1038/nclimate1744.
- Tshering, S., and B. Tamang. 2004. Hydropower-key to sustainable, socio-economic development of Bhutan. Paper presented at the United Nations Symposium on Hydropower and Sustainable Development, Beijing, China.
- Williams, M. W., C. Seibold, and K. Chowanski. 2009. Storage and release of solutes from a subalpine seasonal snowpack: Soil and stream water response, Niwot Ridge, Colorado. Biogeochemistry 95 (1):77–94. doi:https://doi.org/10.1007/s10533-009-9288-x.
- Williams, M. W., A. Wilson, D. Tshering, P. Thapa, and R. B. Kayastha. 2016. Using geochemical and isotopic chemistry to evaluate glacier melt contributions to the Chamkar Chhu (river), Bhutan. Annals of Glaciology 57 (71):339–48. doi:https://doi.org/10.3189/2016AoG71A068.
- Wilson, A. M. 2015. Hydrograph separation using hydrochemistry mixing models: An assessment of the Langtang River Basin, Nepal. (Geography Graduate Theses & Dissertations), University of Colorado at Boulder. https://scholar.colorado.edu/geog_gradetds/76.
- Wilson, A. M., M. W. Williams, R. B. Kayastha, and A. Racoviteanu. 2016. Use of a hydrologic mixing model to examine the roles of meltwater, precipitation and groundwater in the Langtang River basin, Nepal. Annals of Glaciology 57 (71):155–68. doi:https://doi.org/10.3189/2016AoG71A067.
- Xu, J., R. E. Grumbine, A. Shrestha, M. Eriksson, X. Yang, Y. Wang, and A. Wilkes. 2009. The melting Himalayas: Cascading effects of climate change on water, biodiversity, and livelihoods. Conservation Biology 23 (3):520–30. doi:https://doi.org/10.1111/cbi.2009.23.issue-3.