
 ?Mathematical formulae have been encoded as MathML and are displayed in this HTML version using MathJax in order to improve their display. Uncheck the box to turn MathJax off. This feature requires Javascript. Click on a formula to zoom.
ABSTRACT
Links between climate and glacier surges are poorly understood but are required to enable prediction of surges and mitigation of associated hazards. Here, we investigate the role of snow accumulation, rain, and temperature on surge periodicity, area changes, and timing of surge initiation since the 1930s at Donjek Glacier, Yukon, Canada. Snow accumulation measured in three ice cores collected at Eclipse Icefield indicates that a cumulative accumulation of 15.5 ± 1.46 or 16.6 ± 2.0 m w.e. occurred in the ten to twelve years between each of its last eight surges, depending on ice motion spatiotemporal offset corrections. Although we find consistent snow accumulation between surges, the transient snow line has risen 10.3 m decade−1 vertically since the 1950s, and Burwash Landing weather station records indicate a 0.5°C decade−1 increase in mean annual air temperature since the 1960s. Changes in surface mass balance are accompanied by a consistent surge interval but decreasing surge extent. The three recent surge events initiated in years with the rainiest summers on record. These findings highlight a complex interplay between external (i.e., climate) and internal glacier processes that control surging at Donjek Glacier, with climate having a more direct influence on surge extent than on recurrence interval.
Introduction
Surge-type glaciers account for approximately 1 percent of glaciers globally (Jiskoot, Boyle, and Murray Citation1998; Sevestre and Benn Citation2015) but can be the dominant glacier type in some regions (e.g., Clarke et al. Citation1986; Jiskoot, Luckman, and Murray Citation2003) and are useful for understanding ice flow instabilities and anomalous glacier response to climate change (Yde and Paasche Citation2010). Surge-type glaciers have long periods of flow at rates below their balance velocity. This quiescent phase is typically on the order of decades, during which mass accumulates over a portion of the glacier, referred to as the reservoir zone. These long periods of slow flow are interrupted by short-lived phases of glacier flow at rates much higher than the balance velocity. This active phase, or surge phase, is typically on the order of months to years and is driven by internal instabilities (Meier and Post Citation1969; Clarke Citation1987). When a glacier surges, mass is rapidly transferred from its higher elevation reservoir zone to its receiving zone, with the line of zero net mass change defined as the dynamic balance line (Dolgoushin and Osipova Citation1975). When mass gain in the receiving zone leads to a significant advance of the terminus, an increased calving flux or other proglacial hazards, such as flooding, can occur (Harrison et al. Citation2015).
Surges of temperate glaciers are typically hypothesized to initiate when a critical basal shear stress is reached in a surge initiation region, where, in conjunction with a reduction in friction at the bed or margins, the glacier rapidly increases in flow speed, redistributing its accumulated mass down-glacier (Meier and Post Citation1969; Raymond Citation1987; Eisen et al. Citation2005; Thøgersen et al. Citation2019). Reduced friction is commonly attributed to a thermal or hydrologic switch mechanism, a combination thereof, or bed or shear margin failure (see discussions in Harrison and Post Citation2003; Murray et al. Citation2003; Cuffey and Paterson Citation2010; Dunse et al. Citation2015; Thøgersen et al. Citation2019). Though a rapid surge initiation and termination and a short surge period dominate Yukon–Alaska type surging, a prolonged initiation/termination and longer surge phase have been documented in surges of polar and polythermal glaciers, such as those in Svalbard and smaller glaciers in East Greenland and Yukon–Alaska (Kamb et al. Citation1985; Murray et al. Citation2003; Frappé and Clarke Citation2007; De Paoli and Flowers Citation2009; Jiskoot and Juhlin Citation2009; Dunse et al. Citation2015). Although these two end-members of surge behavior have traditionally been classified as the Alaskan type (hydrological trigger) and Svalbard type (thermal trigger; Murray et al. Citation2003), the range of behaviors is more complex, and combined thermohydrological triggers (e.g., Dunse et al. Citation2015; Sevestre et al. Citation2018) and till failure (Truffer, Harrison, and Echelmeyer Citation2000) have become evident from field investigations and modeling. Finally, overarching theories related to balance flux (Budd Citation1975) and enthalpy (Sevestre and Benn Citation2015; Benn et al. Citation2019) have been proposed as well.
The length of a surge cycle (i.e., combined quiescent and active phases) is typically consistent for an individual glacier and is generally proportional to the length of the surge phase (Meier and Post Citation1969; Dowdeswell, Hamilton, and Hagen Citation1991), although notable exceptions occur in Icelandic surges. In turn, quiescence duration is controlled by mass balance conditions (Robin and Weertman Citation1973), meaning that surge periodicity is typically inversely related to accumulation rates (Dyurgerov, Aizin, and Buynitskiy Citation1985; Dowdeswell, Hamilton, and Hagen Citation1991; Osipova and Tsvetkov Citation1991). Prolonged quiescent phases (decades to centuries) typical of the Svalbard region have been ascribed to low accumulation rates, often only on the order of 0.3 to 0.6 m a−1 water equivalent (w.e.; Dowdeswell et al. Citation1995), whereas short repeat intervals (12–20 years), such as those on Variegated Glacier, Alaska, correspond to accumulation rates on the order of 1.4 m a−1 w.e. (Eisen, Harrison, and Raymond Citation2001; Van Geffen and Oerlemans Citation2017). However, there can be large variations in surge periodicity between glaciers in the same region. For example, the irregular quiescent intervals of Icelandic glaciers vary from 5–30 years for some glaciers and up to 100–140 years for others (Björnsson, Pálsson, and Sigurðsson Citation2003; Sigurdsson Citation2005).
Changes in surge recurrence interval and vigor have been linked to variations in cumulative mass balance (Dowdeswell et al. Citation1995; Eisen, Harrison, and Raymond Citation2001; Frappé and Clarke Citation2007; De Paoli and Flowers Citation2009; Copland et al. Citation2011; Flowers et al. Citation2011; Striberger et al. Citation2011). Dowdeswell et al. (Citation1995) found that persistent negative mass balance reduced glacier surge activity in Svalbard. Conversely, an increase in precipitation and positive glacier mass balance on Karakoram glaciers was associated with an elevated number of surge events, although it is unclear whether an increase in snow accumulation (Copland et al. Citation2011) or increase in intense short-term melting periods (Hewitt Citation2007) drove the increase in surging. Eisen, Harrison, and Raymond (Citation2001) reported a variable surge recurrence interval that was consistent with changing snow accumulation on Variegated Glacier, Alaska. Similarly, Striberger et al. (Citation2011) found a variable surge repeat interval at Eyjabakkajökull, Iceland, associated with changes in climatically driven mass balance, with the shortest quiescent phase length during the Little Ice Age.
This study attempts to answer the question of why the surge recurrence interval of approximately twelve years remains remarkably consistent at Donjek Glacier given current climate warming trends and uses a novel approach by incorporating ice core data. Previous efforts to examine connections between cumulative snow accumulation and length of the quiescent phase have used mass balance models, off-ice meteorological measurements, and a limited record of in situ mass balance measurements (Dyurgerov, Aizin, and Buynitskiy Citation1985; Eisen, Harrison, and Raymond Citation2001; Tangborn Citation2013). Here, we use the well-documented history of eight surge events at Donjek Glacier (Abe, Furuya, and Sakakibara Citation2016; Kochtitzky et al. Citation2019) and three ice cores extracted from Eclipse Icefield at the head of the glacier (Wake, Yalcin, and Gundestrup Citation2002; Yalcin et al. Citation2006; Kelsey et al. Citation2012) to explore linkages between snow accumulation and surging since the 1930s. We combine these observations with weather station records, climate reanalysis, digital elevation models, and remote sensing to examine the impacts of climate and ice kinematics on surge behavior.
Study site
Donjek Glacier (61°11ʹ N, 139°31ʹ W; ) is a surge-type glacier located in the St. Elias Mountains in southwestern Yukon, Canada, a region home to a high concentration of surge-type glaciers. Clarke et al. (Citation1986) identified 151 of 2,356 glaciers in the Yukon to be surge-type. In the broader St. Elias Mountains, Sevestre and Benn (Citation2015) identified 322 glaciers as surge-type, making the Alaska–Canada border region the third most populous in the world for surge-type glaciers, after Svalbard and the Pamirs.
Figure 1. (a) Donjek Glacier (dark blue outline; RGI Consortium Citation2017). The thick black line indicates the separation between the down-glacier surge-type and up-glacier non-surge-type portions of the glacier at 21 km from the terminus, and the thick green line indicates the dynamic balance line (DBL) at 8 km. (b) Location of Donjek Glacier in southwestern Yukon; red box indicates extent of the main image. Base image from Landsat 8, 23 September 2017
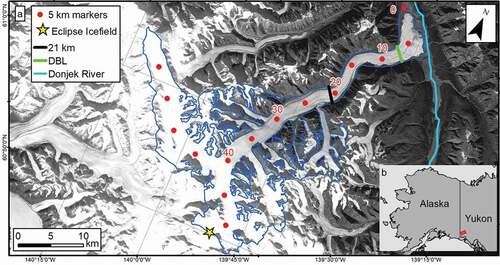
In 2010, Donjek Glacier was 65 km long with a surface area of 448 km2 (RGI Consortium Citation2017). The terminus of Donjek Glacier is located at approximately 1,000 m a.s.l., and the highest point within the glacier catchment is Mount Walsh at 4,507 m a.s.l. Eclipse Icefield, where the ice cores were drilled, is at approximately 3,020 m a.s.l. The Tlingit indigenous peoples of the Yukon were the first to observe Donjek Glacier surge (Cruikshank Citation1981), and the first scientific records are from 1937 in the form of Bradford Washburn’s aerial photographs (https://library.uaf.edu/washburn/). Subsequent scientific work at the glacier focused on the moraines and geomorphology (Denton and Stuiver Citation1966; Johnson Citation1972), meteorological measurements at Eclipse Icefield as part of the Icefield Ranges Research Project (Ragle Citation1973), and surge-related outburst floods in the Donjek River (; Clarke and Mathews Citation1981). The closest permanent weather station with a multi-decadal record including precipitation is at Burwash Landing, 32 km to the northeast of the terminus of Donjek Glacier. Based on averaging all mean daily temperatures from 1967 to 2017, Burwash Landing recorded an average annual temperature of −3.3°C (1,038 of 18,794 days did not report a mean daily temperature, which were not corrected for because they were randomly distributed).
Between May 2000 and May 2012, the area-averaged specific mass balance of Donjek Glacier was −0.29 m w.e. a−1 (Larsen et al. Citation2015). In comparison, the mass balance of glaciers in the St. Elias Mountains as a whole was −0.47 m w.e. a−1 between 1968 and 2006 (Berthier et al. Citation2010). Despite this negative mass balance, Donjek has continued its history of frequent surging, which has occurred approximately every ten to twelve years since the 1930s (Abe, Furuya, and Sakakibara Citation2016; Kochtitzky et al. Citation2019; ). Aerial photographs, satellite imagery, and previous reports indicate that the glacier surged in ~1935, ~1947, the late-1950s, ~1969, 1977–1980, 1988–1990, 2000–2002, and 2012–2014, with progressively less extensive terminus advances up to the present day (Abe, Furuya, and Sakakibara Citation2016; Kochtitzky et al. Citation2019). For example, between the end of the 1977–1980 and 2012–2014 surge events, the maximum glacier extent decreased by approximately 2 km2 (Abe, Furuya, and Sakakibara Citation2016), which is consistent with other glaciers in the region, including surge-type Lowell Glacier (Bevington and Copland Citation2014) and non-surge-type Kaskawulsh Glacier (Foy et al. Citation2011). Ice flow velocities are only available for the two most recent surges (Abe, Furuya, and Sakakibara Citation2016; Kochtitzky et al. Citation2019) and indicate that only the lower 21 km of the glacier was actively involved in these events. This coincides with the portion of the glacier down-glacier of a valley constriction and a dynamic balance line at approximately 8 km from the terminus (Kochtitzky et al. Citation2019; , green line). The last few surge events have caused lakes up to 2.2km2 to form at the terminus of Donjek Glacier, creating potential hazards for those downstream (Kochtitzky et al. Citation2020).
Figure 2. Surge event timing. Gray bars indicate uncertainty for surges before the satellite era. Black bars indicate duration of active surge phase for the last four surge events, well constrained by satellite imagery. For details, see Kochtitzky et al. (Citation2019)
Methods
Ice cores and snow accumulation record
Ice cores were collected at Eclipse Icefield () in 1996 (160 m absolute length; Yalcin and Wake Citation2001; Wake, Yalcin, and Gundestrup Citation2002; 350 m absolute length; Fisher et al. Citation2004; Kelsey et al. Citation2012) and 2016 (59 m absolute length; this study), to develop an understanding of past climate in the St. Elias Range (). Cores were collected during late spring, but preceding the melt season, in 1-m segments using an 8.2-cm-diameter electromechanical drill (an Eclipse drill [Blake, Wake, and Gerasimoff Citation1998] for the 1996 and 2002 cores and a Stampfli 3-in. drill system [Knüsel et al. Citation2005] in 2016).
Table 1. Ice core characteristics
The accumulation record from the 1996 ice core was originally reported by Yalcin and Wake (Citation2001), and we use their original data here. The 160-m core was continuously sampled in 10-cm segments using straight core processing techniques (Yalcin and Wake Citation2001). In 2002, two cores were extracted. Here we include data from the longer, 350-m-long core that was continuously sampled in 10- to 15-cm segments for stable isotopes and major ions. An original depth–age scale for the 2002 core was developed by Yalcin et al. (Citation2007; hereafter the ECL02_2007 timescale). Since then, advances in glaciochemical signal detection, automated layer counting (Winstrup et al. Citation2012), and ice flow modeling have been developed for alpine ice cores (Campbell et al. Citation2013; Winski et al. Citation2017). We applied these techniques to the existing Eclipse 2002 core data to develop our updated depth–age scale (hereafter the ECL02_2019 timescale) accumulation rate time series, as described below.
The 2002 core was dated via annual layer counting of δD, sodium, magnesium, calcium, and sulfate. The 2002 core was additionally constrained by known volcanic eruption markers indicated by a spike in sulfate concentrations (Yalcin et al. Citation2007) and the Cs-137 peak in 1963 from aboveground nuclear testing. The seasonal timing of each of these peaks is well characterized from previous studies in the North Pacific region (Yalcin and Wake Citation2001; Wake, Yalcin, and Gundestrup Citation2002; Yasunari et al. Citation2007; Osterberg et al. Citation2014; Winski et al. Citation2017).
To obtain an annually resolved timescale for the 2002 core (ECL02_2019 timescale), five individuals independently picked the approximate mid-winter position (approximately 1 January) based on the annual cyclicity of stable water isotopes, sodium and calcium. These methods allow us to reconstruct the depth–age relationship and annual layer thickness profile for the 2002 core for the last 500 years (). These individual annual pick positions were reconciled using the methods described in Winski et al. (Citation2017), which included incorporation of algorithm-based computer counting software (Winstrup et al. Citation2019). With the resulting annually dated timescale, annual layer thicknesses were calculated as the distance between successive years, and water equivalent annual layer thicknesses were calculated by multiplying the annual layer thickness by the density at the corresponding depth in the ice core. The density for each layer was extrapolated from 1-m-increment field density measurements.
Figure 3. Ice core accumulation and depth–age scale (ECL02_2019 timescale). (a) Mean picked observed depth–age scale from the 2002 ice core. Red box indicates the section of the ice core that was used to create . (b) The 1996, 2002, and 2016 ice core accumulation records since 1770. The Nye and Hooke models provide the bounds on the uncertainty (gray) for accumulation from the 2002 ice core
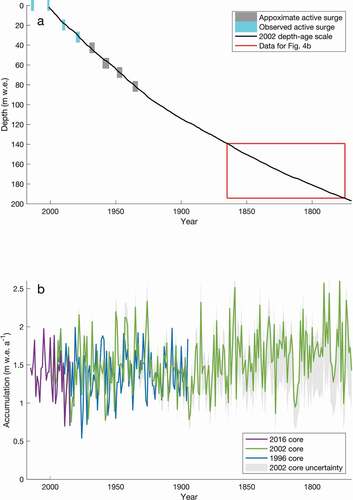
We accounted for thinning due to glacier flow in the 2002 record using a one-dimensional glacier flow model, which we refer to as the Dansgaard-Johnsen (Dansgaard and Johnsen Citation1969) model (). We used two additional models, Nye (Citation1963) and Hooke (Kaspari et al. Citation2008), but they did not fit the depth–age scale as well and are used here only to bound accumulation uncertainty (). Following Neff et al. (Citation2012) and Winski et al. (Citation2017), we tested all reasonable combinations of free parameters (background accumulation and height of flow regime change; Dansgaard and Johnsen Citation1969) in the model to assess which model run most closely matched our observed depth–age scale (). In the model, we generated a suite of different age scales using long-term average accumulation rates ranging from 20 to 300 cm a−1 in 10-cm increments. We tested scenarios in which the Dansgaard-Johnsen flow regime change (kink height) occurs at every height in 10-m intervals between the firn–ice transition (250 m above the bed) and the bed. These activities resulted in a total of 1,508 separate model runs (29 Nye, 609 Hooke, and 870 Dansgaard-Johnsen), each producing a unique depth–age scale.
For each modeled depth–age scale, we calculated the sum of root mean square errors between the layer-counted and modeled depth–age scale positions at each year. Of all combinations of models and input parameters, we found that the optimized version of the Dansgaard-Johnsen model produced the lowest root mean square error and closest match to our observed depth–age scale. In our modeled depth–age scale, we used 337 m w.e. (approximately 376 m of absolute thickness) because this yielded the lowest error between the optimized Dansgaard-Johnsen model (the closest fit) and the layer-counted timescale. The accumulation rate used herein is equal to the ratio of the observed layer thickness (from the annual layer counting) over the modeled layer thickness (from the optimized Dansgaard-Johnsen model) multiplied by 1.4 m, which is the optimized value of long-term accumulation that produces the best fit to the timescale. The accumulation rate calculations are relatively insensitive to our flow modeling estimates because we focus on the accumulation history in the upper part of the ice core. In 1935, the earliest documented surge, the full range of accumulation rates varies by only 10 percent based on different choices in height of flow regime change. We report accumulation uncertainty here, based on the more conservative range of results among the three flow models, as an estimated ±15 percent in the 1930s, with lower uncertainties near the top of the record.
The 2016 core was primarily dated using oxygen (δ18O) and deuterium (δD) isotope ratios and deuterium excess (dxs; EquationEquation (1)(1)
(1) ; Dansgaard Citation1964), with additional constraints from major ions (Na+, SO42−, and Mg2+):
We did not apply any thinning corrections to the 2016 core, because it only covers the top 59 m of the firn zone and firn–ice transition zone where thinning is negligible.
We define our cumulative accumulation interval for each quiescent phase to stretch from the year following surge initiation to the initiation year of the next surge (Eisen, Harrison, and Raymond Citation2001), which equates to 1935–1944, 1945–1955, 1956–1966, 1967–1977, 1978–1988, 1989–2000, and 2001–2012 (). The surge initiation dates we use are from Kochtitzky et al. (Citation2019), which are well constrained in the satellite era since 1973. Before the satellite era, our initiation years are within the uncertainty bounds determined by Kochtitzky et al. (Citation2019) from advanced terminus positions and/or push moraines captured in aerial photographs.
Snow line measurements
To infer the position of the equilibrium line altitude, we manually digitized the position of the snow line using the Landsat archive. All available cloud-free Landsat images of Donjek Glacier were downloaded from Earth Explorer (https://earthexplorer.usgs.gov), and the last available image of the ablation season (July, August, or September) of each year was selected to determine the summer transient snow line (TSL) for most years from 1972 to 2017. We additionally used one aerial photograph from 8 July 1951, which was georeferenced with eight tie points to produce an estimated horizontal uncertainty of 72.4 m.
We estimated the mean elevation of the snow line for each year using a 2013 WorldView digital elevation model (DEM) along the main trunk of the glacier. We additionally measured the TSL for the entire glacier for 1977 and 2017. We are unable to account for glacier surface elevation change over time due to a lack of reliable DEMs prior to 2002, but little change (less than 30 m horizontally) in exposed rock along the glacier margins since the 1970s suggests that elevation changes in the elevation range bounding the snow lines have not been large. Thus, our snow line change analysis represents a maximum possible change, because the 1950s snow line observation was likely on a slightly higher glacier surface.
Climate data
To infer climate conditions at Donjek Glacier, we used temperature and precipitation data from the Environment and Climate Change Canada weather station at Burwash Landing (61°22ʹ14″ N, 139°2ʹ24″ W, 806 m a.s.l.), 32 km northeast of the current glacier terminus (~1,000 m a.s.l.). Data were downloaded from the Government of Canada Historical Climate Data site (http://climate.weather.gc.ca) using the Canadian Climate Data Scraping Tool (Bonifacio et al. Citation2015). The Burwash Landing weather station has been operational since 1968 and has a nearly continuous hourly and daily record. We did not apply an elevation correction to any weather data from Burwash Landing because we only use these data to infer cumulative change in air temperatures between surge events, and the terminus of Donjek Glacier is only approximately 200 m higher than Burwash Landing.
We constructed a continuous annual mean temperature record from monthly average temperatures recorded at the weather station to examine long-term temperature change. We also reconstructed a record of annual positive degree days (PDDs) from the daily temperature data from Burwash Landing (e.g., Ohmura Citation2001). Of the 18,263-day record from 1 January 1968 to 31 December 2017, 1,038 days did not have mean daily temperature readings. To fill these gaps, we linearly interpolated missing data using the daily mean temperature observation nearest in time. We then calculated the number of annual PDDs by summing the daily mean temperature for all days that exceeded 0°C for each calendar year.
To examine the impacts of cumulative and extreme rain events, we summed daily rainfall data from October 1966 to January 2013 recorded at Burwash Landing to calculate annual liquid precipitation. There were 2,479 days of daily rainfall data missing out of the 18,263-day record, of which 1,010 occurred between 1 May and 30 September. We did not attempt to fill the data gaps, so annual estimates should be considered as minima.
Because Burwash Landing can frequently experience winter inversions and the temperature record has some missing data, we additionally examined a temperature reanalysis record for the 1,400 to 1,600 m elevation range of Donjek Glacier, which corresponds to the area between approximately 8 to 13 km up-glacier from the terminus. We used the North American Regional Re-analysis (NARR) data set produced by the National Center for Environmental Prediction to complement the Burwash Landing station observations and provide a temperature record for Donjek Glacier. NARR air temperatures are produced through the combination of surface, radiosonde, and satellite temperature data with the Eta atmospheric model (Mesinger et al. Citation2006). The surface air temperatures at 3-hour intervals for June, July, and August over the period 1976 to 2016 were downscaled using atmospheric temperatures from sixteen pressure levels between 1,000 and 500 hPa (Jarosch, Anslow, and Clarke Citation2012). The NARR air temperatures were downscaled to a resolution of 200 m, from the native 32 km, using a three-part linear piecewise fitting to vertical air profiles and interpolation of fitted parameters (e.g., temperature and pressure). The downscaled NARR air temperatures perform as well in the Yukon St. Elias region as over British Columbia, which is confirmed by meteorological air temperature measurements and MODIS Land Surface Temperature measurements over regions of permanent snow and ice (Williamson et al. Citation2017, Citation2018). The 200-m downscaled temperature data had a mean bias of 0.5°C and a mean absolute error of ≤2°C for monthly averages compared to seventy-eight stations in southern British Columbia for data between 1990 and 2008 (Jarosch, Anslow, and Clarke Citation2012). We produced daily averages from the 3-hourly downscaled NARR product and subset the data into 200-m elevation bins for Donjek Glacier using the Randolph Glacier Inventory glacier outline and 2013 WorldView DEMs for the elevation binning, which is the best elevation source available. To calculate the NARR derived PDDs, we summed the daily averages higher than 0°C for 1 May through 30 September between 1979 and 2016.
Results
Cumulative snow accumulation
Using the cumulative annual snow accumulation from the three ice cores, we find a range of 13.1 and 17.7 m w.e. (mean 15.5 ± 1.46 m w.e.) accumulated at Eclipse Icefield between each of the eight most recent surges of Donjek Glacier (). Though the three ice cores did not record the same amount of accumulation each year, they also do not show a pattern of consistent spatial bias across Eclipse Icefield when compared to each other (i.e., one ice core does not always record more accumulation than another; ).
Figure 4. Cumulative snow accumulation between surge events derived from the ice cores. (a) Cumulative annual accumulation from 1996, 2002, and 2016 ice cores between each surge event. Green (Burwash Landing) and black (NARR) circles indicate cumulative PDDs between surge events on the secondary y-axis. After each quiescent period, the accumulation is reset to zero, because each set of escalating bars represents a single quiescent period (e.g., 2001 to 2012; same for Figure 4b). (b) Accumulation offset record. The cumulative accumulation from the 2002 ice core is offset by 160 years, the estimated time needed for surface snow/firn/ice to travel from Eclipse Icefield to the constriction at 21 km from the terminus, where the primary portion of the glacier actively involved in surging begins (see ). Solid and dashed black lines show the mean value and one standard deviation cumulative accumulation average between surge events. The part of the ice core where this originates is indicated by the red box in
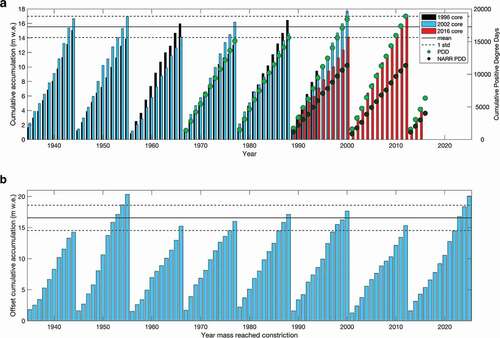
Surging is limited to the lower 21 km of Donjek Glacier (Kochtitzky et al. Citation2019; ), with the upper boundary of the reservoir zone at the valley constriction. As such, snow accumulation at the ice core site 32.3 km upstream of the constriction may not have an immediate influence on surge behavior. To extract patterns in accumulation between the surge events, we first calculated the time that it would take mass to advect from Eclipse Icefield to the constriction from the integrated surface flow speed, neglecting ablation and any submergence or emergence velocity. In 2007, the average surface flow speed was 201.4 m a−1 along the entire length of Donjek Glacier’s center flowline, with a spatial variability of 11.4 to 398 m a−1 between the ice cores site and the constriction (Van Wychen et al. Citation2018). Thus, snow that accumulates on Eclipse Icefield takes approximately 160 years to reach the constriction, assuming that present-day average velocities are similar to those of past centuries. We therefore offset the accumulation record derived from the 2002 ice core by 160 years to reconstruct the accumulation history preceding the surges (e.g., accumulation that reached the constriction in 2002 fell as snow in 1842; ). Using this offset record, the cumulative accumulation between the eight surge events ranges between 14.2 and 20.4 m w.e. (mean of 16.6 ± 2.0 m w.e.; ), with an average cumulative accumulation 7 percent higher than calculated with accumulation data from the same year in which the snow fell.
It is difficult to assess whether the assumption of constant velocity over time is realistic, but different offset periods over a range of ±80 years from 160 would only shift when accumulation occurred in time and make little difference to the total accumulation between repeat surge events. For example, if accumulation were transported 80 years faster the mean cumulative accumulation between surges would be 19.25 ± 2.86 m w.e., whereas if the ice were transported 80 years slower the mean cumulative accumulation would be 18.37 ± 1.69 m w.e. (where the uncertainty is one standard deviation). Regardless of transport time (80, 160, or 240 years), all mean cumulative accumulation results are within one standard deviation of each other.
Snow line change
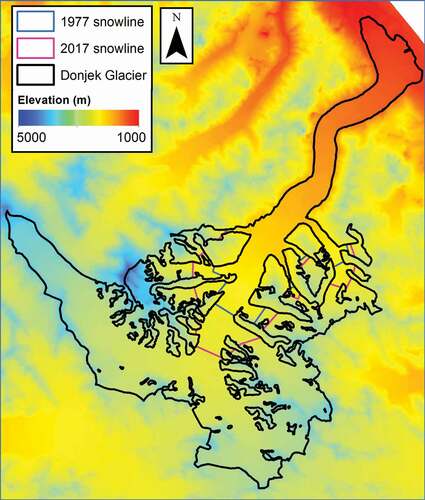
Our remote sensing analysis illustrates that the TSL in the central flow unit of Donjek Glacier has migrated upglacier by 550 m decade−1 horizontally and risen by at most 10.3 m decade−1 in absolute elevation over the period 1951 to 2017 (). This corresponds to the area 35 to 40 km up-glacier from the Donjek Glacier terminus and 15–20 km above the reservoir zone and constriction. Over the study period, the TSL was lowest in 1977 at 2,430 m a.s.l. (), with an accumulation area of 337.3 km2 and an accumulation area ratio of 75.3 percent (). The TSL reached its highest average elevation of 2,550 m a.s.l. in 2017, corresponding to an accumulation area ratio of 68.4 percent. The increase in the TSL from 1977 to 2017 is indicative of a reduced surface mass balance over time. Even though some TSL measurements were made early in the ablation season, we do not find our snow line measurements to be biased by timing of the observation, because snow line elevations in the late melt season were not consistently different from those early in the melt season ().
Figure 5. Climate in the Donjek Glacier region: (a) Snow line measurements for the main trunk of Donjek Glacier from the last available satellite image of the annual melt season in July, August, or September with error bars indicating one standard deviation and linear trend over the study period. (b) Burwash Landing annual average temperature record (red) with linear trend (thin red) and NARR temperatures from 1,400 to 1,600 m on Donjek Glacier from winter, summer, and annual mean with linear trend. (c) Mean annual snow accumulation record from 1996, 2002, and 2016 ice cores from Eclipse Icefield with linear trend (R2 = 0.00; red line) and ten-year moving average. (d) Precipitation recorded at Burwash Landing with annual and monthly totals from 1967 to 2012; the monthly data (black vertical bars) emphasize the month each year with the most precipitation. Dark blue horizontal bars indicate a period when Donjek Glacier was known to surge (Kochtitzky et al. Citation2019)
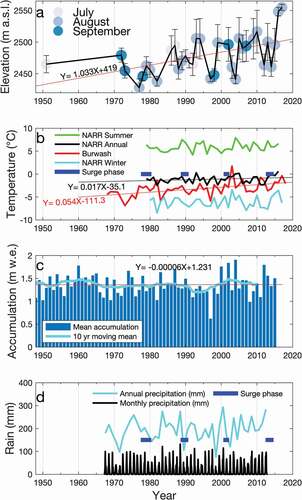
Figure 6. SPOT-5 DEM of Donjek Glacier from 13 September 2007, showing the highest (2017) and lowest (1977) summer transient snow lines in the satellite record
Temperature and precipitation trends
An increase in mean annual temperature of 0.5°C decade−1 occurred at Burwash Landing between 1968 and 2017, equivalent to a total rise of approximately 2.5°C over the fifty-year study period (), which is consistent with the measured rise in snow line elevation and negative glacier mass balance. The mean annual temperature at Burwash Landing reached a minimum of −6.9°C in 1973 and a maximum of 1.7°C in 2003. In addition to a rise in mean annual temperature, the number of cumulative PDDs at Burwash Landing increased during each of the past four quiescent phases, from 15,095 PDDs in the 1967–1977 quiescent period to 18,899 PDDs in the 2001–2012 period (). However, NARR model results show a smaller rise in temperature of 0.2°C decade−1 (not significant, with a p value of .16), with an overall temperature rise of approximately 0.65°C over the period 1979–2016 for the 1,400 to 1,600 m elevation band of Donjek Glacier.
Annual accumulation derived from the Eclipse Icefield ice cores shows no significant trends over the study period, with values ranging from 0.62 to 1.91 m w.e. a−1 (). A linear fit to the annual average accumulation from 1948 to present has a slightly positive but nonsignificant slope of 0.6 mm w.e. a−1. However, the accumulation variance has increased from 0.039 m2 (1948 to 1982) to 0.068 m2 (1982 to 2016) in recent decades.
Precipitation records from Burwash Landing indicate that the initiation of the 1988, 2000, and 2012 surges coincided with some of the rainiest years on record, although these were not necessarily high snow accumulation years (). The top five annual rainfall totals on record from 1967 to 2012 for Burwash Landing were 2000 (293.5 mm), 2012 (284.0 mm), 1983 (274.9 mm), 1988 (273.9 mm), and 2005 (260.0 mm). However, the 1977 surge initiation coincided with relatively dry conditions (27th highest annual total rainfall year out of forty-six years in the study period; ). Days and/or months with higher total rainfall could have occurred while the station at Burwash Landing was not in operation due to data gaps.
Three of the top ten rainiest months appear to coincide with surge onsets (). The rainiest month on record was July 1988 (131.8 mm), and Donjek started surging the following month (Kochtitzky et al. Citation2019). The third rainiest month on record occurred in August 2000 (114.7 mm), and Donjek started to surge that month or the next (Kochtitzky et al. Citation2019). Donjek surged at the end of the 1960s (Kochtitzky et al. Citation2019), and the tenth rainiest month on record occurred in July 1967. All of these rain events occurred during the summer, when temperatures are well above freezing and snow is unlikely on Donjek Glacier, which is only 200 m higher than Burwash Landing at the terminus.
Discussion
Snow and mass accumulation on surge-type glaciers
The time it takes for a glacier to build up to its presurge geometry depends on the ice volume displacement in the reservoir zone during the previous surge, the subsequent reservoir zone cumulative mass balance, and the flux imbalance between actual and balance flux during quiescence (see Clarke Citation1987). Eisen, Harrison, and Raymond (Citation2001) found that Variegated Glacier’s cumulative mass balance consistently reached a threshold of 43.5 m ice equivalent (39.9 m w.e.) before the glacier surged, and Dyurgerov, Aizin, and Buynitskiy (Citation1985) similarly found that a total of 360 ± 70 million tons of mass accumulated between each of four surge events of Medvezhiy Glacier, Tajikistan. On Donjek Glacier, 15.5 ± 1.46 m w.e. or 16.6 ± 2.0 m w.e. accumulates at Eclipse Icefield between surge events, depending on whether we account for an offset in redistribution to the surge initiation region, approximately 32 km downstream of the ice core site. For some glaciers, however, it is known that an equivalent amount of mass accumulated in the reservoir zone is not emptied during a subsequent surge: At Dyngjujökull, Iceland, for example, 13 km3 of the 20 km3 of ice accumulated in the reservoir zone during its twenty-year quiescence was transported to the receiving zone in the two years of active surging (Björnsson, Pálsson, and Sigurðsson Citation2003). In addition, it is possible that the consistent net accumulation observed at Eclipse Icefield between surge events simply reflects consistent average accumulation (Wake, Yalcin, and Gundestrup Citation2002; Kelsey et al. Citation2012) over each of the approximately twelve-year surge intervals (Abe, Furuya, & Sakakibara, Citation2016; Kochtitzky et al. Citation2019).
Surges of glacier systems with surge-type tributaries, or mass advection to or from adjacent basins (e.g., outlets from ice caps), can be irregular, and it can be difficult to relate a surge interval to climatic conditions and accumulation rates, even under quasistable climatic conditions (Glazovskiy Citation1996; Björnsson, Pálsson, and Sigurðsson Citation2003; Kienholz et al. Citation2016). One of Donjek Glacier’s tributaries surged in 2004 and 2010 (~23 km from its terminus on the east side of Donjek’s main trunk, shown in ), adding mass to Donjek’s main trunk approximately 2 km upstream of the top of the trunk’s reservoir zone (Kochtitzky et al. Citation2019). However, even though both of these tributary surges occurred in the quiescent phase of the trunk glacier, neither appear to have shortened the duration of the trunk’s quiescent phases.
Climate and surge behavior
Surge-type glaciers occur most commonly, but not exclusively, in specific climate zones that are bounded by temperature and precipitation thresholds (Sevestre and Benn Citation2015). Temporal changes in surge controls, and thus in surge propensity, can occur due to climate change or climate-forced changes in glacier size, elevation, hypsometry, thermal regime, and/or subglacial drainage system. Glaciers can change their surge behavior to include less extensive surges, shorter phase duration, or even complete cessation of surging (Hoinkes Citation1969; Hansen Citation2003; Christoffersen, Piotrowski, and Larsen Citation2005; Frappé and Clarke Citation2007; Clarke Citation2014), and widespread renewed surge activity has recently occurred in the high Karakoram (Hewitt Citation2007; Copland et al. Citation2011; Quincey, Braun, and Bishop Citation2011; Bhambri et al. Citation2017). This suggests that mass balance, melt conditions, thermal regime, and related supra-, en-, and subglacial hydrology could each or all influence surging (e.g., Dowdeswell et al. Citation1995; Eisen et al. Citation2005; Sund et al. Citation2009).
Even though surface air temperature has increased by 0.5°C decade−1 at Burwash Landing or 0.2°C decade−1 on Donjek Glacier (NARR), and Donjek Glacier has a negative mass balance, we do not observe an altered surge recurrence interval. Ice cores from Eclipse Icefield also show no significant change in accumulation since at least 1950 (Wake, Yalcin, and Gundestrup Citation2002; Kelsey et al. Citation2012). However, Kochtitzky et al. (Citation2019) reported that each of the past eight surges have been areally less extensive than previous surge events, similar to other glaciers in the St. Elias, such as Lowell Glacier (Bevington and Copland Citation2014). Lowell Glacier has a more variable twelve- to eighteen-year repeat interval since around 1948 (Bevington and Copland Citation2014), potentially suggesting a change in surge mechanisms over time. Less extensive surge events are likely caused by a rising snow line and increasing number of PDDs, leading to a persistently more negative mass balance (Berthier et al. Citation2010; Larsen et al. Citation2015). Similar observations of less extensive surge events during a period of negative mass balance have occurred in Iceland (Sigurdsson and Jónsson Citation1995). These observations suggest that glacier-wide mass balance may control the extent of each surge event, and other mechanisms may control the surge recurrence interval.
Rapid mass redistribution, related surface lowering, and frontal advance during surges are important for short- and long-term glacier surface mass balance. Postsurge accelerated ablation, thinning, and retreat rates have been measured and modeled for surge-type glaciers in Iceland (Aðalgeirsdóttir et al. Citation2005), West Greenland (Yde and Knudsen Citation2007), Alaska (Muskett et al. Citation2008), and Svalbard (Nuttall, Hagen, and Dowdeswell Citation1997; Moholdt et al. Citation2010). For Donjek Glacier, surges have also led to glacier-wide negative mass balance (Kochtitzky et al. Citation2019). Though many of these glaciers are already experiencing a negative mass balance (Larsen et al. Citation2015), the enhanced negative mass balance associated with surging merits further investigation in projections of glacier mass loss in a changing climate.
Surge onset and weather
Weather has been suggested to affect surge initiation and termination (Harrison and Post Citation2003), particularly in relation to strong melt, heavy rainfall, and large annual snow accumulation. Here, we focus on surge initiation, because our results show that rain may be an important factor.
Lingle and Fatland (Citation2003) postulated that a temperate glacier will not surge until it has built up critical thickness (basal shear stress) and surface meteorological conditions occur that allow for storage of a large volume of englacial water. For Alaskan-type surges, this has been shown to result in a late-winter to spring surge onset (Raymond Citation1987; Harrison and Post Citation2003). A suite of anecdotal evidence supports this hypothesis (Kamb et al. Citation1985; Pritchard et al. Citation2005; Muskett et al. Citation2008), but there are also examples of temperate glaciers with surge initiation in seasons other than winter or spring (Harrison et al. Citation1994; Björnsson, Pálsson, and Sigurðsson Citation2003), including Donjek Glacier. Donjek Glacier surge initiation has occurred during summer months for the past four well-constrained surges (Kochtitzky et al. Citation2019), suggesting that surface meltwater runoff and rainfall could play an important role in triggering rapid subglacial sliding.
Surge initiation in polythermal glaciers has been linked to surface melt (Dunse et al. Citation2015) but may be confounded by various other factors determining driving stress and bed friction (Clarke, Collins, and Thompson Citation1984; Sund, Lauknes, & Eiken Citation2014; Strozzi, Kääb, and Schellenberger Citation2017; Gong et al. Citation2018). Although a winter/spring start is also common for polythermal glaciers (Hodgkins Citation1997; Jiskoot and Juhlin Citation2009; Sund et al. Citation2014), these surges can potentially start in any season and may therefore still involve enhanced snow or rainfall (Quincey, Braun, and Bishop Citation2011). Surge trigger zones in polythermal glaciers have also been correlated with ponding of water and extensive slush flows associated with heavy late-spring (wet) snowfalls alternating with short-term episodes of exceptionally high temperatures (Hewitt Citation2007). In summary, although some evidence and intuitive reasoning suggest that the seasonality of surges could indeed be different for temperate glaciers than for polythermal glaciers, no comprehensive analysis of seasonality of surge initiation and termination in combination with thermal regime and surge development exists to date.
Donjek surge mechanisms
Abe et al. (2015) suggested that the constriction at 21 km from the terminus plays a crucial role in causing Donjek Glacier to surge. However, Kochtitzky et al. (Citation2019) showed that the constriction was rather the upper extent of surge-type behavior and was coincident with a change in bedrock lithology. We find no single conclusive factor that causes Donjek Glacier to surge, although we can conclude that PDDs are not a significant control on surge recurrence interval. Though Donjek Glacier reaches a consistent 13.1 to 17.7 m w.e. snow accumulation in its upper accumulation area before a surge event, this number cannot be confidently linked with the surge recurrence interval given that it could also be an indicator of consistent decadal averaged accumulation. Even though Kochtitzky et al. (Citation2019) showed refilling of the reservoir zone on Donjek Glacier, the limited elevation measurements during recent surge events are inconclusive in using the reservoir zone as a predictor for future surge events without more observations. We need better information about glacier-wide mass balance to better understand the relationship between mass balance and surging. Assuming that past accumulation is an indicator of future surge events, as displayed in , the next surge is likely to occur between 2022 and 2026.
One possibility is that mass accumulation at Donjek Glacier is a prerequisite for surge initiation, but it cannot trigger the surge alone. We show here that high rainfall totals frequently occur before a surge event, which could act as a trigger. The Kluane Lake region is known for occasional heavy rain storms during some summers, in an otherwise dry region, leading to extensive flooding and landslides (Evans and Clague Citation1989). From 8 to 15 July 1988, Burwash Landing received 91.6 mm of rain, 42 percent of the total annual average (Evans and Clague Citation1989), and the next month a surge of Donjek Glacier initiated. Similar massive rain events have not been observed since 1988; however, 32.2 mm of rain fell at Burwash on 29 June 2000, and a surge initiated in August or September that year (Kochtitzky et al. Citation2019). More work is needed to determine the relationship between rainfall and surge initiation in this region.
More observations of Donjek Glacier surface velocity, bedrock lithology, and valley geometry are needed to understand surging kinematics and their role in controlling surge initiation and termination. For an unnamed glacier in the nearby Donjek Range, Flowers et al. (Citation2011) suggested that a subglacial bedrock rise facilitates surging because the reverse slope resists ice flow and promotes mass accumulation in the surge reservoir zone during quiescence. Crompton, Flowers, and Stead (Citation2018) showed that surge-type glacier basins in the St. Elias (not including Donjek) had less fractured bedrock. The role of bedrock topography and lithology in the surge behavior of Donjek Glacier is presently unknown and merits further investigation.
Summary and conclusions
We use three ice cores to reconstruct the accumulation record for Donjek Glacier leading up to seven documented surge events since the 1930s. We find that Eclipse Icefield received between 13.1 and 17.7 m w.e. (mean of 15.5 ± 1.46 m w.e.) total snow accumulation in the approximately 12 years between surge events. If, however, we offset for the approximately 160 years it takes for snow/firn/ice to be transported to the head of the surge zone, the total snow accumulation between surges amounts to between 14.2 and 20.4 m w.e. (mean of 16.6 ± 2.0 m w.e.). Though mean annual air temperatures increased by ~2.5°C from 1968 to 2017 at Burwash Landing, approximately 30 km from Donjek Glacier terminus, we observed no change in the surge recurrence interval over this time period, although each recent surge advance has become less extensive than the previous. This decline in surge area coincides with a rising snow line indicative of reduced glacier-wide mass balance. Although we find that cumulative accumulation is the most consistent climate variable between surge events of Donjek Glacier, our results remain inconclusive as to the role of accumulation in driving surge behavior. We suggest that yet unknown subglacial processes are the primary driver of surging at Donjek Glacier, but mass accumulation in the reservoir zone remains a necessary precondition for a surge to initiate. Further investigations are needed to understand the relationship between glacier-wide surface mass balance and surging.
The highest rainfall amounts typically occur during the summer month preceding a surge initiation. Though not every observed surge initiates with a high rainfall amount, the three most recent surges (1988–1990, 2000–2002, 2012–2014) all coincided with one of the top five years in the forty-six-year precipitation record. The surge of 1988–1990 was preceded by a particularly large rainstorm the month before initiation.
Observations of bedrock and bed elevation are necessary to understand surge mechanisms of Donjek Glacier. Additionally, monitoring surface elevation changes on Donjek Glacier as it prepares for its next surge event by the mid-2020s can yield valuable knowledge as to how the subglacial hydrology beneath Donjek Glacier changes as a surge initiates. This will ultimately lead to more knowledge of surge initiation mechanisms, which can lead to better forecasting of surge events and magnitudes and therefore mitigate glacier hazards.
Author Contribution
WK, KK, LC, and HJ designed the study. WK carried out data analysis for all remote sensing and weather station data. DW, EM, KK, WK, and SC collected and analyzed the 2016 ice core. DW, EM, KK, and WK reprocessed the 2002 ice core. SW provided analysis of the downscaled NARR data set. WK prepared the article with contributions from all co-authors.
Acknowledgments
This work was undertaken in the Traditional Territory of the Kluane First Nation people, and we are thankful for their engagement with this work. We thank Daniel Dixon, Steven Bernsen, Justin Leavitt (University of Maine), Dorota Medrzycka (University of Ottawa), and Patrick Saylor (Dartmouth College) for their help collecting the 2016 ice core, Douglas Introne and Michael Handley for ice core analysis, and Cameron Wake (University of New Hampshire) for help reprocessing the 2002 core isotope data. We thank Robert McNabb (University of Oslo) for the 2002 ASTER DEM and Icefield Discovery, Trans North helicopters, and the Kluane Lake Research Station for their logistical support. We thank the RemoteEx partnership exchange program, funded by the Norwegian Agency for International Cooperation and Quality Enhancement in Higher Education, for facilitating research collaboration that greatly benefited this work. Finally, we thank two anonymous reviewers and the Associate Editor Jacob Yde for their helpful comments in improving this manuscript.
Disclosure statement
No potential conflict of interest was reported by the authors.
Additional information
Funding
References
- Abe, T., M. Furuya, and D. Sakakibara. 2016. Brief Communication: Twelve-year cyclic surging episodes at Donjek Glacier in Yukon, Canada. The Cryosphere 10 (4):1427–32. doi:https://doi.org/10.5194/tc-10-1427-2016.
- Aðalgeirsdóttir, G., H. Björnsson, F. Pálsson, and E. Magnússon. 2005. Analyses of a surging outlet glacier of Vatnajökull ice cap, Iceland. Annals of Glaciology 42:23–28. doi:https://doi.org/10.3189/172756405781812934.
- Benn, D. I., A. C. Fowler, I. Hewitt, and H. Sevestre. 2019. A general theory of glacier surges. Journal of Glaciology 65 (253): 701–16. doi:https://doi.org/10.1017/jog.2019.62.
- Berthier, E., E. Schiefer, G. K. C. Clarke, B. Menounos, and F. Remy. 2010. Contribution of Alaskan glaciers to sea-level rise derived from satellite imagery. Nature Geoscience 3 (2):92–95. doi:https://doi.org/10.1038/ngeo737.
- Bevington, A., and L. Copland. 2014. Characteristics of the last five surges of Lowell Glacier, Yukon, Canada, since 1948. Journal of Glaciology 60 (219):113–23. doi:https://doi.org/10.3189/2014JoG13J134.
- Bhambri, R., K. Hewitt, P. Kawishwar, and B. Pratap. 2017. Surge-type and surge-modified glaciers in the Karakoram. Scientific Reports 7 (1):15391. doi:https://doi.org/10.1038/s41598-017-15473-8.
- Björnsson, H., F. Pálsson, and O. Sigurðsson. 2003. Surges of glaciers in Iceland. Annals of Glaciology 36:82–90. doi:https://doi.org/10.3189/172756403781816365.
- Blake, E., C. P. Wake, and M. Gerasimoff. 1998. The ECLIPSE drill: A field-portable intermediate-depth ice-coring drill. Journal of Glaciology 44 (146):175–78. doi:https://doi.org/10.1017/S0022143000002471.
- Bonifacio, C., T. E. Barchyn, C. H. Hugenholtz, and S. W. Kienzle. 2015. CCDST: A free Canadian climate data scraping tool. Computers & Geosciences 75:13–16. doi:https://doi.org/10.1016/j.cageo.2014.10.010.
- Budd, W. F. 1975. A first model for periodically self-surging glaciers. Journal of Glaciology 14 (70):3–21. doi:https://doi.org/10.3189/S0022143000013344.
- Campbell, S., S. Roy, K. Kreutz, S. A. Arcone, E. C. Osterberg, and P. Koons. 2013. Strain-rate estimates for crevasse formation at an alpine ice divide: Mount Hunter, Alaska. Annals of Glaciology 54 (63):200–08. doi:https://doi.org/10.3189/2013AoG62A266.
- Christoffersen, P., J. A. Piotrowski, and N. K. Larsen. 2005. Basal processes beneath an Arctic glacier and their geomorphic imprint after a surge, Elisebreen, Svalbard. Quaternary Research 64 (2):125–37. doi:https://doi.org/10.1016/j.yqres.2005.05.009.
- Clarke, G. K. C. 1987. Fast glacier flow: Ice streams, surging, and tidewater glaciers. Journal of Geophysical Research 92 (B9):8835–41. doi:https://doi.org/10.1029/JB092iB09p08835.
- Clarke, G. K. C. 2014. A short and somewhat personal history of Yukon glacier studies in the twentieth century. Arctic 67 (1):1–21. doi:https://doi.org/10.14430/arctic4355.
- Clarke, G. K. C., J. P. Schmok, C. S. L. Ommanney, and S. G. Collins. 1986. Characteristics of surge-type glaciers. Journal of Geophysical Research: Solid Earth 91 (B7):7165–80. doi:https://doi.org/10.1029/JB091iB07p07165.
- Clarke, G. K. C., S. G. Collins, and D. E. Thompson. 1984. Flow, thermal structure, and subglacial conditions of a surge-type glacier. Canadian Journal of Earth Sciences 21 (2):232–40. doi:https://doi.org/10.1139/e84-024.
- Clarke, G. K. C., and W. H. Mathews. 1981. Estimates of the magnitude of glacier outburst floods from Lake Donjek, Yukon-Territory, Canada. Canadian Journal of Earth Sciences 18 (9):1452–63. doi:https://doi.org/10.1139/e81-136.
- Copland, L., T. Sylvestre, M. P. Bishop, J. F. Shroder, Y. B. Seong, L. A. Owen, A. Bush, and U. Kamp. 2011. Expanded and recently increased glacier surging in the Karakoram. Arctic, Antarctic, and Alpine Research 43 (4):503–16. doi:https://doi.org/10.1657/1938-4246-43.4.503.
- Crompton, J. W., G. E. Flowers, and D. Stead. 2018. Bedrock fracture characteristics as a possible control on the distribution of surge-type glaciers. Journal of Geophysical Research: Earth Surface 123 (5):853–73.
- Cruikshank, J. 1981. Legend and landscape: Convergence of oral and scientific traditions in the Yukon Territory. Arctic Anthropology 18 (2):67–93.
- Cuffey, K. M., and W. S. B. Paterson. 2010. The physics of glaciers. Burlington, MA: Elsevier.
- Dansgaard, W. 1964. Stable isotopes in precipitation. Tellus 16 (4):436–68. doi:https://doi.org/10.3402/tellusa.v16i4.8993.
- Dansgaard, W., and S. J. Johnsen. 1969. A flow model and a time scale for the ice core from Camp Century, Greenland. Journal of Glaciology 8 (53):215–23. doi:https://doi.org/10.3189/S0022143000031208.
- De Paoli, L., and G. E. Flowers. 2009. Dynamics of a small surge-type glacier investigated using 1-D geophysical inversion. Journal of Glaciology 55 (194):1101–12. doi:https://doi.org/10.3189/002214309790794850.
- Denton, G., and M. Stuiver. 1966. Neoglacial chronology, Northeastern St. Elias Mountains, Canada. American Journal of Science 264 (8):577–99. doi:https://doi.org/10.2475/ajs.264.8.577.
- Dolgoushin, L. D., and G. B. Osipova. 1975. Glacier surges and the problem of their forecasting. IAHS-AISH Publication 104:292–304.
- Dowdeswell, J. A., G. S. Hamilton, and J. O. Hagen. 1991. The duration of the active phase on surge-type glaciers: Contrasts between Svalbard and other regions. Journal of Glaciology 37 (127):338–400. doi:https://doi.org/10.1017/S0022143000005827.
- Dowdeswell, J. A., R. Hodgkins, A. ‐. M. Nuttall, J. O. Hagen, and G. S. Hamilton. 1995. Mass balance change as a control on the frequency and occurrence of glacier surges in Svalbard, Norwegian High Arctic. Geophysical Research Letters 22 (21):2909–12. doi:https://doi.org/10.1029/95GL02821.
- Dunse, T., T. Schellenberger, J. O. Hagen, A. Kääb, T. V. Schuler, and C. H. Reijmer. 2015. Glacier-surge mechanisms promoted by hydro-thermodynamic feedback to summer melt. The Cryosphere 9 (1):197–215. doi:https://doi.org/10.5194/tc-9-197-2015.
- Dyurgerov, M. B., V. B. Aizin, and A. B. Buynitskiy. 1985. Nakopleniye massy v oblasti pitaniya lednika Medvezh’yego za periody mezhdu yego podvizhkami [Mass accumulation in the accumulation area of Medvezhiy Glacier during its quiescence periods]. Materials Glyatsiology Issled 54:131–35.
- Eisen, O., W. D. Harrison, and C. F. Raymond. 2001. The surges of Variegated Glacier, Alaska, U.S.A., and their connection to climate and mass balance. Journal of Glaciology 47 (158):351–58. doi:https://doi.org/10.3189/172756501781832179.
- Eisen, O., W. D. Harrison, C. F. Raymond, K. A. Echelmeyer, G. A. Bender, and V. V. Gordeev. 2005. Variegated Glacier, Alaska, USA: A century of surges. Journal of Glaciology 51 (174):399–422. doi:https://doi.org/10.3189/172756505781829250.
- Evans, S. G., and J. J. Clague. 1989. Active earth: Rain-induced landslides in the Canadian Cordillera. Geoscience Canada 16 (3):193–200.
- Fisher, D., C. Wake, K. Kreutz, K. Yalcin, E. Steig, P. Mayewski, L. Anderson, et al. 2004. Stable isotope records from Mount Logan, Eclipse ice cores and nearby Jellybean Lake. Water cycle of the North Pacific over 2000 years and over five vertical kilometres: sudden shifts and tropical connections. Géographie physique et Quaternaire 58 (2–3):337–52.
- Flowers, G. E., N. Roux, S. Pimentel, and C. G. Schoof. 2011. Present dynamics and future prognosis of a slowly surging glacier. The Cryosphere 5 (1):299–313. doi:https://doi.org/10.5194/tc-5-299-2011.
- Foy, N., L. Copland, C. Zdanowicz, M. Demuth, and C. Hopkinson. 2011. Recent volume and area changes of Kaskawulsh Glacier, Yukon, Canada. Journal of Glaciology 57 (203):515–25. doi:https://doi.org/10.3189/002214311796905596.
- Frappé, T., and G. K. C. Clarke. 2007. Slow surge of Trapridge Glacier, Yukon Territory, Canada. Journal of Geophysical Research 112 (F3):F03S32. doi:https://doi.org/10.1029/2006JF000607.
- Glazovskiy, A. F. 1996. The problem of surge-type glaciers. In Variations of snow and ice in the past and at present on a global and regional scale, edited by Kotlyakov, 78. IHP-IV Project H-4.1, UNESCO.
- Gong, Y., T. Zwinger, J. Åström, B. Altena, T. Schellenberger, R. Gladstone, and J. C. Moore. 2018. Simulating the roles of crevasse routing of surface water and basal friction on the surge evolution of Basin 3, Austfonna ice cap. The Cryosphere 12 (5):1563–77. doi:https://doi.org/10.5194/tc-12-1563-2018.
- Hansen, S. 2003. From surge-type to non-surge-type glacier behaviour: Midre Lóvenbreen, Svalbard. Annals of Glaciology 36:97–102. doi:https://doi.org/10.3189/172756403781816383.
- Harrison, W. D., and A. Post. 2003. How much do we really know about glacier surging? Annals of Glaciology 36 (1):1–6. doi:https://doi.org/10.3189/172756403781816185.
- Harrison, W. D., G. B. Osipova, G. A. Nosenko, L. Espizua, A. Kääb, L. Fischer, C. Huggel, P. A. Craw Burns, M. Truffer, and A. W. Lai. 2015. Glacier surges. In Snow and ice-related hazards, risks and disasters, edited by J. F. Shroder, W. Haeberli, and C. Whiteman, 437–85. Cambridge, MA: Academic Press. doi:https://doi.org/10.1016/B978-0-12-394849-6.00013-5.
- Harrison, W. D., K. A. Echelmeyer, E. F. Chacho, C. F. Raymond, and R. J. Benedict. 1994. The 1987-88 surge of West Fork Glacier, Susitna, Alaska, U.S.A. Journal of Glaciology 40 (135):241–54. doi:https://doi.org/10.1017/S0022143000007334.
- Hewitt, K. 2007. Tributary glacier surges: An exceptional concentration at Panmah Glacier, Karakoram Himalaya. Journal of Glaciology 53 (181):181–88. doi:https://doi.org/10.3189/172756507782202829.
- Hodgkins, R. 1997. Glacier hydrology in Svalbard, Norwegian High Arctic. Quaternary Science Reviews 16 (9):957–73. doi:https://doi.org/10.1016/S0277-3791(97)00032-2.
- Hoinkes, H. C. 1969. Surges of the Vernagtferner in the Ötztal Alps since 1599. Canadian Journal of Earth Sciences 6 (4):853–60. doi:https://doi.org/10.1139/e69-086.
- Jarosch, A. H., F. S. Anslow, and G. K. C. Clarke. 2012. High-resolution precipitation and temperature downscaling for glacier models. Climate Dynamics 38 (1–2):391–409. doi:https://doi.org/10.1007/s00382-010-0949-1.
- Jiskoot, H., P. Boyle, and T. Murray. 1998. The incidence of glacier surging in Svalbard: Evidence from multivariate statistics. Computers & Geosciences 24 (4):387–99. doi:https://doi.org/10.1016/S0098-3004(98)00033-8.
- Jiskoot, H., A. Luckman, and T. Murray. 2003. Surge potential and drainage basin characteristics in East Greenland. Annals of Glaciology 36:142–48. doi:https://doi.org/10.3189/172756403781816220.
- Jiskoot, H., and D. T. Juhlin. 2009. Surge of a small East Greenland glacier, 2001-2007, suggests Svalbard-type surge mechanism. Journal of Glaciology 55 (191):567–70. doi:https://doi.org/10.3189/002214309788816605.
- Johnson, P. G. 1972. The morphological effects of surges of the Donjek Glacier, St Elias Mountains, Yukon Territory, Canada. Journal of Glaciology 11 (62):227–34. doi:https://doi.org/10.1017/S002214300002222X.
- Kamb, B., C. F. Raymond, W. D. Harrison, H. Engelhardt, K. A. Echelmeyer, N. Humphrey, M. M. Brugman, and T. Pfeffer. 1985. Glacier surge mechanism: 1982-1983 surge of Variegated Glacier, Alaska. Science 227 (4686):469–79. doi:https://doi.org/10.1126/science.227.4686.469.
- Kaspari, S., R. L. B. Hooke, P. A. Mayewski, S. Kang, S. Hou, and D. Qin. 2008. Snow accumulation rate on Qomolangma (Mount Everest), Himalaya: Synchroneity with sites across the Tibetan Plateau on 50–100 year timescales. Journal of Glaciology 54 (185):343–52. doi:https://doi.org/10.3189/002214308784886126.
- Kelsey, E. P., C. P. Wake, K. Yalcin, and K. Kreutz. 2012. Eclipse ice core accumulation and stable isotope variability as an indicator of North Pacific climate. The Journal of Climate 25 (18):6426–40. doi:https://doi.org/10.1175/JCLI-D-11-00389.1.
- Kienholz, C., R. Hock, M. Truffer, A. A. Arendt, and S. Arko. 2016. Geodetic mass balance of surge‐type Black Rapids Glacier, Alaska, 1980–2001–2010, including role of rockslide deposition and earthquake displacement. Journal of Geophysical Research: Earth Surface 121 (12):2358–80.
- Knüsel, S., S. Brutsch, K. Henderson, A. Palmer, and M. Schwikowski. 2005. ENSO signals of the twentieth century in an ice core from Nevado Illimani, Bolivia. Journal of Geophysical Research 110 (D1). doi: https://doi.org/10.1029/2004jd005420.
- Kochtitzky, W., H. Jiskoot, L. Copland, E. Enderlin, R. McNabb, K. Kreutz, and B. Main. 2019. Terminus advance, kinematics, and mass redistribution during eight surges of Donjek Glacier, St. Elias Range, Canada, from 1935 to 2016. Journal of Glaciology 65 (252):565–79. doi:https://doi.org/10.1017/jog.2019.34.
- Kochtitzky, W., L. Copland, M. Painter, and D. Dow. 2020. Draining and filling of ice dammed lakes at the terminus of surge-type Dań Zhùr (Donjek) Glacier, Yukon, Canada. Canadian Journal of Earth Sciences doi:https://doi.org/10.1139/cjes-2019-0233.
- Larsen, C. F., E. Burgess, A. A. Arendt, S. O’Neel, A. J. Johnson, and C. Kienholz. 2015. Surface melt dominates Alaska glacier mass balance. Geophysical Research Letters 42 (14):5902–08. doi:https://doi.org/10.1002/2015GL064349.
- Lingle, C. S., and D. R. Fatland. 2003. Does englacial water storage drive temperate glacier surges? Annals of Glaciology 36:14–20. doi:https://doi.org/10.3189/172756403781816464.
- Meier, M., and A. Post. 1969. What are glacier surges? Canadian Journal of Earth Sciences 6 (4):807–17. doi:https://doi.org/10.1139/e69-081.
- Mesinger, F., G. DiMego, E. Kalnay, K. Mitchell, P. C. Shafran, W. Ebisuzaki, D. Jović, J. Woollen, E. Rogers, and E. H. Berbery. 2006. North American regional reanalysis. Bulletin of the American Meteorological Society 87 (3):343–60. doi:https://doi.org/10.1175/BAMS-87-3-343.
- Moholdt, G., J. O. Hagen, T. Eiken, and T. V. Schuler. 2010. Geometric changes and mass balance of the Austfonna ice cap, Svalbard. The Cryosphere 4 (1):21–34. doi:https://doi.org/10.5194/tc-4-21-2010.
- Murray, T., T. Strozzi, A. Luckman, H. Jiskoot, and P. Christakos. 2003. Is there a single surge mechanism? Contrasts in dynamics between glacier surges in Svalbard and other regions. Journal of Geophysical Research 108 (B5):2237. doi:https://doi.org/10.1029/2002JB001906.
- Muskett, R. R., C. S. Lingle, J. M. Sauber, A. S. Post, W. V. Tangborn, and B. T. Rabus. 2008. Surging, accelerating surface lowering and volume reduction of the Malaspina Glacier system, Alaska, USA, and Yukon, Canada, from 1972 to 2006. Journal of Glaciology 54 (188):788–800. doi:https://doi.org/10.3189/002214308787779915.
- Neff, P. D., E. J. Steig, D. H. Clark, J. R. McConnell, E. C. Pettit, and B. Menounos. 2012. Ice-core net snow accumulation and seasonal snow chemistry at a temperate-glacier site: Mount Waddington, Southwest British Columbia, Canada. Journal of Glaciology 58 (212):1165–75. doi:https://doi.org/10.3189/2012JoG12J078.
- Nuttall, A.-M., J. O. Hagen, and J. Dowdeswell. 1997. Quiescent-phase changes in velocity and geometry of Finsterwalderbreen, a surge-type glacier in Svalbard. Annals of Glaciology 24:249–54. doi:https://doi.org/10.3189/S0260305500012258.
- Nye, J. F. 1963. Correction factor for accumulation measured by the thickness of the annual layers in an ice sheet. Journal of Glaciology 4 (36):785–88. doi:https://doi.org/10.3189/S0022143000028367.
- Ohmura, A. 2001. Physical basis for the temperature-based melt-index method. Journal of Applied Meteorology 40 (4):753–61. doi:https://doi.org/10.1175/1520-0450(2001)040<0753:PBFTTB>2.0.CO;2.
- Osipova, G. B. and D. G. Tsvetkov. 1991. Kinematics of the surface of a surging glacier (comparison of the Medvezhiy and Variegated glaciers). Proceedings of the International Symposium Held at St Petersburg, September 1990 208:345–57.
- Osterberg, E. C., P. A. Mayewski, D. A. Fisher, K. J. Kreutz, K. A. Maasch, S. B. Sneed, and E. Kelsey. 2014. Mount Logan ice core record of tropical and solar influences on Aleutian Low variability: 500–1998 A.D. Journal of Geophysical Research: Atmospheres 119 (19):11, 189–11, 204. doi:https://doi.org/10.1002/2014JD021847.
- Pritchard, H., T. Murray, A. Luckman, T. Strozzi, and S. Barr. 2005. Glacier surge dynamics of Sortebræ, east Greenland, from synthetic aperture radar feature tracking. Journal of Geophysical Research 110 (F3):F03005. doi:https://doi.org/10.1029/2004JF000233.
- Quincey, D. J., M. Braun, and M. P. Bishop. 2011. Karakoram glacier surge dynamics. Geophysical Research Letters 38 (18):L18504. doi:https://doi.org/10.1029/2011GL049004.
- Ragle, R. H. 1973. The Icefield Ranges Research Project, 1972. Arctic 26 (3):258–63. doi:https://doi.org/10.14430/arctic2924.
- Raymond, C. F. 1987. How do glaciers surge? A review. The Journal of Geophysical Research 92 (1):9121–34. doi:https://doi.org/10.1029/JB092iB09p09121.
- RGI Consortium. 2017. Randolph glacier inventory – A dataset of global glacier outlines: Version 6.0: Technical report, global land ice measurements from space. Colorado, USA: Digital Media. doi:https://doi.org/10.7265/N5-RGI-60.
- Robin, G. de Q., and J. Weertman. 1973. Cyclic surging of glaciers. Journal of Glaciology 12 (64):3–18. doi:https://doi.org/10.3189/S002214300002267X.
- Sevestre, H., and D. Benn. 2015. Climatic and geometric controls on the global distribution of surge-type glaciers: Implications for a unifying model of surging. Journal of Glaciology 61 (228):646–62. doi:https://doi.org/10.3189/2015JoG14J136.
- Sevestre, H., D. Benn, A. Luckman, C. Nuth, J. Kohler, K. Lindbäck, and R. Pettersson. 2018. Tidewater glacier surges initiated at the terminus. Journal of Geophysical Research: Earth Surface 123:1035–51. doi:https://doi.org/10.1029/2017JF004358R.
- Sigurdsson, O. 2005. Variations of termini of glaciers in Iceland in recent centuries and their connection with climate. Developments in Quaternary Sciences 5:241–55. doi:https://doi.org/10.1016/S1571-0866(05)80012-0.
- Sigurdsson, O., and T. Jónsson. 1995. Relation of glacier variations to climate changes in Iceland. Annals of Glaciology 21:263–70. doi:https://doi.org/10.3189/S0260305500015925.
- Striberger, J., S. Björck, I. O. Benediktsson, I. Snowball, C. B. Uvo, O. Ingólfsson, and K. H. Kjaer. 2011. Climatic control of the surge periodicity of an Icelandic outlet glacier. Journal of Quaternary Science 26 (6):561–65. doi:https://doi.org/10.1002/jqs.1527.
- Strozzi, T., A. Kääb, and T. Schellenberger. 2017. Frontal destabilization of Stonebreen, Edgeøya, Svalbard. The Cryosphere 11 (1):553–66. doi:https://doi.org/10.5194/tc-11-553-2017.
- Sund, M., T. Eiken, J. O. Hagen, and A. Kääb. 2009. Svalbard surge dynamics derived from geometric changes. Annals of Glaciology 50 (52):50–60. doi:https://doi.org/10.3189/172756409789624265.
- Sund, M., T. R. Lauknes, and T. Eiken. 2014. Surge dynamics in the Nathorstbreen glacier system, Svalbard. The Cryosphere 8 (2):623–38.
- Tangborn, W. 2013. Mass balance, runoff and surges of Bering Glacier, Alaska. The Cryosphere 7 (3):867–75. doi:https://doi.org/10.5194/tc-7-867-2013.
- Thøgersen, K., A. Gilbert, T. V. Schuler, and A. Malthe-Sørenssen. 2019. Rate-and-state friction explains glacier surge propagation. Nature Communications 10 (1):1–8. doi:https://doi.org/10.1038/s41467-019-10506-4.
- Truffer, M., W. D. Harrison, and K. A. Echelmeyer. 2000. Glacier motion dominated by processes deep in underlying till. Journal of Glaciology 46 (153):213–21. doi:https://doi.org/10.3189/172756500781832909.
- van Geffen, S., and J. Oerlemans. 2017. The 1982/83 surge and antecedent quiescent phase of Variegated Glacier: Revising the original dataset for application in flow line models. Journal of Glaciology 63 (241):772–82. doi:https://doi.org/10.1017/jog.2017.43.
- Van Wychen, W., L. Copland, H. Jiskoot, L. Gray, M. Sharp, and D. Burgess. 2018. Surface velocities of glaciers in Western Canada from speckle-tracking of ALOS PALSAR and RADARSAT-2 data. Canadian Journal of Remote Sensing 44 (1):57–66. doi:https://doi.org/10.1080/07038992.2018.1433529.
- Wake, C. P., K. Yalcin, and N. S. Gundestrup. 2002. The climate signal recorded in the oxygen-isotope, accumulation and major-ion time series from the Eclipse ice core, Yukon Territory, Canada. Annals of Glaciology 35:416–22. doi:https://doi.org/10.3189/172756402781817266.
- Williamson, S. N., F. S. Anslow, G. K. C. Clarke, J. A. Gamon, A. H. Jarosch, and D. S. Hik. 2018. Spring warming in Yukon mountains is not amplified by snow albedo feedback. Nature Scientific Reports 8 (1):9000. doi:https://doi.org/10.1038/s41598-018-27348-7.
- Williamson, S. N., D. S. Hik, J. A. Gamon, A. H. Jarosch, F. S. Anslow, G. Clarke, and S. Rupp. 2017. Spring and summer monthly MODIS LST is inherently biased compared to air temperature in snow covered sub-Arctic mountains. Remote Sens. Remote Sensing of Environment 189:14–24.
- Winski, D., E. F. Osterberg, D. Ferris, K. Kreutz, C. Wake, and S. Campbell. 2017. Industrial-age doubling of snow accumulation in the Alaska Range linked to tropical ocean warming. Nature Scientific Reports 7 (1):17869. doi:https://doi.org/10.1038/s41598-017-18022-5.
- Winstrup, M., A. M. Svensson, S. O. Rasmussen, O. Winther, E. J. Steig, and A. E. Axelrod. 2012. An automated approach for annual layer counting in ice cores. Climate of the Past 8 (6):1881–95. doi:https://doi.org/10.5194/cp-8-1881-2012.
- Winstrup, M., P. Vallelonga, H. A. Kjær, T. J. Fudge, J. E. Lee, M. H. Riis, and R. Edwards, et al. 2019. A 2700-year annual timescale and accumulation history for an ice core from Roosevelt Island, West Antarctica. Climate of the Past 15:751–79. doi:https://doi.org/10.5194/cp-15-751-2019.
- Yalcin, K., C. P. Wake, K. J. Kreutz, M. S. Germani, and S. I. Whitlow. 2007. Ice core paleovolcanic records from the St. Elias Mountains, Yukon, Canada. Journal of Geophysical Research: Atmospheres 112 (D8).
- Yalcin, K., and C. P. Wake. 2001. Anthropogenic signals recorded in an ice core from Eclipse Icefield, Yukon Territory, Canada. Geophysical Research Letters 28 (23):4487–90. doi:https://doi.org/10.1029/2001GL013037.
- Yalcin, K., C. P. Wake, S. Kang, K. J. Kreutz, and S. I. Whitlow. 2006. Seasonal and spatial variability in snow chemistry at Eclipse Icefield, Yukon, Canada. Annals of Glaciology 43:230–38. doi:https://doi.org/10.3189/172756406781811998.
- Yasunari, T. J., T. Shiraiwa, S. Kanamori, Y. Fujii, M. Igarashi, K. Yamazaki, C. S. Benson, and T. Hondoh. 2007. Intra‐annual variations in atmospheric dust and tritium in the North Pacific region detected from an ice core from Mount Wrangell, Alaska. Journal of Geophysical Research 112:D10208. doi:https://doi.org/10.1029/2006JD008121.
- Yde, J. C., and Ø. Paasche. 2010. Reconstructing climate change: Not all glaciers suitable. Eos, Transactions American Geophysical Union 91 (21):189–90. doi:https://doi.org/10.1029/2010EO210001.
- Yde, J. C., and N. T. Knudsen. 2007. 20th-century glacier variations on Disko Island (Qeqertarsuaq) Greenland. Annals of Glaciology 46:209–14. doi:https://doi.org/10.3189/172756407782871558.