
 ?Mathematical formulae have been encoded as MathML and are displayed in this HTML version using MathJax in order to improve their display. Uncheck the box to turn MathJax off. This feature requires Javascript. Click on a formula to zoom.
ABSTRACT
In mountain lakes, water transparency is regulated primarily by materials loaded from the surrounding catchment. Consequently, transparency within a lake can vary over time due to meteorological conditions that affect hydrologic inputs. Furthermore, lake responses to these inputs may depend on catchment characteristics. We examined the relationships between meteorological conditions and interannual variation in transparency over thirteen years in a set of four lakes in Yoho National Park, British Columbia, Canada. We measured mid-summer transparency as the attenuation coefficient of 320 nm and collected meteorological data daily with an automatic weather station located near the study lakes. Despite their close proximity, lakes varied in the strength of associations between transparency and cumulative precipitation across a range of durations. Specifically, transparency in non-glacially fed Lake Hungabee was most strongly correlated with cumulative precipitation in the fifteen days preceding sampling, whereas glacially fed Lakes Opabin and Oesa were most strongly affected by longer periods of cumulative precipitation. Consequently, there was relatively little temporal synchrony in interannual transparency variation among lakes. Our results suggest that both the timing and amount of precipitation as well local hydrology must be considered when predicting effects of climate change on mountain lake ecosystems even within a single region.
Introduction
Water transparency plays a key role in structuring lake ecosystems through effects on thermal regime, photic zone depth, and ultraviolet radiation exposure (reviewed in Williamson et al. Citation2009). The transparency of lakes in human-dominated landscapes is often regulated by phytoplankton blooms caused by nutrient loading from agricultural, industrial, and residential sources (Portielje and Van der Molen Citation1999; Bigham Stephens et al. Citation2015). Though seasonal patterns of transparency in lakes with minimal human impacts can also be influenced by phytoplankton (Laurion et al. Citation2000; Sommaruga and Augustin Citation2006), transparency is determined primarily by materials loaded from the surrounding catchment, including chromophoric dissolved organic matter (CDOM) derived from terrestrial vegetation and suspended inorganic particles (Gallegos, Davies-Colley, and Gall Citation2008; Read and Rose Citation2013; Olson et al. Citation2018). Consequently, transparency can vary among lakes across local and regional scales due to differences in catchment characteristics, particularly topography, extent and composition of vegetation coverage, and the presence of wetlands (Ankers, Walling, and Smith Citation2003; Winn et al. Citation2009; Lottig et al. Citation2014).
Within a given system, transparency can also vary temporally due to meteorological conditions that affect hydrologic inputs (Jassby, Reuter, and Goldman Citation2011; Williamson et al. Citation2014, Citation2016; Rose et al. Citation2017). For example, transparency often decreases after rainfall events that deliver pulses of CDOM and inorganic particles to a lake (Sadro and Melack Citation2012; Perga et al. Citation2018). Conversely, transparency increases between precipitation events as material inputs decrease, photobleaching and bacterial consumption reduce absorbance of resident CDOM, and suspended inorganic particles gradually settle (Yan et al. Citation1996; Reche, Pace, and Cole Citation1999; Mosely Citation2015). At an interannual timescale, fluctuations in the frequency and magnitude of precipitation events can generate longer-term variation in transparency (Fee et al. Citation1996; Pace and Cole Citation2002; Gaiser et al. Citation2009).
Much of our understanding of the temporal dynamics in water transparency is based on low-elevation temperate lakes. These lakes are generally characterized by highly vegetated catchments and annual hydrological inputs dominated by spring and summer precipitation (Kratz et al. Citation1997; LaBaugh et al. Citation1997). However, lakes in mountainous regions differ from these systems in several ways. Catchments of mountain lakes can have much lower vegetation coverage and a high proportion of talus slopes, moraines, and barren rock (Kamenik et al. Citation2001). In addition, hydrologic inputs to these systems are often highest during spring snowmelt and decline as the season progresses (Hood, Roy, and Hayashi Citation2006; Parker, Vinebrooke, and Schindler Citation2008). Finally, some lakes have glaciers in their catchments that can provide significant hydrological inputs to lakes in summer when melting rates are highest (Leeman and Niessen Citation1994; Jost et al. Citation2012). These differences may have important implications for temporal variation in water transparency of mountain lakes.
In this study, we examined interannual variation in water transparency over thirteen years in a set of four lakes in the Canadian Rocky Mountains. These lakes were in close proximity to one another but differed in catchment characteristics, particularly in the extent of vegetation coverage and the presence of glaciers, and in the relative importance of surface and groundwater inputs (Roy and Hayashi Citation2008). We examined transparency of 320 nm because this is an ecologically important wavelength (Williamson Citation1995; Williamson et al. Citation1999) and attenuation rates are highly responsive to both CDOM absorbance and turbidity (Rose et al. Citation2014). Concurrent daily meteorological data collected nearby enabled us to relate variation in transparency among years to precipitation and temperature conditions over a range of intervals prior to sampling each lake. Our objectives were to identify the meteorological factors that affected transparency in each lake and to determine whether transparency varied synchronously among lakes. We expected that transparency in glacially fed lakes in a single region would be regulated by turbidity inputs following snowmelt and extreme events like avalanches and storms. In contrast, we expected transparency in the non-glacially fed lake be affected by summer rain events that deliver fresh CDOM into the lake. Due to these differences in transparency regulation, we did not expect to find a high level of synchrony in transparency among lakes with different catchment types.
Methods
Study sites
Our four study lakes were located in the Lake O’Hara region of Yoho National Park, British Columbia, Canada (). This region is in the Main Range of the Rocky Mountains, on the west side of the Continental Divide. Mountains in this range are composed of primarily of quartzite and quartzose sandstone of the Cambrian Gog Group with carbonate rocks at the summit of most of the peaks (Price et al. Citation1980; Lickorish and Simony Citation1995). Lakes Hungabee, Oesa, and Opabin are all alpine headwater lakes (>2,200 m a.s.l.; ) that feed into subalpine (2,012 m a.s.l.) Lake O’Hara via surface and groundwater inflows. In addition to the three headwater lakes in our study, O’Hara is fed by subalpine Mary Lake and several small tarns located on the Opabin Plateau. The outflow of Lake O’Hara feeds into the Kicking Horse River, a tributary of the Columbia River.
Table 1. Lake morphometry and catchment characteristics of study lakes. Vegetation coverage was calculated from 2009 land cover data with a 30-m resolution from the CSC2000 v database (Center for Topographic Information, Earth Sciences Sector and Natural Resources Canada Citation2009). Glacial coverage was based on the Randolph Glacier Inventory (RGI Consortium Citation2017)
Figure 1. Topographic map of Lake O’Hara catchment showing study lakes and major land cover characteristics. Land cover delineation was based on 2006 aerial photography; current glacial extents are smaller than indicated on the map. Gaps in streams represent reaches of subsurface flow
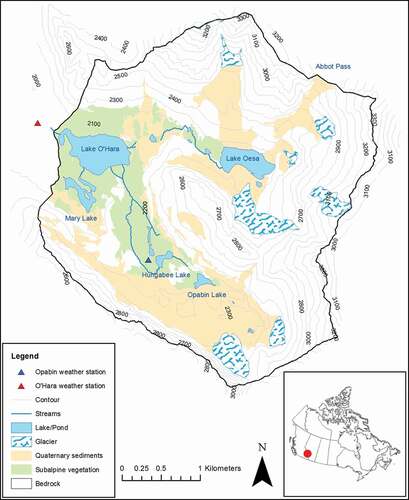
Annual precipitation in the study region typically varies from 1,100 to 1,500 mm, depending on elevation. Much (60–70 percent) of this precipitation comes in the form of snow, which falls between mid-September and mid-June. Consequently, lake catchments are snow-covered for eight months a year and snowmelt typically occurs in late May to early July (Hood and Hayashi Citation2015). The lakes themselves are ice-covered from October to June.
Study lakes differed in morphometry and catchment characteristics (). Hungabee was the shallowest lake and the only one without a glacier in its catchment. Hungabee also had the highest vegetation coverage, consisting of alpine meadows and small stands of larch (Larix lyallii). Oesa and Opabin both had glaciers in their catchments and <5 percent vegetation coverage. As the only lake below treeline, O’Hara’s catchment included extensive coniferous forest and the glaciers that fed Opabin and Oesa.
The hydrology of Opabin, Hungabee, and O’Hara has been characterized in previous studies (Hood, Roy, and Hayashi Citation2006; Roy and Hayashi Citation2008). Briefly, Opabin has no permanent surface inflows and is fed predominately by groundwater from the moraine below Opabin Glacier (). Inflows peak during snowmelt and decline seasonally, with short-term increases during large precipitation events or periods of high temperature that accelerate late-lying snowpack and glacier melt. Opabin has no surface outlet and outflow occurs only through groundwater. Hungabee is fed by surface inflows but also receives considerable (30–40 percent of total influx) groundwater inflow from a vegetated talus slope on the south side of the lake. These flow paths are short, shallow, and thus highly responsive to precipitation events. Despite their close proximity (), Opabin and Hungabee are not hydrologically connected. Groundwater inflows are also significant in Lake O’Hara, often of similar magnitude as surface inflows. Like the other lakes, inflow in O’Hara is highest during June snowmelt and declines seasonally except for short-term increases associated with precipitation events. The hydrology of Oesa has not been characterized, but other than surface runoff it does not have surface inflow. Therefore, the water input is likely dominated by groundwater inflow from the talus on the north side of the lake and the moraine below Oesa glacier.
Transparency measurements
We measured midsummer ultraviolet radiation transparency in each lake annually from 2006 to 2018 (transparency was not measured in O’Hara in 2011). Each year, measurements were taken during a nine-day index period between 25 July and 3 August at midday (between 10:00 a.m. and 2:00 p.m.) from an inflatable boat anchored at or near the deepest part of the lake. We quantified transparency using a cosine-corrected submersible ultraviolet–photosynthetically active radiation radiometer (Biospherical Instruments Inc., San Diego, CA) that was lowered slowly through the water column to the bottom or a depth of 20 m. While being lowered, the radiometer measured downwelling irradiance at 320 nm (measured as the midpoint of an 8- to 10-nm-wide band encompassing >50 percent peak response within the band) and depth at a frequency of approximately 4 Hz. We used the diffuse attenuation coefficient (Kd320 in m−1), estimated as the slope of the log-linear portion of the irradiance vs. depth regression, to represent transparency for each lake-year sample. R2 values for all regressions were >0.95 based on a minimum of 100 measurements.
To evaluate the suitability of analyzing transparency at an interannual scale, we quantified autocorrelation in Kd320 at a one-year lag separately for each lake. Autocorrelation in annual Kd320 values was low for all four study lakes. With a one-year lag, autocorrelation coefficients ranged from −0.20 in Hungabee to 0.04 in Opabin. Box-Ljung tests for all four lakes were not significant (Q < 0.65, p > .40 for all four lakes). Therefore, Kd320 values for a given year were independent of values the following year in all lakes.
Meteorological measurements
Daily measurements of precipitation and mean temperature were collected with an automatic weather station located on the Opabin Plateau approximately 100 m from the shoreline of Hungabee at 2,230 m a.s.l. (; He and Hayashi Citation2019). Air temperature was measured each minute using a Vaisala HMP35 sensor attached to a tripod base and housed within a solar radiation shield to reduce effects of direct sunlight. All measurements for a calendar day were included in the calculation of a daily mean. A tipping bucket rain gauge (Hydrological Services CS700) and a weighing cumulative precipitation gauge (Geonor T200B) for quantifying solid precipitation were used to measure daily precipitation. The tipping bucket gauge was placed on the ground away from the weather station tripod and the weighing gauge was mounted on a freestanding base equipped with a windshield to reduce snow undercatch. Daily precipitation totals were reported to the nearest 0.1 mm.
Analyses
To evaluate associations between meteorological conditions and measurements of water transparency, we divided daily measurements into fifteen-day intervals preceding the day a lake was sampled. Following Williamson et al. (Citation2014), we calculated cumulative precipitation for each fifteen-day interval and then summed consecutive intervals to estimate cumulative precipitation for different durations of time prior to sampling. We also summed positive degree days (PDD: the sum total of daily mean temperatures above 0°C) for the same fifteen-day intervals. We were only able to calculate cumulative precipitation and PDD up to forty-five days prior to sampling each lake in 2018 due to an equipment malfunction that prevented daily precipitation and temperature measurements from 25 March to 13 June 2018.
Because autocorrelation between Kd320 values among years was low (see above), we were justified in correlating annual measures of Kd320 with cumulative precipitation and PDD in the 15, 30, 45, 60, 75, 90, 105, 120, and 135, and 150 days preceding sampling. We did not apply Bonferroni corrections when interpreting the ten correlation coefficients for each lake in part because correlations based on increasing lengths of time are not independent of one another. Therefore, our interpretations focused on how correlation coefficients changed with increasing duration and what duration was associated with the strongest correlation.
Temporal synchrony in Kd320 was estimated for each pair of lakes using Pearson correlations. We also calculated intraclass correlation coefficients (ri) across all four lakes using mean square values calculated in an unreplicated analysis of variance with year and lake as main effects (Zar Citation1996). Positive ri values are interpreted as with pairwise correlation coefficients, where a value of one represents a perfect correlation for all four lakes.
Results
Differences in transparency among lakes
Transparency, as measured by Kd320, varied widely among lakes and among years within lakes (). Hungabee had the highest and most variable Kd320 (SD: 1.54 ± 0.33 m−1), followed by Opabin (0.7 ± 0.27 m−1). Oesa had the lowest mean Kd320 (0.34 ± 0.21 m−1) over the thirteen-year study period, and O’Hara had the lowest interannual variation (0.67 ± 0.10 m−1).
Figure 2. Plot of Kd320 (m−1) vs. time in the four study lakes over thirteen years (2006–2018). Lake O’Hara has no value for 2011
Correlations between water transparency and meteorological measurements
In non-glacially fed Hungabee, annual Kd320 values were positively correlated with cumulative precipitation in the 15 days prior to sampling (, ; r = 0.78, p = .002). This time period started between 10 and 18 July when precipitation would be in the form of rain. However, correlation coefficients decreased in magnitude with increasing durations of cumulative precipitation and were not significant for any duration of 60 days or longer (). In lower elevation O’Hara, correlations between Kd320 and cumulative precipitation were not significant for any duration (). The strongest correlation was between Kd320 and cumulative precipitation in the 120 days preceding sampling but was only marginally significant (r = 0.57, p = .065).
Figure 3. Correlograms for correlation coefficients between Kd320 (m−1) and cumulative precipitation (mm) for increasing periods of time preceding sampling in (a) Lakes Hungabee and O’Hara and (b) Lakes Oesa and Opabin. Correlations were calculated for fifteen-day increments of cumulative precipitation. Coefficients above the solid horizontal lines were significant (p < .05)
Figure 4. Scatterplots of Kd320 (m−1) vs. cumulative precipitation (mm) in (a) Hungabee for the 15 days preceding sampling, (b) Opabin for the 105 days preceding sampling, and (c) Oesa for the 150 days preceding sampling. Each scatterplot represents the strongest correlation observed in each study lake. No scatterplot is presented for O’Hara because no correlations were significant in this lake
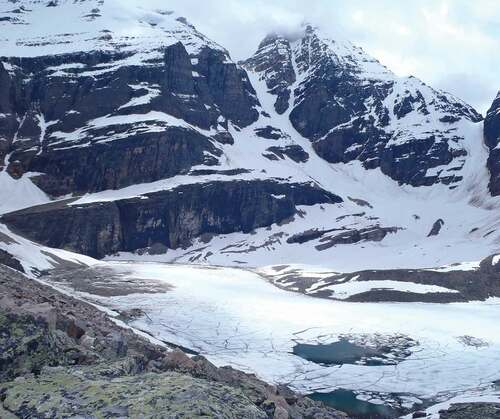
The higher elevation glacially fed lakes, Oesa and Opabin, exhibited similar patterns of increasingly positive correlations as the duration of cumulative precipitation increased (). Correlations were not significant for durations of less than 60 days in either lake (i.e., periods beginning in late May/early June) when precipitation would be rain but became consistently significant for durations of 90 days and longer in Opabin and 105 days and longer in Oesa. Durations of 90 days or longer begin in early May when precipitation would be in the form of snow. The strongest correlation in Opabin was observed for a duration of 105 days prior to sampling (; r = 0.77, p = .004) and the strongest correlation in Oesa was observed for a 150-day duration (; r = 0.84, p = .001). The significant correlations in Oesa were driven primarily by values for 2012 when an avalanche from Abbott Pass on the southeast shore of Oesa deposited large quantities of mineral debris on the ice surface (). If 2012 is removed from analyses, correlations with Kd320 are not significant for all durations of cumulative precipitation (|r| < 0.54, p > .05 for all intervals).
Figure 5. Photo of Lake Oesa on 2 July 2012 showing avalanche debris on ice surface below Abbott Pass. Photo was taken by MHO
In contrast to precipitation, we observed no significant correlations between Kd320 and PDD for any duration in any of the four study lakes. All correlations had absolute magnitudes <0.50 and p > .10.
Temporal synchrony in transparency
Among lakes, there was relatively little temporal synchrony in annual measurements of Kd320. All four lakes were simultaneously either above or below their respective thirteen-year means in only four years. In addition, intraclass correlation ri was only 0.23, indicating little synchrony in Kd320 across the four lakes over the time series. Pairwise correlation coefficients between non-glacially fed Hungabee and the glacially fed lakes Oesa, Opabin, and O’Hara were 0.04, 0.12, and 0.14, respectively (p > .50 in each case). The two high-elevation glacially fed lakes Oesa and Opabin were positively correlated (r = 0.61, p = .027), although this result became nonsignificant when values for 2012 were removed from analysis (r = 0.52, p = .078). Opabin and O’Hara were also weakly correlated (r = 0.58, p = .049), whereas Oesa and O’Hara were not (r = 0.27, p = .39).
Discussion
Our results highlight the idiosyncratic nature of relationships between meteorological drivers and water transparency in mountain lakes and point to catchment characteristics and hydrology as factors that mediate these relationships. Despite their close proximity, our four study lakes varied in both the timescale and strength of correlations between water transparency and meteorological measurements. Specifically, transparency in non-glacially fed Hungabee was most strongly correlated with cumulative precipitation in the fifteen days preceding our mid-summer sample, which corresponds to recent precipitation in the form of rain. In contrast, transparency in the glacially fed lakes at higher elevation (Oesa and Opabin) was most strongly correlated with much longer periods of cumulative precipitation that would include significant precipitation in the form of snow, and O’Hara’s transparency was not correlated with precipitation for any time period. Consequently, synchrony in transparency was relatively low for over the thirteen-year duration of this study. Annual measures of UV320 attenuation were positively correlated in Lakes Oesa and Opabin, but that pattern was largely driven by a single year, 2012). O’Hara was weakly correlated with Opabin but not Hungabee or Oesa, despite receiving inflows from all three headwater lakes, and transparency in Hungabee varied independently of the other lakes.
The low synchrony between Hungabee and the other study lakes was likely related to differences in the primary regulator of transparency. Unlike Opabin, Oesa, and O’Hara, which are regulated by inputs of glacial flour, transparency in Hungabee is regulated by CDOM (Olson et al. Citation2018). CDOM, which is derived from terrestrial vegetation, absorbs incoming solar radiation as a decreasing function of wavelength (Williamson et al. Citation1996; Rae et al. Citation2001). Specific absorbance is highest when CDOM is first loaded into lakes and quickly decreases due to bacterial uptake and photobleaching (Morris and Hargreaves Citation1997; Osborn et al. Citation2001). Hence, mid-summer transparency in Hungabee would be most strongly influenced by recent precipitation, and earlier inputs of CDOM would have relatively little effect. This pattern is reflected in the decreasing strength of correlations between transparency and increasing durations of cumulative precipitation.
The influence of late winter and early spring precipitation on midsummer transparency can also be affected by hydrologic features such as flow path length and hydrological residence time (HRT). The short and shallow flow paths for hydrologic inputs to Hungabee likely contributed to the high responsiveness of the system to recent precipitation events. To discern the roles of transparency regulation and hydrological features, future studies could compare the associations between meteorological conditions and measurements of water transparency in a broader suite of CDOM-regulated lakes that vary in flow path length. Additionally, lakes with shorter HRTs have higher export rates of terrestrially derived carbon (Hanson et al. Citation2011; Zwart et al. Citation2017), which would minimize the effect of early season precipitation events. However, Hungabee was the only lake to be affected by recent precipitation, even though nominal HRTs calculated from lake volumes and rough estimates of through-flow rates were on the order of thirty days for both Hungabee and Opabin. Therefore, the effect of HRT on transparency was likely much smaller than differences in the primary regulator of transparency.
Interannual variation in transparency in Opabin was most strongly correlated with cumulative precipitation in the 105 days preceding sampling and was also significant for longer durations. This window of time extends to mid-March and earlier and includes a substantial period of time during which precipitation would be in the form of snow. On the Opabin Plateau, snow accumulation peaks in early May and snowmelt is typically completed by early July with the exception of late-lying snowpacks (He and Hayashi Citation2019). As snowmelt flows into Opabin via seasonal freshets and groundwater inputs, glacial flour would be loaded from the surrounding moraine. This glacial flour can remain suspended in the epilimnion for extended periods of time by overflows above the hypolimnion (Smith Citation1978; Weirich Citation1986; Chanudet and Filella Citation2008). Because the nominal HRT for Opabin was on the order of thirty days, a substantial proportion of this material would likely be present at the time of our annual transparency measurement. Therefore, our results suggest that snowmelt is an important driver of mid-summer transparency in Opabin. Conversely, the lack of a correlation with recent precipitation suggests that summer rainfall had only minimal influence on transparency. Perga et al. (Citation2018) also found that most summer precipitation events did not affect turbidity of alpine Lake Muzelle in France. Rather, only storms that were preceded by hot and dry spells resulted in significant mobilization of glacial flour from land to lake.
An additional factor that could enhance the effect of winter precipitation and reduce the effect of recent precipitation on Opabin’s mid-summer transparency is groundwater storage. Langston et al. (Citation2011) found that the majority of groundwater inflow to Opabin came from a deep flow path at the moraine–bedrock boundary. Therefore, most of the groundwater was sourced from snow and glacier melt and lake level changes in response to summer precipitation events were often undetectable. Because of this long lag between precipitation and groundwater input, winter precipitation and subsequent snowmelt play a larger role in summer hydrologic inputs that affect turbidity and thus transparency compared to summer precipitation events.
Lake Oesa was similar to Opabin in that transparency was most strongly correlated with long windows of cumulative precipitation, which suggests that snowmelt is the dominant hydrologic force driving transparency. However, the significant correlations in Oesa were entirely dependent on a single year (2012) when an avalanche deposited a large quantity of rock and glacial flour on the ice. Avalanches are capable of transporting products of glacial abrasion in steep alpine catchments, particularly when snow is wet (Moore et al. Citation2013). In 2012, 95 mm of precipitation fell in the form of snow on June 5–6 when mean air temperatures were just above 0°C. This observation, coupled with photographic evidence from 2 July (), suggests that this late season storm triggered a wet snow avalanche that entrained the underlying talus slope below Abbott Pass (). In the other twelve years of our study, Kd320 values in Oesa were low, stable, and unrelated to any duration of cumulative precipitation. The high transparency in this lake reflects minimal inputs of CDOM from a catchment that has very little vegetation coverage and a small proglacial lake between the lake and Oesa Glacier that acts as a settling pond for glacial flour (Olson et al. Citation2018). Consequently, inputs of transparency-regulating materials in the absence of a large-scale event are likely to be low for this lake.
In contrast to the other study lakes, transparency in Lake O’Hara was unrelated to any meteorological measure. This lake receives water from multiple sources, including the other three study lakes and subalpine Mary Lake as well as considerable groundwater inflow. Furthermore, the catchment has substantial forest coverage as well as the glaciers that feed into Opabin and Oesa (Hood, Roy, and Hayashi Citation2006). Consequently, O’Hara receives both CDOM and glacial flour, and this combination of transparency-regulating material inputs could complicate the relationship between precipitation and transparency. For example, fresh CDOM inputs from recent rainfall events could obscure the effects of spring snowmelt that delivered glacial flour earlier in the year and vice versa. The end result may be a relatively constant transparency and little effect of precipitation, at least at an interannual timescale.
Across the four study lakes, we found that transparency varied in association with precipitation in two lakes (Hungabee and Opabin), whereas the other two lakes (Oesa and O’Hara) were less responsive. This variation among lakes suggests that catchment characteristics may influence not only the timing but also the strength of precipitation–transparency relations. These relations may be stronger in lakes that are directly connected to a single source of transparency-regulating materials (i.e., terrestrial vegetation in Hungabee and a glacial moraine in Opabin). In contrast, lakes that are connected to multiple sources of these materials or lakes that are connected to catchment sources via lower order lakes higher in the landscape (Martin and Sorrano Citation2006) may have only weak relationships between precipitation and transparency. For these lakes, a large-scale event such as an avalanche or major storm may be necessary to cause a change in transparency.
Temperature can potentially affect transparency by modifying the timing of snowmelt as well as rates of decomposition and thus availability of CDOM (Andersson and Nilsson Citation2001). In our study lakes, however, spring and summer temperatures did not strongly influence water transparency. Correlations between transparency and PDD were not significant for any lake across all time intervals examined. Temperature can also affect the timing and amount of glacial meltwater flowing into lakes, which could potentially affect turbidity (Xie et al. Citation2006; Slemmons, Saros, and Simon Citation2013). Indeed, Hannes and Sommaruga (Citation2017) reported short-term and seasonal increases in turbidity in a set of glacially fed lakes that corresponded to changes in temperature. Although Opabin and Oesa are both fed by glaciers through groundwater inputs, the extent of glacial coverage is relatively small in both catchments (). Consequently, stream inflows peak in June and early July during snowmelt and then decline in the summer (Hood and Hayashi Citation2015). As a result, stream discharge rates in the region are more strongly related to total and winter precipitation levels than to temperature (He and Hayashi Citation2019).
Mountain ecosystems are being disproportionately affected by climate change (Beniston Citation2006; Vinebrooke et al. Citation2010; Rogora et al. Citation2018). Our results suggest that altered precipitation regimes have the potential to influence mountain lakes that have strong connections to sources of transparency-regulating materials in their catchment. Over longer timescales, mountain lakes will also be impacted by climate-mediated glacial loss and treeline advance. By 2100, few glaciers are predicted to remain in the central Rockies ecosystem, with overall reductions of total glacier volume projected at 70 percent (Clarke et al. Citation2015). As glaciers ablate, material inputs to lakes can shift over time from proglacial clastic sediments to organic matter (Wolfe et al. Citation2013), with the timing of this transition being more abrupt in lakes with direct inputs from glacier melt compared to groundwater flow paths through glacial moraines (Sommaruga Citation2015). Consequently, the primary regulator of transparency in some mountain lakes will likely switch from glacial flour to CDOM (Olson et al. Citation2018). This change may also lead to a shift in the meteorological driver of transparency from winter to summer precipitation. Consequently, both the timing and amount of precipitation must be considered when predicting effects of climate change on mountain lake ecosystems.
Acknowledgments
We thank Danae Diaz, Jennifer Everhart, Ruby Fries, Luke Groff, Jin Hwang, Colleen Lawlor, Molly Lowell, Jeremy Mack, Eila Miller, Ariek Norford, Rachel Olson, Trevor Olson, Haley Plante, Rebhi Rabah, Eliana Rabinowitz, Kevin Rose, Shelby Sawyer, and Nora Theodore for field assistance over the past 13 years. We also acknowledge students and field technicians from the University of Calgary, too numerous to name, who have helped maintain the weather station and Jesse He for preparing . We thank the Parks Canada Agency for their permission to conduct research in the national mountain parks of Canada and Lake O’Hara Lodge for logistical support.
Disclosure statement
The authors have no potential conflict of interest.
Additional information
Funding
References
- Andersson, S., and S. I. Nilsson. 2001. Influence of pH and temperature on microbial activity, substrate availability of soil-solution bacteria and leaching of dissolved organic carbon in a mor humus. Soil Biology and Biochemistry 33 (9):1181–91. doi:https://doi.org/10.1016/S0038-0717(01)00022-0.
- Ankers, C., D. E. Walling, and R. P. Smith. 2003. The influence of catchment characteristics on suspended sediment properties. Hydrobiologia 494 (1–3):159–67. doi:https://doi.org/10.1023/A:1025458114068.
- Beniston, M. 2006. Mountain weather and climate: a general overview and a focus on climatic change in the Alps. Hydrobiologia 562: 3–16. doi:https://doi.org/10.1007/s10750-005-1802-0.
- Bigham Stephens, D. L., R. E. Carlson, C. A. Horsburgh, M. V. Hoyer, R. W. Bachman, and R. E. Canfield Jr. 2015. Regional distribution of Secchi disk transparency in waters of the United States. Lake and Reservoir Management 31 (1):55–63. doi:https://doi.org/10.1080/10402381.2014.1001539.
- Center for Topographic Information, Earth Sciences Sector and Natural Resources Canada. 2009. Land cover, circa 2000-vector: Feature catalogue, edition 1.0. Geobase, http://www.geobase.ca/geobase/en/data/landcover/csc2000v/description.htm.
- Chanudet, V., and M. Filella. 2008. Size and composition of inorganic colloids in a peri-alpine, glacial flour-rich lake. Geochimica et Cosmochimica Acta 72 (5):1466–79. doi:https://doi.org/10.1016/j.gca.2008.01.002.
- Clarke, G. K. C., A. H. Jarosch, F. A. Anslow, V. Radic, and B. Menounos. 2015. Projected deglaciation of western Canada in the twenty-first century. Nature Geosciences 8 (5):372–77. doi:https://doi.org/10.1038/ngeo2407.
- Fee, E. J., R. E. Hecky, S. E. M. Kasian, and D. R. Cruikshank. 1996. Effects of lake size, water clarity, and climatic variability on mixing depths in Canadian Shield lakes. Limnology and Oceanography 41 (5):912–20. doi:https://doi.org/10.4319/lo.1996.41.j5.0912.
- Gaiser, E. E., N. D. Deyrup, R. W. Bachmann, L. W. Battoe, and H. M. Swain. 2009. Multidecadal climate oscillations detected in a transparency record from a subtropical Florida Lake. Limnology and Oceanography 54 (6):2228–32. doi:https://doi.org/10.4319/lo.2009.54.6.2228.
- Gallegos, C. L., R. J. Davies-Colley, and M. Gall. 2008. Optical closure in lakes with contrasting extremes of reflectance. Limnology and Oceanography 53 (5):2021–34. doi:https://doi.org/10.4319/lo.2008.53.5.2021.
- Hannes, P., and R. Sommaruga. 2017. Alpine glacier-fed turbid lakes are discontinuous cold polymictic rather than dimictic. Inland Waters 7 (1):45–54. doi:https://doi.org/10.1080/20442041.2017.1294346.
- Hanson, P. C., D. P. Hamilton, E. H. Stanley, N. Preston, O. C. Langman, and E. L. Kara. 2011. Fate of allochthonous dissolved organic carbon in lakes: A quantitative approach. PLoS ONE 6 (7):e21884. doi:https://doi.org/10.1371/journal.pone.021884.
- He, J., and M. Hayashi. 2019. Lake O’Hara alpine hydrological observatory: Hydrological and meteorological dataset, 2004–2017. Earth System Science Data 11 (1):111–17. doi:https://doi.org/10.5194/essd-11-111-2019.
- Hood, J. L., J. W. Roy, and M. Hayashi. 2006. Importance of groundwater in the water balance of an alpine headwater lake. Geophysical Research Letters 33 (13):L13405. doi:https://doi.org/10.1029/2006GL026611.
- Hood, J. L., and M. Hayashi. 2015. Characterization of snowmelt flux and groundwater storage in an alpine headwater basin. Journal of Hydrology 521:482–97. doi:https://doi.org/10.1016/j.jhydrol.2014.12.041.
- Jassby, A. D., J. E. Reuter, and C. R. Goldman. 2011. determining long-term water quality change in the presence of climate variability: Lake Tahoe (U.S.A.). Canadian Journal of Fisheries and Aquatic Sciences 60 (12):1452–61. doi:https://doi.org/10.1139/f03-127.
- Jost, G., R. D. Moore, B. Menounos, and R. Wheate. 2012. Quantifying the contribution of glacier runoff to streamflow in the upper Columbia River Basin, Canada. Hydrology and Earth System Sciences 16 (3):849–60. doi:https://doi.org/10.5194/hess-16-849-2012.
- Kamenik, C., R. Schmidt, G. Kum, and R. Psenner. 2001. The influence of catchment characteristics on the water quality of mountain lakes. Arctic, Antarctic, and Alpine Research 33 (4):404–09. doi:https://doi.org/10.1080/15230430.2001.12003448.
- Kratz, T. K., K. E. Webster, C. J. Bowser, J. J. Magunson, and B. J. Benson. 1997. The influence of landscape position on lakes in northern Wisconsin. Freshwater Biology 37 (1):209–17. doi:https://doi.org/10.1046/j.1365-2427.1997.00149.x.
- LaBaugh, J. W., T. C. Winter, D. O. Rosenberry, P. F. Schuster, M. M. Reddy, and G. R. Aiken. 1997. Hydrological and chemical estimates of the water balance of a closed-basin lake in north central Minnesota. Water Resources Research 33 (12):2799–812. doi:https://doi.org/10.1029/97WR02427.
- Langston, G., L. R. Bentley, M. Hayashi, A. McClymont, and A. Pidlisecky. 2011. Internal structure and hydrological functions of an alpine proglacial moraine. Hydrological Processes 25:2967–82.
- Laurion, I., M. Ventura, J. Catalan, R. Psenner, R. Sommaruga, N. Sep, and I. Latirion. 2000. Attenuation of ultraviolet radiation in mountain lakes: Factors controlling the among- and within-lake variability. Limnology and Oceanography 45 (6):1274–88. doi:https://doi.org/10.4319/lo.2000.45.6.1274.
- Leeman, A., and F. Niessen. 1994. Varve formation and the climatic record in an Alpine proglacial lake: Calibrating annually- laminated sediments against hydrological and meteorological data. The Holocene 4 (1):1–8. doi:https://doi.org/10.1177/095968369400400101.
- Lickorish, W. H., and P. S. Simony. 1995. Evidence for late rifting of the Cordilleran margin outlined by stratigraphic division of the Lower Cambrian Gog Group, Rocky Mountain Main Ranges, British Columbia and Alberta. Canadian Journal of Earth Sciences 32 (7):860–74. doi:https://doi.org/10.1139/e95-072.
- Lottig, N. R., T. Wagner, E. N. Henry, K. Spence Cheruvelil, K. E. Webster, J. A. Downing, and C. A. Stow. 2014. Long-term citizen-collected data reveal geographical patterns and temporal trends in lake water clarity. PLoS ONE 9 (4):e95769. doi:https://doi.org/10.1371/journal.pone.0095769.
- Martin, S. L., and P. A. Sorrano. 2006. Lake landscape position: Relationships to hydrologic connectivity and landscape features. Limnology and Oceanography 51 (2):801–14. doi:https://doi.org/10.4319/lo.2006.51.2.0801.
- Moore, J. R., J. Egloff, J. Nagelisen, M. Hunziker, U. Aerne, and M. Christen. 2013. Sediment transport and bedrock erosion by wet snow avalanches in the Guggigraben, Matter Valley, Switzerland. Arctic, Antarctic, and Alpine Research 45 (3):350–62. doi:https://doi.org/10.1657/1938-4246-45.3.350.
- Morris, D. P., and B. R. Hargreaves. 1997. The role of photochemical degradation of dissolved organic carbon in regulating UV transparency of three lakes on the Pocono Plateau. Limnology and Oceanography 42 (2):239–49. doi:https://doi.org/10.4319/lo.1997.42.2.0239.
- Mosely, L. M. 2015. Drought impacts on the water quality of freshwater systems: A review and integration. Earth-Science Reviews 140:203–34. doi:https://doi.org/10.1016/j.earscirev.2014.11.010.
- Olson, M. H., J. M. Fischer, C. E. Williamson, E. P. Overholt, and N. Theodore. 2018. Landscape-scale regulators of water transparency in mountain lakes: Implications of projected glacial loss. Canadian Journal of Fisheries and Aquatic Sciences 75 (7):1169–76. doi:https://doi.org/10.1139/cjfas-2017-0215.
- Osborn, C. L., D. P. Morris, K. A. Thorn, and R. E. Moeller. 2001. Chemical and optical changes in freshwater dissolved organic matter exposed to solar radiation. Biogeochemistry 54 (3):251–78. doi:https://doi.org/10.1023/A:1010657428418.
- Pace, M. L., and J. J. Cole. 2002. Synchronous variation of dissolved organic carbon and color in lakes. Limnology and Oceanography 47 (2):333–42. doi:https://doi.org/10.4319/lo.2002.47.2.0333.
- Parker, B. R., R. D. Vinebrooke, and D. W. Schindler. 2008. Recent climate extremes alter alpine lake ecosystems. Proceedings of the National Academy of Sciences 105 (35):12927–31. doi:https://doi.org/10.1073/pnas.0806481105.
- Perga, M.-E., R. Bruel, L. Rodrigue, Y. Guenand, and D. Bouffard. 2018. Storm impacts on alpine lakes: Antecedent weather conditions matter more than the event intensity. Global Change Biology 24 (10):5004–16. doi:https://doi.org/10.1111/gcb.14384.
- Portielje, R., and D. T. Van der Molen. 1999. Relationship between eutrophication variables: From nutrient loading to transparency. Hydrobiologia 408/409:375–87. doi:https://doi.org/10.1023/A:1017090931476.
- Price, R. A., D. G. Cook, J. D. Aitken, and E. W. Mountjoy. 1980. Geology, Lake Louise, Alberta and British Columbia, Map 1483A, Scale 1:50 000. Ottawa: Geological Survey of Canada.
- Rae, R., C. Howard-Williams, I. Hawes, A. M. Schwarz, and W. F. Vincent. 2001. Penetration of solar ultraviolet radiation into New Zealand lakes: Influence of dissolved organic carbon and catchment vegetation. Limnology 2 (2):79–89. doi:https://doi.org/10.1007/s102010170003.
- Read, J. S., and K. R. Rose. 2013. Physical responses of small temperate lakes to variation in dissolved organic carbon concentrations. Limnology and Oceanography 58 (3):921–31. doi:https://doi.org/10.4319/lo.2013.58.3.0921.
- Reche, I., M. L. Pace, and J. J. Cole. 1999. Relationship of trophic and chemical conditions to photobleaching of dissolved organic matter in lake ecosystems. Biogeochemistry 44 (3):259–80. doi:https://doi.org/10.1007/BF00996993.
- RGI Consortium. 2017. Randolph Glacier Inventory–Global Land Ice Measurements from Space, Colorado, USA. Digital Media. doi:https://doi.org/10.7265/N5-RGI-60.
- Rogora, M., L. Frate, M. Carranza, M. Freppaz, A. Stanisci, I. Bertani, R. Bottarin, A. Brambilla, R. Canullo, M. Carbognani, et al. 2018. Assessment of climate change effects on mountain ecosystems through a cross-site analysis in the Alps and Apennines. Science of the Total Environment 624:1429–42. doi:https://doi.org/10.1016/j.scitotenv.2017.12.155.
- Rose, K. C., D. P. Hamilton, C. E. Williamson, C. G. McBride, J. M. Fischer, M. H. Olson, J. E. Saros, M. G. Allan, and N. Cabrol. 2014. Light attenuation characteristics of glacially-fed lakes. Journal of Geophysical Research: Biogeosciences 119. doi:https://doi.org/10.1002/2014JG002674.
- Rose, K. C., S. R. Greb, M. Diebel, and M. G. Turner. 2017. Annual precipitation regulates spatial and temporal drivers of lake water clarity. Ecological Applications 27 (2):632–43. doi:https://doi.org/10.1002/eap.1471.
- Roy, J. W., and M. Hayashi. 2008. Groundwater exchange with two small alpine lakes in the Canadian Rockies. Hydrological Processes 22 (15):2838–46. doi:https://doi.org/10.1002/hyp.6995.
- Sadro, S., and J. M. Melack. 2012. The effect of an extreme rain event on the biogeochemistry and ecosystem metabolism of an oligotrophic high-elevation lake. Arctic, Antarctic, and Alpine Research 44 (2):222–31. doi:https://doi.org/10.1657/1938-4246-44.2.222.
- Slemmons, K. E. H., J. E. Saros, and K. Simon. 2013. The influence of glacial meltwater on alpine aquatic ecosystems: A review. Environmental Science Processes and Impacts 15 (10):1794–806. doi:https://doi.org/10.1039/c3em00243h.
- Smith, N. D. 1978. Sedimentation processes and patterns in a glacier-fed lake with low sediment input. Canadian Journal of Earth Sciences 15 (5):741–56. doi:https://doi.org/10.1139/e78-081.
- Sommaruga, R. 2015. When glaciers and ice sheets melt: Consequences for planktonic organisms. Journal of Plankton Research 37 (3):509–18. doi:https://doi.org/10.1093/plankt/fbv027.
- Sommaruga, R., and G. Augustin. 2006. Seasonality in UV transparency of an alpine lake is associated to changes in phytoplankton biomass. Aquatic Sciences 68 (2):129–41. doi:https://doi.org/10.1007/s00027-006-0836-3.
- Vinebrooke, R. D., P. L. Thompson, W. Hobbs, W. B. H. Luckman, M. D. Graham, and A. P. Wolfe. 2010. Glacially mediated impacts of climate warming on alpine lakes of the Canadian Rocky Mountains. Verhandlungen des Internationalen Verein Limnologie 30:1449–52.
- Weirich, F. H. 1986. A study of the nature and incidence of density currents in a shallow glacial lake. Annals of the Association of American Geographers 76 (3):396–413. doi:https://doi.org/10.1111/j.1467-8306.1986.tb00127.x.
- Williamson, C. E. 1995. What role does UV-B radiation play in freshwater ecosystems? Limnology and Oceanography 40: 386–392.
- Williamson, C. E., D. P. Morris, M. L. Pace, and O. G. Olson. 1999. Dissolved organic carbon and nutrients as regulators of lake ecosystems: Resurrection of a more integrated paradigm. Limnology and Oceanography 44 (3part2):795–803. doi:https://doi.org/10.4319/lo.1999.44.3_part_2.0795.
- Williamson, C. E., E. P. Overholt, J. A. Brentrup, R. M. Pilla, T. H. Leach, S. G. Schladow, J. D. Warren, S. S. Urmy, S. Sadro, S. Chandra, and P. J. Neale. 2016. Sentinel responses to droughts, wildfires, and floods: Effects of UV radiation on lakes and their ecosystem services. Frontiers in Ecology and the Environment 14: 102–109. doi:https://doi.org/10.1002/fee.1228.
- Williamson, C. E., J. A. Brentrup, J. Zhang, W. H. Renwick, B. R. Hargreaves, L. B. Knoll, E. P. Overholt, and K. C. Rose. 2014. Lakes as sensors in the landscape: Optical metrics as scalable sentinel responses to climate change. Limnology and Oceanography 59 (3):840–50. doi:https://doi.org/10.4319/lo.2014.59.3.0840.
- Williamson, C. E., J. E. Saros, W. F. Vincent, and J. P. Smol. 2009. Lakes and reservoirs as sentinels, integrators, and regulators of climate change. Limnology and Oceanography 54 (6part2):2273–82. doi:https://doi.org/10.4319/lo.2009.54.6_part_2.2273.
- Williamson, C. E., R. S. Stemberger, D. P. Morris, T. M. Frost, and S. Paulsen. 1996. Ultraviolet radiation in North American lakes: Attenuation estimates from DOC measurements and implications for plankton communities. Limnology and Oceanography 41 (5):1024–34. doi:https://doi.org/10.4319/lo.1996.41.5.1024.
- Winn, N., C. E. Williamson, R. Abbitt, K. Rose, W. Renwick, M. Henry, and J. Saros. 2009. Modeling dissolved organic carbon in subalpine and alpine lakes with GIS and remote sensing. Landscape Ecology 24 (6):807–16. doi:https://doi.org/10.1007/s10980-009-9359-3.
- Wolfe, A. P., W. O. Hobbs, H. H. Birks, J. P. Briner, S. U. Holmgren, Ó. Ingólfsson, S. S. Kaushal, G. H. Miller, M. Pagani, J. E. Saros, et al. 2013. Stratigraphic expressions of the Holocene-Anthropocene transition revealed in sediments from remote lakes. Earth-Science Reviews 116:17–34. doi:https://doi.org/10.1016/j.earscirev.2012.11.001.
- Xie, C., Y. Ding, S. Liu, and C. Chen. 2006. Response of meltwater runoff to air-temperature fluctuations on Keqikaer glacier, south slope of Tuomuer mountain, western China. Annals of Glaciology 43:275–79. doi:https://doi.org/10.3189/172756406781812294.
- Yan, N. D., W. Keller, N. M. Scully, D. R. S. Lean, and P. J. Dillon. 1996. Increased UV-B penetration in a lake owing to drought-induced acidification. Nature 381 (6578):141–43. doi:https://doi.org/10.1038/381141a0.
- Zar, J. H. 1996. Biostatistical Analyses. Upper Saddle River, NJ: Prentice Hall.
- Zwart, J. A., S. D. Sebastyen, C. T. Solomon, and S. E. Jones. 2017. The influence of hydrologic residence time on lake carbon cycling dynamics following extreme precipitation events. Ecosystems 20 (5):1000–14. doi:https://doi.org/10.1007/s10021-016-0088-6.