
 ?Mathematical formulae have been encoded as MathML and are displayed in this HTML version using MathJax in order to improve their display. Uncheck the box to turn MathJax off. This feature requires Javascript. Click on a formula to zoom.
ABSTRACT
Habitat connectivity supports life history requirements of many arctic fish species during periods of flowing water. However, aquatic habitat connectivity is susceptible to change due to climate factors and land use, particularly in the 4,600 km2 Fish Creek Watershed (FCW) located in National Petroleum Reserve in Alaska. Varying degrees and mechanisms of connectivity between overwintering habitat and summer foraging habitat motivated us to assess and classify aquatic habitat connectivity to help inform management. Using geospatial analysis and field methods we classified processes affecting connectivity within riparian corridors and upstream channels. Results show the dominant geomorphic process affecting connectivity varied among river systems, providing general and catchment-specific guidance as to the distribution of important migratory fish habitat. Barriers to fish passage caused by subsurface flow were more common along river corridors with high channel migration rates, whereas wetland flowthrough was the most common barrier in upstream catchments throughout the FCW. Coupling both riparian and catchment connectivity showed that 28 percent of catchments were classified as having fish-passable connectivity, indicated by no barriers present in the riparian zone or upstream channels. Future work should evaluate how well this classification predicts fish habitat, is useful to resource management, and is applicable to other arctic watersheds.
Introduction
Habitat connectivity is increasingly recognized as a critical element of landscapes and watersheds (Wiens Citation2002). Particularly with respect to fish, understanding how movement among habitats (i.e., lakes, streams, rivers, estuaries, and the sea) and where, when, and why movement becomes restricted is highly informative to management (Fullerton et al. Citation2010). Many watersheds of the Arctic Coastal Plain (ACP) provide habitat to numerous migratory fish species (Whitman et al. Citation2011), and this very low-gradient, lake-rich permafrost terrain coupled with short flowing-water seasons makes understanding habitat connectivity even more relevant (Arp, Whitman, Jones, et al. Citation2019).
On the ACP, lakes, streams, and rivers form drainage networks that continue to evolve in a dynamic continuous permafrost landscape where open-water conditions typically last only three to four months. This short period commonly begins with snowmelt peak flows that decline rapidly with shrinking surface water extents in lakes and wetlands through the summer until freeze-up (Bowling et al. Citation2003). Thus, most migratory fishes have a very short and dynamic period to move among feeding, spawning, and overwintering habitats (Heim et al. Citation2016). Well-connected catchments (defined as small drainage areas typically ranging from 5 to 100 km2 and fed by lakes and streams above river channel riparian zones) are integral to fish species that rely on tundra lakes for summer foraging habitat and downstream river channels for overwintering habitat (Haynes et al. Citation2014; Heim et al. Citation2016; Arp, Whitman, Jones, et al. Citation2019). Given that several modes of disconnectivity or barriers to passage can deter or prevent fish from using particular catchments, classifying catchments by connectivity can provide an indication of habitat quality and potentially fish abundance for individual catchments adjoining rivers throughout larger watersheds. Fish habitat quality and suitability for particular fish species of interest should be considered in land use management in watersheds where petroleum exploration and development is expanding across arctic landscapes (Arp, Whitman, Jones, et al. Citation2019). More specifically, providing National Petroleum Reserve–Alaska (NPR-A) resource managers with spatially explicit information allows justifiable recommendations for routing of roads and pipelines and location of drilling pads and water supply lakes to protect important habitat.
The definition of “connectivity” differs across and within different disciplines of physical and ecological science (Pringle Citation2003). In hydrology, there are a plethora of definitions for connectivity ranging from river connectivity to watershed connectivity that separate lateral, longitudinal, and vertical extents and consider varying temporal and spatial scales (Wohl Citation2017). Many connectivity studies cited by Wohl (Citation2017) mention the transfer of matter from one location to another, some concerning sediments and organic matter and others specifically pointing to aquatic organisms. Studies concerning hydrologic connectivity in the Arctic have looked at surface and subsurface interactions (Spence and Phillips Citation2015), permafrost (Connon et al. Citation2014), beaded streams (Merck et al. Citation2012; Arp et al. Citation2015), and river-to-lake connection times (Lesack and Marsh Citation2007, Citation2010). Many of these studies mention the effect of hydrologic connectivity on biological movement or migration, particularly with respect to fish. Connectivity relevant to aquatic organisms often points to the importance of hydrologic flow paths and how they allow or prevent movement of organisms. The relationship between connectivity and fish in the Arctic and how it affects population dynamics and timing of migration has emerged as an important research topic at the catchment scale (Heim et al. Citation2016, Citation2019) and landscape scale (Haynes et al. Citation2014; Laske et al. Citation2016, Citation2019). Long-term studies of lakes in the Mackenzie River Delta demonstrate the dominant role connectivity plays in not only biological diversity but also water renewal times and habitat productivity (Lesack and Marsh Citation2010).
Our view of catchment connectivity most relevant to fish movement and migration involves the combination of geomorphic and hydrologic processes specifically within the riparian zones of stream–river junctions and the catchments upstream. Waterfalls, knickpoints, or steep rapids are classic examples of geomorphic barriers to fish passage. Low-gradient reaches where flow becomes diffuse and unchannelized due to thick vegetation growth or porous substrates may also present barriers to fish migration, particularly during low-flow conditions. Larger-scale geomorphic processes such as channel migration and lake drainage can play an important role in the distribution of these finer geomorphic barriers within drainage networks. Flow variation due to contributing area (i.e., watershed size) and seasonal conditions present the commonly viewed controls on hydrologic connectivity in streams. In ACP watersheds, rapid changes in flow that occur from peak snowmelt to mid-summer conditions, when evapotranspiration often exceeds precipitation, are well-recognized factors in habitat connectivity (Bowling et al. Citation2003; Arp, Jones, et al. 2012). Jones et al. (Citation2017) assigned one of three hydrologic connectivity classifications—perennial, intermittent, and isolated—to lakes in the Fish Creek Watershed (FCW) according to underlying sediment type and size of the contributing area. These hydrologic connectivity classifications reveal the potential magnitude to which a hydrologic barrier is present during the dry mid-summer season. The interaction between geomorphic and hydrologic connectivity is conceptually understood but less frequently integrated into understanding of aquatic habitat availability in arctic watersheds.
Aquatic habitat connectivity in ACP watersheds is expected to respond to changes in climate due to permafrost degradation and hydrologic intensification, the latter of which may result in both expanded and contracted connectivity with increased hydrologic variability, already being observed (Stuefer et al. Citation2017; Arp, Whitman, Jones, et al. Citation2019). In addition to climate change responses, the ACP is experiencing expanded resource development and land use. Widespread petroleum development has occurred on the ACP since the construction of the Trans-Alaskan Pipeline System in the 1970s and has recently expanded westward into the NPR-A. Petroleum exploration may also be headed eastward into the Arctic National Wildlife Refuge. The oil industry relies on water from freshwater lakes to build ice roads in the winter for the exploration drilling and infrastructure construction phases and requires freshwater sources to a lesser degree during the production phase (Arp, Whitman, Jones, et al. Citation2019). A primary concern with lake water withdrawal is protection of overwintering fish habitat (Cott et al. Citation2008; Jones, Arp, Hinkel, et al. Citation2009), though protection of downstream flows and connectivity during the summer is also emerging as an important concern (Heim et al. Citation2016; Arp, Whitman, Jones, et al. Citation2019). Expansion of permanent production facilities (i.e., oil wells) typically requires networks of permanent gravel roads with multiple stream and river crossings requiring culverts or bridges. Routing of roads through ACP watersheds has a high potential to change existing connectivity and fish migration (Heim et al. Citation2019), making more spatially explicit habitat information increasingly valuable for informing routing options.
This study aims to classify connectivity for catchment units in the FCW by identifying hydrologic and geomorphic features that have the potential to act as fish barriers. Connectivity was classified using high-resolution optical imagery and a digital surface model (DSM) with field validation and classification refinement for almost half of the catchments. This classification resulted in a geospatial product (Johaneman et al. Citation2019) that can be used to assess fish habitat quality at the hydrologic unit scale. This study proposes that catchment connectivity can be used in management decisions throughout a lake-rich watershed in the NPR-A where petroleum exploration and development is currently expanding (Arp, Whitman, Jones, et al. Citation2019), particularly with respect to permitting lake water extraction and the routing and design of road networks to mitigate human-caused barriers to fish passage.
Methods
Study area
Located entirely within the NPR-A, the FCW is adjacent to the native village of Nuiqsut, whose residents rely on its lands and waters for subsistence hunting and fishing (). Oil exploration has been sporadic in the NPR-A over most of its history, but recent discoveries have led to permanent production facilities and more intensive exploration (Arp, Whitman, Jones, et al. Citation2019).
Figure 1. Catchments and river corridor areas in the FCW
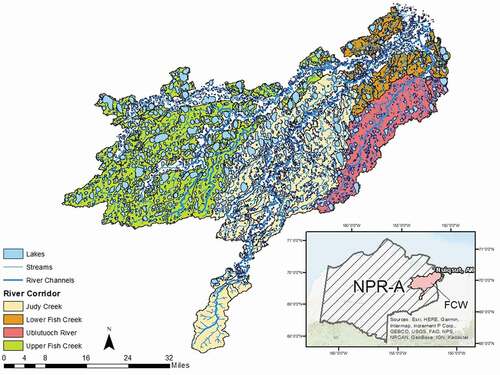
The FCW is 4,600 km2 and comprises three major rivers—Judy Creek, Upper Fish Creek, and the Ublutuoch River—which merge together in the Lower Fish Creek Delta and flow into the Beaufort Sea (). Roughly half of the fluvial drainage network of the FCW is composed of beaded streams and half alluvial rivers (Arp, Whitman, et al. Citation2012). Over 4,000 lakes lie in the boundaries of the FCW, covering 19 percent of the watershed’s surface (Jones et al. Citation2017). A similar proportion of the FCW is covered with wetlands in the form of drained thermokarst lake basins, with higher portions in the Ublutuoch River Watershed and lower portions in the Upper Fish Creek Watershed (Arp, Whitman, et al. Citation2012). The FCW, along with other watersheds on the ACP of Alaska, is lake rich primarily because permafrost allows water to pond and thermally erode and expand, forming high numbers of lakes over time (Jorgenson and Shur Citation2007; Jones, Arp, Hinkel, et al. Citation2009). Many lakes also form via river migration as meander cutoffs (i.e., oxbow lakes), which also adds to high lake densities, particularly in FCW with three actively migrating alluvial rivers (Jones et al. Citation2017).
The FCW supports an abundance of fish. At least sixteen fish species are known to inhabit the watershed, with the most abundant including the Arctic grayling (Thymallus arcticus), broad whitefish (Coregonus nasus), least cisco (Coregonus sardinella), and ninespine stickleback (Pungitius pungitius; Whitman et al. Citation2011). These fish are of different sizes and have varying roles in the food web. Lake trout (Salvelinus namaycush), for example, is a prominent predator limited to inhabiting deep lakes, whereas ninespine stickleback and least cisco are widespread important forage species (Jones et al. Citation2017). Several whitefish species are an important food source for the nearby community of Nuiqsut and the increasing occurrence of Pacific salmon (Oncorhynchus spp.) may someday provide an additional food supply (Nielsen et al. Citation2013). Many of the whitefish in the FCW are diadromous and migrate between freshwater and marine habitats, such as broad whitefish and least cisco, making habitat connectivity an essential requirement of watersheds where they occur. This connectivity can be equally important for some freshwater species. Studies of Arctic grayling and burbot (Lota lota) show distinct seasonal movements between rivers, lakes, and beaded streams (Morris Citation2003; Heim et al. Citation2016, Citation2019).
Delineation of catchments
Catchments within the FCW were delineated for each tributary within the four river corridors using the ArcMap Hydrology Toolset and methods derived from Merwade’s (Citation2018) Stream Network and Watershed Delineation Using Spatial Analyst Hydrology Tools. The four river corridors in this study were defined based on river confluences within the FCW. A 5-m-resolution Interferometric Synthetic Aperture Radar–derived DSM, acquired by Intermap Technologies over the NPR-A between 2002 and 2006 (Jones and Grosse 2013), and a number of ArcMap Hydrology tools (Basin, Fill, Flow Accumulation, Flow Direction, Flow Length, Sink, Snap Pour Point, Stream Link, Basin) were used to perform the delineation. Manual corrections to catchments, where necessary, were aided by a 2.5-m-resolution color infrared (CIR) photo mosaic and a stream shapefile.
Abundance of lakes in each catchment was determined using the lake feature class developed by Jones and Zuck (Citation2016) and the Spatial Join and Field Calculator tools. Numbers of deep and connected lakes and percentage of total lakes were also calculated based on Jones and Zuck’s (Citation2016) geospatial lake classification. Deep lakes are lakes with depths greater than 4 m and connected lakes are flow-through lakes (perennial inflow and outflow) or lakes with a perennial connection (outflow; Jones and Zuck Citation2016). The deep lake and connected lake classifications can overlap and the two classifications will likely be present in a number of lakes.
Classifying connectivity from geospatial data
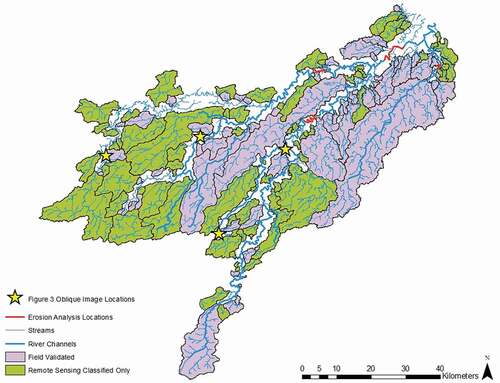
Connectivity was evaluated at two areas in each catchment: (1) the interface of the riparian zone and catchment’s outflow point, hereafter referred to as riparian connectivity, and (2) upstream of the outflow point, hereafter referred to as catchment connectivity. The riparian connectivity point was determined using Jorgenson et al.’s (Citation2014) floodplain delineation. The high-resolution CIR image was used to evaluate catchment connectivity, and field observations of sixty-one catchments () were used to verify and inform remote sensing classifications of the remaining eighty catchments.
Figure 2. Field-validated catchments in the FCW, visited in July. Locations of oblique images () and erosion analysis () are also shown
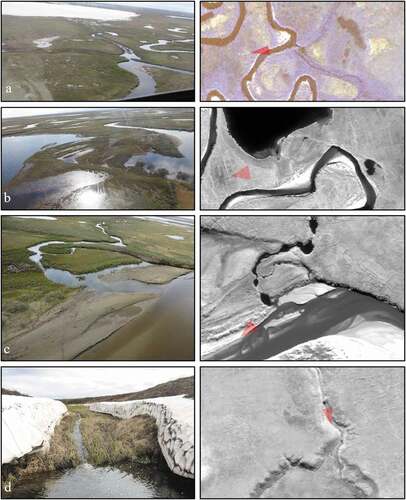
Catchments were given one of four connectivity classes: (1) no barriers, (2) wetland flowthrough, (3) knickpoint, and (4) subsurface flow. Catchments classified under no barriers were well connected in that they did not contain any barriers or modes of disconnectivity (i.e., classes 2–4) during low flows (). The wetland flowthrough class was characterized by a surface flow path with no defined channel, typically low gradient, and moving through wetland vegetation (). Channels with one or more steep drops (small waterfalls or riffles) along the stream were assigned the knickpoint classification (). Subsurface flow was characterized by streams that flow over and through broad sand deposits, typically sand bars at the confluence of rivers and in some cases lake outlets (). These sand formations acted as barriers only during periods of lower flows and when the thaw depth increased, such that surface flow totally infiltrated into sandy substrates and all or most flow moved subsurficially. Most of these geomorphic barriers were expected to become more effective at reducing potential fish passage as flows declined through the summer.
Figure 3. Oblique (left column) and satellite (right column) images of the four example catchment/riparian connectivity classes. The opaque red triangle on the satellite images shows the point of view seen in the oblique images. Connectivity classes shown are as follows: (a) no barriers, (b) wetland flowthrough, (c) subsurface flow, and (d) knickpoint. Locations of these images can be found on
Though the presence of features, such as knickpoints, were easily observed in the field, they were much more difficult to identify using remote sensing techniques. The relatively small size of the knickpoints, compared to other barriers, and the high likelihood of them being covered by riparian vegetation made them hard to observe using satellite imagery. Thus, most remotely sensed knickpoints were identified by using the DSM to find abrupt changes in elevation along streams where knickpoints were suspected. Abrupt changes were considered to be sections of streams with a slope greater than 45°; the average slope in the FCW is 2.68° and the standard deviation of slope values is 2.62. The lack of visible knickpoints in the CIR image and Google Earth imagery, as well as a moderate-resolution DSM, introduced a source of error into classifications made through remote sensing.
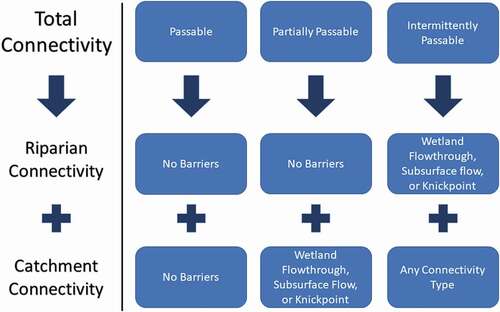
Total catchment connectivity is the overarching evaluation based on the combination of riparian and catchment connectivity. The three classes—(1) passable, (2) partially passable, and (3) intermittently passable—rely heavily on the connectivity of the catchment’s riparian zone. A catchment was placed under the intermittently passable class if its riparian connectivity was classified as wetland flowthrough, subsurface flow, or knickpoint. A catchment with partially passable connectivity had no barrier riparian connectivity and wetland flowthrough, subsurface flow, or knickpoint catchment connectivity. If both the riparian zone and the catchment were identified as having no barriers, then the total catchment connectivity would be passable ().
Figure 4. Total connectivity classes explained
Hydrologic connectivity was determined through catchment-area thresholds established for different dominant surface geology based on discharge measurements made during low-flow conditions (Jones et al. Citation2017). Surface geology for each catchment was evaluated using data from Jones and Zuck (Citation2016). Hydrologic connectivity entails three classes—isolated, seasonal, and perennial—originally based on catchments upstream of lake outlets (Jones et al. Citation2017). Catchments classified as isolated consisted of one of three catchment area–surface geology combinations: an area less than 15 km2 and underlying marine sand; an area less than 5 km2 and eolian sand; an area less than 50 km2 and eolian silt. Catchments with seasonal hydrologic connectivity either consisted of a catchment area of 15 to 25 km2 and marine sand, a 5 to 10 km2 area and eolian sand, or a 50 to 100 km2 area and eolian silt. Finally, catchments classified under perennial hydrologic connectivity consisted of a catchment area greater than 25 km2 and marine sand, an area greater than 10 km2 and eolian sand, or an area greater than 100 km2 and eolian silt. Details and underlying data for this assessment of hydrologic connectivity are presented in Jones et al. (Citation2017).
Field observations and data collection
Field observations and data were collected over a period of four days in mid-July 2018, a period when connectivity is normally most restricted (Arp, Whitman, et al. Citation2012; Heim et al. Citation2016). Discharge data recorded from 2002 to 2018 for Upper Fish Creek, Judy Creek, and the Ublutuoch River show the average July discharge (8.1 m3/s) to be much lower than the average June discharge (32.1 m3/s; Arp, Whitman, and Kemnitz Citation2019). However, in 2018, flows were higher than normal due to a late snowmelt and slow snowmelt recession; the average discharge recorded in July 2018 was 21.8 m3/s (Arp, Whitman, and Kemnitz Citation2019). Connectivity of sixty-one catchments, 43 percent of all delineated catchments, in the FCW was aerially observed during this period by helicopter. Stream courses from river connections upstream through the riparian zone and up to headwater lakes were observed and photographed typically at 100-m elevation above ground level. Photographs and notes were later compared to CIR imagery and preflight classifications to make changes and refinements to the ones observed, as well as the remaining eighty catchments, in our best attempt to make consistent assessments of barriers to connectivity throughout the FCW.
At twenty-seven of sixty-one catchments, we made ground visits to observe connectivity conditions more closely and collect hydrologic data just upstream of the confluence of stream and main river corridor. Stream width, depth, and velocity measurements were used to calculate discharge by the velocity–area methods with an electromagnetic velocity meter and top-setting wading rod. Water temperature and specific conductivity were recorded at each location. Channel slope was also determined along the same reach as discharge measurements using an electronic altimeter and 50-m tape along a distance of greater than twenty channel widths. Additional ground photographs were collected at these sites to review in comparison to aerial photos and classification based on geospatial data sets.
Riverbank erosion analysis and comparison
During the geospatial classification and subsequent field observations, we identified that many of the barriers to fish passage in riparian zones appeared related to position of stream junctions relative to river channel form (i.e., outside meander cutbanks vs. inside meander point bars) and potentially rates of migration. Thus, we decided to measure rates of bank erosion and channel migration using a time series of optical imagery for several sections. River sections were 1 to 5 km long and typically included three to four meanders and similar positions among the river with respect to the main confluence. Bank erosion and channel migration were compared among the major rivers in the FCW in relation to our catchment connectivity classification.
Analysis of erosion rates along four sections of each main river corridor was performed using the Digital Shoreline Analysis System (DSAS; Thieler et al. Citation2017), an add-on tool in ArcMap developed by the U.S. Geological Survey. Black-and-white single-frame aerial imagery from 1948 and 1982, a CIR single-frame imagery from 1982, and a CIR photo mosaic from 2002 were used to calculate change over fifty-four years. A baseline polyline feature was drawn onshore and parallel to the shoreline for each section being evaluated. The DSAS tool uses the baseline to draw perpendicular transects. Shorelines for each year being measured were then drawn (). The intersection of transects and shorelines provide measurement points. Uncertainty was calculated using Jones, Arp, Jorgenson, et al.’s (2009) dilution of accuracy (DOA) equation:
Figure 5. Shorelines drawn in ArcMap for (a) Judy Creek, (b) Upper Fish Creek, (c) Lower Fish Creek, and (d) the Ublutuoch River for use with the DSAS tool to perform the erosion analysis. Locations of these images can be found in
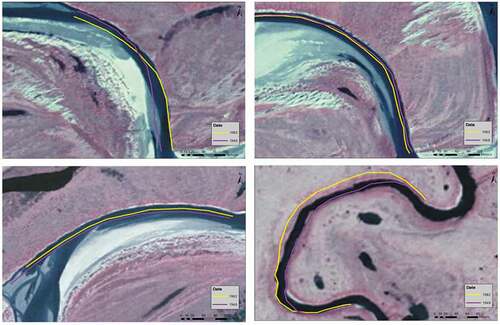
where Eg is the positional accuracy of the 2002 CIR photo mosaic, Ep1 and Ep2 are each a pixel resolution from a specific year (i.e., 1948, 1982), RMS1 and RMS2 are each the root mean square from the georeferencing process of a particular image, and is the time difference between the two years. Erosion rate, the average annual movement/erosion, was calculated using the DSAS tool. Measurements of erosion rates for the three major rivers were then compared to connectivity classifications to provide context for how river-to-catchment connectivity might change in the future.
Results
General characteristic of delineated catchments
The delineation process resulted in 141 individual catchments in the FCW upstream of riparian zone intersection points. Upper Fish Creek had the highest number of catchments (53), and the Ublutuoch River had the smallest number of catchments (3). Judy Creek had 50 catchments and Lower Fish Creek had 35 catchments (). Mean and median catchment sizes were 27 and 6 km2, respectively, and ranged from 0.2 to 509.5 km2. Upper Fish Creek and Judy Creek had high total drainage areas, 41 and 35 percent of total drainage area, respectively. Lower Fish Creek and the Ublutuoch River each had smaller total drainage areas, 10 and 14 percent of total drainage area, respectively ().
Table 1. Characteristics of the four main river corridors
Lake distribution analysis revealed a total of 3,004 lakes within the delineated catchments, which is 75 percent of all lakes in the watershed. Of the 3,004 total lakes, 20 percent were deep lakes (>4 m) and 15 percent were connected lakes according to the geospatial databased classification by Jones and Zuck (Citation2016), with Upper Fish Creek catchments having the highest percentage of connected and deep lakes. Upper Fish Creek and Judy Creek had 41 and 13 percent deep lakes, respectively. Catchments in the Ublutuoch River had very few deep lakes (<1 percent), and Lower Fish Creek had none (). Percentage connected lakes in the FCW ranged from 11 percent in the Ublutuoch River Watershed to 18 percent in the Upper Fish Creek Watershed (). A total of 183 lakes were classified under both deep and connected, and a majority of these lakes were found in the Upper Fish Creek river corridor. Total lake area in delineated catchments in the FCW was 765 km2, making up 20 percent of the total catchment area. There was a large range of lake abundance between the four main river corridors. The Upper Fish Creek riparian zone had 1,114 lakes, Judy Creek had 1,005 lakes, Lower Fish Creek had 422 lakes, and the Ublutuoch River had 463 lakes. Upper Fish Creek had the highest percentage lake area at 27 percent, Judy Creek’s percentage lake area was 16 percent, the Ublutuoch River’s was 15 percent, and the Lower Fish Creek’s was 17 percent ().
Riparian connectivity
Stream reaches flowing from the outlets of delineated catchments through riparian zones to junctions with major rivers were classified according to types of barriers to fish passage. Almost half (43 percent) of riparian reaches were classified as having no barrier to fish passage. Modes of disconnectivity (barriers to fish passage) were dominated by subsurface flow (27 percent), followed by wetland flowthrough (19 percent) and knickpoints (11 percent) accounting for the remaining types of barriers to fish passage. Most riparian reaches in Upper Fish Creek and the Ublutuoch River had no barrier connectivity (68 and 67 percent, respectively). Far fewer riparian reaches in the other two river corridors were determined to have no barrier connectivity: only 18 percent of streams flowing through the Judy Creek riparian zone and 37 percent of streams flowing through the riparian zone of Lower Fish Creek (). The most prominent mode of riparian disconnectivity in Judy Creek was subsurface flow (46 percent), followed by wetland flowthrough (24 percent) and knickpoints (12 percent).
Figure 6. Catchment connectivity and riparian connectivity in the FCW
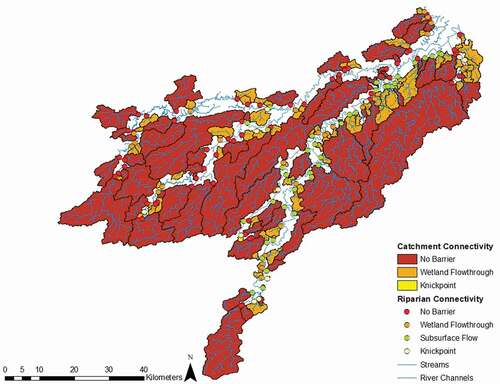
Catchment connectivity
Catchment reaches, stream courses above riparian zones within delineated catchments, also were classified as either having no barriers, wetland flowthrough, or knickpoint. No subsurface flow barriers occurred in catchment stream reaches. Just under half of all catchments had no barriers (44 percent). The dominant barrier to fish passage classified in catchment reaches was wetland flowthrough (55 percent), and less than 1 percent of catchment reaches had knickpoints (). The Ublutuoch River showed the highest percentage of catchments with no barriers in catchment reaches (67 percent), followed by Upper Fish Creek (51 percent). No barrier catchment connectivity occurred in 40 percent of Lower Fish Creek’s catchments and 38 percent of Judy Creek’s catchments (). Wetland flowthrough was the only type of barrier to fish passage identified in upstream catchment reaches in Upper Fish Creek, Lower Fish Creek, and the Ublutuoch River. Wetland flowthrough was also the dominant mode of disconnect in the catchment reaches of Judy Creek’s catchments, but one catchment fell under the knickpoint classification ().
Total catchment connectivity
Total catchment connectivity considers the combined effects of riparian connectivity and catchment connectivity. Of the 141 catchments, only 40 were considered fish passable in both zones. A majority of catchments (72 percent) did not have passable total connectivity ().
Figure 7. Total connectivity of catchments in the FCW
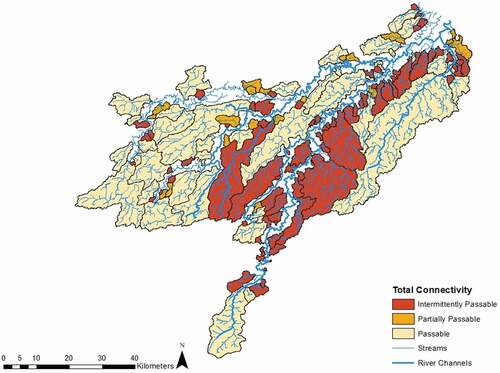
In comparing the four main river corridors, the Ublutuoch River had the highest percentage of passable catchments (67 percent), and Judy Creek had the lowest percentage (14 percent). Most of the catchments in Judy Creek (86 percent) had intermittently passable or partially passable total connectivity. Lower Fish Creek also had a high percentage of catchments that were classified as intermittently passable or partially passable (77 percent).
Total catchment connectivity in the Upper Fish Creek and Lower Fish Creek corridors varied much more than that in Judy Creek and the Ublutuoch River. Upper Fish Creek had 43 percent catchments fall under passable, 25 percent partially passable, and 32 percent intermittently passable. Lower Fish Creek had 23 percent catchments fall under passable, 14 percent partially passable, and 63 percent intermittently passable. Both the Upper and Lower Fish Creeks had a substantial number of catchments fall in each total catchment connectivity category. Judy Creek and the Ublutuoch River each had a dominating total catchment connectivity type, intermittently passable and passable, respectively, and thus its catchments varied much less in total connectivity type.
Hydrologic connectivity
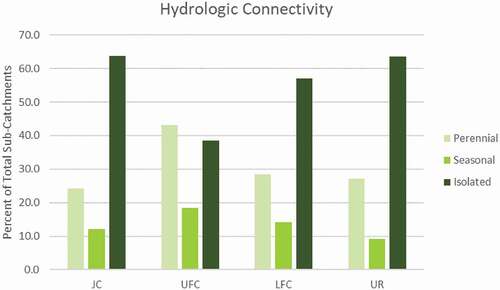
Hydrologic connectivity is based on catchment area thresholds stratified by surface geology according to analysis detailed in Jones et al. (Citation2017). Just over half of all catchments fell under isolated hydrologic connectivity. About one third of all catchments fell under perennial connectivity and 15 percent fell under seasonal connectivity. Isolated hydrologic connectivity was the dominant catchment connectivity in Judy Creek (62 percent) and Lower Fish Creek (69 percent) due to small basin size coupled with much lower summer runoff per unit drainage area in these watersheds. In both the Upper Fish Creek and Ublutuoch River corridors, the dominant mode of hydrologic connectivity was perennial (45 and 67 percent, respectively). Seasonal hydrologic connectivity was the least dominant mode of connectivity in all river corridors, ranging from 10 to 23 percent ().
Figure 8. Hydrologic connectivity of river corridors in the FCW
Erosion analysis
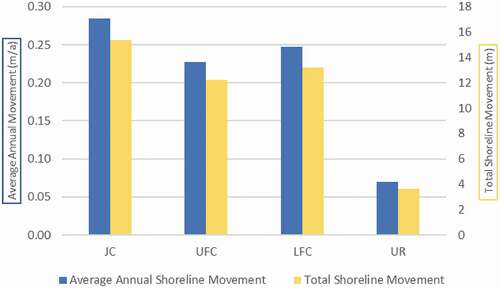
Analysis of bank erosion rate between 1948 and 2002 over 1 km of channel was used to estimate and compare erosion rates among major river channel where we classified connectivity. The Judy Creek channel eroded and shifted most over the period of analysis (15 m on average [0.28 m a−1]; ). Upper and Lower Fish Creek channels had somewhat lower rates (12 and 13 m on average, respectively [0.23 and 0.25 m a−1, respectively]; ), and erosion rates of the Ublutuoch River channels were much lower (5 m on average [0.07 m a−1]; ). Channel reaches evaluated at Judy Creek had consistent and high rates, ranging from 13 to 16 m, whereas channels in the Upper Fish Creek were more variable, ranging from 3 to 27 m. The difference in rate range and variability between river channels may be due to slope and sinuosity. The channel section used to evaluate erosion in Judy Creek has a higher sinuosity (2.4) and slope (3.0) than the channel section evaluated in Upper Fish Creek, where the sinuosity was 2.2 and the slope value was 1.8. Judy Creek’s high slope, sinuosity, and discharge, combined with a smaller stream area, may contribute to its consistently high erosion rates when compared to Upper Fish Creek.
Figure 9. Average and total shoreline erosion rate for each river corridor
Discussion
Integrating hydrogeomorphic connectivity in riparian zones and catchments
Catchment connectivity is directly related to drainage area through proportionality with streamflow, though this has been shown to vary among the three main rivers of the FCW (Arp, Whitman, et al. Citation2012) and at finer scales within these watersheds (Jones et al. Citation2017). The effectiveness of barriers to fish passage caused by types of channel form (i.e., wetland flowthrough, knickpoints, and subsurface flow) are all most likely greater in smaller catchments during dry periods with low runoff. Streams draining small catchments without geomorphic barriers will also prevent fish passage during dry periods where streamflow drops below critical thresholds in FCW streams (Heim et al. Citation2019), though more study is needed to validate these results for different fish species and stream channel types. Thus, we expected that in the FCW, catchments with the no barrier connectivity classification would also be found in relatively large drainage areas. The interaction between hydrologic connectivity and geomorphic barriers to fish passage cannot be separated both due to seasonal variability in flows and over longer periods (decades or longer) as higher flows grade channels (i.e., eliminate knickpoints) and form single-thread vegetation-free channels (i.e., eliminate wetland flowthrough). Similarly, higher flows erode and mobilize sand deposits that create subsurface flow barriers to fish passage during low flows, though the sources of these deposits are typically connecting rivers. Catchments placed under the wetland flowthrough or knickpoint connection classes all had relatively small drainage areas.
Predicted hydrologic intensification in the Arctic due to a marked decrease in sea ice and increase in open water extent could increase erosion and contribute to more dynamic riparian conditions. Arp, Whitman, and Kemnitz (Citation2019) observed a recent increase in runoff in the FCW and a general hydrologic regime shift from snowmelt- to rainfall-dominated runoff. Increased runoff and the dominance of high-intensity rainfall events, rather than a longer and slower release of snowmelt into the watershed, could enable more dynamic rivers, such as Judy Creek, to increase erosion and deposition rates. Through higher overall runoff and changing flow regimes, this could increase variability in both hydrologic and geomorphic barriers, in terms of the formation and destruction of geomorphic barriers whose effects rely on the timing and intensity of discharge rates.
The conceptual framework we arrived at in our study of connectivity and fish passage in the FCW was initially developed to address connectivity in streams flowing through riparian zones separately from those higher in catchments. River channel migration and where tributaries enter rivers relative to channel migration was considered to play an important role in the type and effectiveness of riparian zone barriers to fish passage. River channels with higher rates of bank erosion, such as Judy Creek, did have more streams flowing through riparian zones subject to knickpoint barriers, often at high cutbanks of outside meanders, and both subsurface flow and wetland flowthrough barriers, often on inside meanders on broad point bars and floodplains, respectively. Higher channel migration rates also should mean greater opportunity for these connectivity classes to change over time with more dynamic riparian conditions. Work by Lesack and Marsh (Citation2010) on the Mackenzie River Delta identified such dynamics of river–lake connectivity over long periods with channel change, but otherwise we are unaware of work on connectivity that identified channel migration as an important factor in fish movement and habitat availability. Accounting for such dynamics may be increasingly important in the NPR-A as development expands into regions with higher densities of river channels that interact with other aquatic habitats (Arp, Whitman, Jones, et al. Citation2019).
Applying connectivity classification to land management
Regarding land management practices, total catchment connectivity should be considered first, because it provides general guidance relevant to habitat potential to support the full life cycle of migratory fishes. The three total connectivity classes (passable, intermittently passable, and partially passable) allude to habitat quality at a catchment scale and potentially the abundance of fish through spatial and temporal lenses. These total catchment connectivity classes could be used by management to help inform land use decisions. For example, passable catchments could be managed more conservatively because they provide unlimited access to important stream–lake habitat essential for many migratory fishes, compared to intermittently passable or partially passable catchments that may have interrupted connectivity, depending on seasonal flow regimes and water balance (rainfall and evapotranspiration) variability from year to year. When considering lakes for winter water withdrawal, these classifications could provide guidance to help avoid impacts to downstream flows and connectivity in catchments with greater fish habitat potential.
In partially passable catchments, riparian connectivity is clear of barriers, but the upstream reach contains one or more modes of disconnectivity, potentially preventing fish passage. The upstream position of the barrier allows fish to migrate from rivers into riparian habitats but not consistently to tundra stream and headwater lake habitats. For these catchments, best management practices could potentially restrict stream crossings in the riparian zone and instead route stream crossings within upstream catchments only. Water extraction from upstream lakes in partially passable catchments would also warrant detailed consideration, because overuse of those lakes could impact downstream flows and connectivity in the riparian zone that restrict fish movements.
Catchments classified under intermittently passable could be considered less restrictive in the case of some land and water use activities. The total catchment connectivity is poor, with barriers in the riparian reach closing off the entire catchment at its entry point. Compared to catchments in the other two total connectivity classes, it is unlikely that fish are migrating to upstream habitats during the summer. As long as lake water withdrawal does not substantially alter lake water levels and ice formation, land managers may be able to permit more generous water withdrawal limits for headwater lakes in these catchments.
An important consideration is how this catchment classification based on connectivity is prioritized by managers in terms of habitat conservation value at local to watershed scales. Emerging research from other watersheds in Alaska highlights the role of ephemerally connected habitats in supporting shifting habitat mosaics (Brennan et al. Citation2019) and off-channel habitats (Huntsman and Falke Citation2019), which ultimately result in more resilience of fish communities to land use and climate change. Fish research from ACP watersheds distinctly shows higher diversity and the presence of species with subsistence value in lakes with higher connectivity (Haynes et al. Citation2014; Laske et al. Citation2016; Jones et al. Citation2017), yet shallow disconnected lakes are also shown to support very high plankton and planktivorous fish productivity (Beaver et al. Citation2019) and even provide habitat for certain life history stages of subsistence species (Heim et al. Citation2019). At the watershed and landscape scales, the composition of catchments with varying degrees of connectivity likely plays an important role in fish community diversity and productivity such that managing for a balance of habitat connectivity classes should be prioritized. Our catchment-scale classification of connectivity for the FCW provides managers with this information to consider how varying development alternatives may impact this balance of habitat types at a variety of scales. Thus, the value of perennially connected catchments versus ephemerally connected habitats should be considered in the context of the hydrologic unit where new land use is being planned. Similar classification of lakes in the FCW based on winter water use and fish habitat also provides such a dichotomy in value decisions for arctic watershed managers (Jones et al. Citation2017).
We expect that our new geospatial classification of catchment connectivity for the FCW can be used to guide land management decisions for ongoing oil exploration and development in this large hydrologic unit of the NPR-A. Applying this classification system to other watersheds in the NPR-A could provide improved knowledge of fish habitat potential in advance of oil and gas activity, proactively preparing management to make well-informed decisions. A connectivity analysis recognizes the relationship among rivers, streams, and lakes in supporting the full life history needs of many fish species in arctic freshwater systems, integrating physical and biological considerations. Additionally, connectivity classifications provide a greater depth of knowledge regarding fish distribution dynamics according to changing hydrologic and geomorphic conditions from natural variability as well as anthropogenic impacts.
Conclusions
Aquatic habitat connectivity in the FCW was assessed using remote sensing, aerial observations, and site visits. We classified connectivity separately in riparian corridors and upstream catchments because of differing processes in these respective areas and the potential for different types of land use in each. Riparian and catchment connectivity were jointly evaluated to assess the total connectivity of each catchment, recognizing the linkages of these zones in relation to habitat availability. Hydrologic connectivity was also evaluated based on catchment size relative to hydrologic relationships in the major subwatershed of the FCW. Our analysis showed that catchment connectivity classes are related to both catchment and main river corridor dynamics. Wetland flowthrough and knickpoint barriers are more dependent on drainage area and corresponding relationships to flow regimes and thus were more prevalent in smaller catchments with less contributing area and lower streamflow. Subsurface flow disconnect is dependent on drainage area and corresponding relationships to flow regimes but is also affected by channel dynamics (i.e., rate of channel migration) of the main connecting river channel, which could explain its high occurrence in catchments with smaller drainage areas. Catchments with no barrier connectivity tended to occur in larger catchments with high streamflow and large contributing areas.
The results of this study provide new information about catchments in the FCW that can be used in land management decisions. Many management decisions in the FCW and elsewhere on the ACP involve the use of lake water for the construction of ice roads and pads, which, if too great, can impact local fish populations and the downstream aquatic ecosystem. Several fish species in the FCW that are of high subsistence value to the nearby village of Nuiqsut rely on seasonal movements in and out of interconnected stream–lake systems. Considering catchment connectivity in the analysis of potential impacts from oil and gas activities can help sustain the populations of those migratory fishes. This geospatial data set provides another layer of valuable information to help ensure that lakes and streams supporting populations of high-value subsistence fish are protected from the effects of human–environment interactions in the NPR-A. Future work should focus on establishing how well these catchment classes predict fish habitat, evaluating how useful a catchment connectivity framework is to resource management, and assessing how applicable this catchment-scale connectivity framework is to other arctic watersheds.
Acknowledgments
Important field logistical support was provided by the Bureau of Land Management’s Arctic District. We thank helicopter pilot Jason Brown for his care and patience in navigating us to many locations in the FCW. Lastly, we thank Dr. E. Eric Boschmann and Cathy Durso for their help with statistics and Dr. B. Jones for help with geospatial analysis.
Disclosure statement
No potential conflict of interest was reported by the authors.
Additional information
Funding
References
- Arp, C. D., B. M. Jones, Z. Lu, and M. S. Whitman. 2012. Shifting balance of thermokarst lake ice regimes across the Arctic Coastal Plain of northern Alaska. Geophysical Research Letters 39 (16). doi: https://doi.org/10.1029/2012GL052518.
- Arp, C. D., M. Whitman, B. Jones, G. Grosse, B. Gaglioti, and K. Heim. 2015. Distribution and biophysical processes of beaded streams in Arctic permafrost landscapes. Biogeosciences 12 (1):29. doi:https://doi.org/10.5194/bg-12-29-2015.
- Arp, C. D., M. S. Whitman, B. M. Jones, D. A. Nigro, V. A. Alexeev, A. Gadeke, S. Fritz, R. Daanen, A. K. Liljedahl, F. J. Adams, et al. 2019. Ice roads through lake-rich Arctic watersheds: Integrating climate uncertainty and freshwater habitat responses into adaptive management. Arctic, Antarctic, and Alpine Research 51 (1):9–23. doi:https://doi.org/10.1080/15230430.2018.1560839.
- Arp, C. D., M. S. Whitman, B. M. Jones, R. Kemnitz, G. Grosse, and F. E. Urban. 2012. Drainage network structure and hydrologic behavior of three lake-rich watersheds on the Arctic Coastal Plain, Alaska. Arctic, Antarctic, and Alpine Research 44 (4):385–98. doi:https://doi.org/10.1657/1938-4246-44.4.385.
- Arp, C. D., M. S. Whitman, and R. Kemnitz. 2019. “Long-term evidence for hydrological system regime change from the fish creek watershed observatory in Northern Alaska, U.S.A.” Paper presented at 22nd International Northern Research Basins Symposium and Workshop, Yellowknife, Canada, August 18–23.
- Beaver, J. R., C. D. Arp, C. E. Tausz, B. M. Jones, M. S. Whitman, T. R. Renicker, E. E. Samples, D. M. Ordosch, and K. C. Scotese. 2019. Potential shifts in zooplankton community structure in response to changing ice regimes and hydrologic connectivity. Arctic, Antarctic, and Alpine Research 51 (1):327–45. doi:https://doi.org/10.1080/15230430.2019.1643210.
- Bowling, L. C., D. L. Kane, R. E. Gieck, L. D. Hinzman, and D. P. Lettenmaier. 2003. The role of surface storage in a low‐gradient arctic watershed. Water Resources Research 39 (4). doi: https://doi.org/10.1029/2002WR001466.
- Brennan, S. R., D. E. Schindler, T. J. Cline, T. E. Walsworth, G. Buck, and D. P. Fernandez. 2019. Shifting habitat mosaics and fish production across river basins. Science 364 (6442):783–86. doi:https://doi.org/10.1126/science.aav4313.
- Connon, R. F., W. L. Quinton, J. R. Craig, and M. Hayashi. 2014. Changing hydrologic connectivity due to permafrost thaw in the lower Liard River valley, NWT, Canada. Hydrological Processes 28 (14):4163–78. doi:https://doi.org/10.1002/hyp.10206.
- Cott, P. A., P. K. Sibley, A. M. Gordon, R. A. Bodaly, K. H. Mills, W. M. Somers, and G. A. Fillatre. 2008. Effects of water withdrawal from ice-covered lakes on oxygen, temperature, and fish. JAWRA Journal of the American Water Resources Association 44 (2):328–42. doi:https://doi.org/10.1111/j.1752-1688.2007.00165.x.
- Fullerton, A. H., K. M. Burnett, E. A. Steel, R. L. Flitcroft, G. R. Pess, B. E. Feist, C. E. Torgersen, D. J. Miller, and B. Sanderson. 2010. Hydrological connectivity for riverine fish: Measurement challenges and research opportunities. Freshwater Biology 55 (11):2215–37. doi:https://doi.org/10.1111/j.1365-2427.2010.02448.x.
- Haynes, T. B., A. E. Rosenberger, M. S. Lindberg, M. Whitman, and J. A. Schmutz. 2014. Patterns of lake occupancy by fish indicate different adaptations to life in a harsh arctic environment. Freshwater Biology 59 (9):1884–96. doi:https://doi.org/10.1111/fwb.12391.
- Heim, K. C., C. D. Arp, M. S. Whitman, and M. S. Wipfli. 2019. The complementary role of lentic and lotic habitats for Arctic grayling in a complex stream‐lake network in Arctic Alaska. Ecology of Freshwater Fishes 28 (2):209–21. doi:https://doi.org/10.1111/eff.12444.
- Heim, K. C., M. Wipfli, M. Whitman, C. Arp, J. Adams, and J. Falke. 2016. Seasonal cues of Arctic grayling movement in a small Arctic stream: The importance of surface water connectivity. Environmental Biology of Fishes 99 (1):49–65. doi:https://doi.org/10.1007/s10641-015-0453-x.
- Huntsman, B. M., and J. A. Falke. 2019. Main stem and off‐channel habitat use by juvenile Chinook salmon in a sub‐Arctic riverscape. Freshwater Biology 64 (3):433–46. doi:https://doi.org/10.1111/fwb.13232.
- Johaneman, T., C. Arp, M. Whitman, B. Jones, and A. Bondurant. 2019. Catchment connectivity in an Arctic Coastal Plain watershed, 2018. Arctic Data Center. doi:https://doi.org/10.18739/A2NV99977.
- Jones, B. M., C. Arp, K. Hinkel, R. Beck, J. Schmutz, and B. Winston. 2009. Arctic lake physical processes and regimes with implications for winter water availability and management in the National Petroleum Reserve Alaska. Environmental Management 43 (6):1071–84. doi:https://doi.org/10.1007/s00267-008-9241-0.
- Jones, B. M., C. Arp, M. Whitman, D. Nigro, I. Nitze, J. Beaver, A. Gadeke, C. Zuck, A. Liljedahl, R. Daanen, et al. 2017. A lake-centric geospatial database to guide research and inform management decisions in an Arctic watershed in northern Alaska experiencing climate and land-use changes. Ambio; A Journal of the Human Environment 46 (7):769–86. doi:https://doi.org/10.1007/s13280-017-0915-9.
- Jones, B. M., and C. Zuck. 2016. Fish Creek Watershed Lake Classification; NPRA, Alaska, 2016. (data release). U.S. Geologic Survey. doi:https://doi.org/10.5066/F7H70CXB.
- Jones, B. M., C. D. Arp, M. T. Jorgenson, K. M. Hinkel, J. A. Schmutz, and P. L. Flint. 2009. Increase in the rate and uniformity of coastline erosion in Arctic Alaska. Geophysical Research Letters 36 (3). doi: https://doi.org/10.1029/2008GL036205.
- Jones, B. M., and G. Grosse. 2013. Western Arctic Coastal Plain, IFSAR-derived, Digital Surface Model. University of Alaska Fairbanks, Geophysical Institute Permafrost Laboratory. Raster Digital Data. Last modified October 23, 2013. http://arcticlcc.org/products/spatial-data/show/western-arctic-coastal-plain-ifsar-dsm-mosaic.
- Jorgenson, M. T., M. Kanevskiy, Y. Shur, J. Grunblatt, C. L. Ping, and G. J. Michaelson. 2014. Permafrost database development, characterization, and mapping for northern Alaska. Anchorage, AK: U.S. Fish and Wildlife Service, Arctic Landscape Conservation Cooperative.
- Jorgenson, M. T., and Y. Shur. 2007. Evolution of lakes and basins in northern Alaska and discussion of the thaw lake cycle. Journal of Geophysical Research: Earth Surface 112 (F2). doi: https://doi.org/10.1029/2006JF000531.
- Laske, S. M., A. E. Rosenberger, M. S. Wipfli, and C. E. Zimmerman. 2019. Surface water connectivity controls fish food web structure and complexity across local- and meta-food webs in Arctic Coastal Plain lakes. Food Webs 21 (2019):e00123. doi:https://doi.org/10.1016/j.foodweb.2019.e00123.
- Laske, S. M., T. B. Haynes, A. E. Rosenberger, J. Koch, M. S. Wipfli, M. Whitman, and C. E. Zimmerman. 2016. Surface water connectivity drives richness and composition of Arctic lake fish assemblages. Freshwater Biology 61 (7):1090–104. doi:https://doi.org/10.1111/fwb.12769.
- Lesack, L. F. W., and P. Marsh. 2007. Lengthening plus shortening of river‐to‐lake connection times in the Mackenzie River Delta respectively via two global change mechanisms along the arctic coast. Geophysical Research Letters 34 (23). doi: https://doi.org/10.1029/2007GL031656.
- Lesack, L. F. W., and P. Marsh. 2010. River‐to‐lake connectivities, water renewal, and aquatic habitat diversity in the Mackenzie River Delta. Water Resources Research 46 (12). doi: https://doi.org/10.1029/2010WR009607.
- Merck, M. F., B. T. Neilson, R. M. Cory, and G. W. Kling. 2012. Variability of in‐stream and riparian storage in a beaded arctic stream. Hydrological Processes 26 (19):2938–2950. doi:https://doi.org/10.1002/hyp.8323.
- Merwade, V. 2018. Stream network and watershed delineation using spatial analyst hydrology tools. West Lafayette, IN: Purdue University, School of Civil Engineering.
- Morris, W. 2003. Seasonal movements and habitat use of Arctic Grayling (Thymallus arcticus), Burbot (Lota lota), and Broad Whitefish (Coregonus nasus) within the Fish Creek drainage of the National Petroleum Reserve–Alaska, 2001–2002. Technical Report No. 03-02. Fairbanks, AK: Alaska Department of Natural Resources, Office of Habitat Management and Permitting.
- Nielsen, J. L., G. T. Ruggerone, and C. E. Zimmerman. 2013. Adaptive strategies and life history characteristics in a warming climate: Salmon in the Arctic? Environmental Biology of Fishes 96 (10):1187–1226. doi:https://doi.org/10.1007/s10641-012-0082-6.
- Pringle, C. 2003. What is hydrologic connectivity and why is it ecologically important? Hydrological Processes 17 (13):2685–89. Developing a long-term aquatic monitoring network in a complex watershed of the Alaskan Arctic Coastal Plaindoi:https://doi.org/10.1002/hyp.5145.
- Spence, C., and R. W. Phillips. 2015. Refining understanding of hydrological connectivity in a boreal catchment. Hydrological Processes 29 (16):3491–503. doi:https://doi.org/10.1002/hyp.10270.
- Stuefer, S. L., C. D. Arp, D. L. Kane, and A. K. Liljedahl. 2017. Recent extreme runoff observations from coastal Arctic watersheds in Alaska. Water Resources Research 53 (11):9145–63. doi:https://doi.org/10.1002/2017WR020567.
- Thieler, E. R., E. A. Himmelstoss, J. L. Zichichi, and A. Ergul. 2017. The digital shoreline analysis system (DSAS) version 4.0 an ArcGIS extension for calculating shoreline change (ver. 4.4, july 2017). Reston, VA: U.S. Geological Survey. (Open-File Report No. 2008-1278).
- Whitman, M. S., C. D. Arp, B. Jones, W. Morris, G. Grosse, F. Urban, and R. Kemnitz. 2011. Developing a long-term aquatic monitoring network in a complex watershed of the Alaskan Arctic Coastal Plain. In Proceedings of the Fourth Interagency Conference on Research in Watersheds: Observing, studying, and managing for change, vol. 5169, pp. 15–20. Reston, VA: US Geological Survey.
- Wiens, J. A. 2002. Riverine landscapes: Taking landscape ecology into the water. Freshwater Biology 47 (4):501–15. doi:https://doi.org/10.1046/j.1365-2427.2002.00887.x.
- Wohl, E. 2017. Connectivity in rivers. Progress in Physical Geography: Earth and Environment 41 (3):345–62. doi:https://doi.org/10.1177/0309133317714972.