
ABSTRACT
Calving events of Petermann Glacier, northwest Greenland, in 2010 and 2012 reduced the length of its ice tongue by c. 25 km, allowing exploration of newly uncovered seafloor during the Petermann 2015 Expedition. This article presents the results of foraminiferal analysis and environmental data from thirteen surface sediment samples in northern Nares Strait and Petermann Fjord, including beneath the modern ice tongue. This is the first study of living foraminifera beneath an arctic ice tongue and the first modern foraminiferal data from this area. Modern assemblages were studied to constrain species environmental preferences and to improve paleoenvironmental interpretations of foraminiferal assemblages. Sub–ice tongue assemblages differed greatly from those at all other sites, with very low faunal abundances and being dominated by agglutinated fauna, likely reflecting low food supply under the ice tongue. Fjord fauna were comprised of 80 percent or more calcareous species. Notably, Elphidium clavatum is absent beneath the ice tongue although it is dominant in the fjord. Increasing primary productivity associated with the transition to mobile sea ice, diminishing influence of the Petermann Glacier meltwater with distance from the grounding line, and increased influence of south-flowing currents in Nares Strait are the important controls on the faunal assemblages.
Introduction
Foraminiferal biostratigraphies in sediment archives are important for interpreting arctic paleoceanography and paleoclimate (e.g., Jennings et al. Citation2011; Perner et al. Citation2012; Polyak et al. Citation2013; Seidenkrantz Citation2013). Modern arctic foraminiferal assemblages provide the most secure basis for interpreting past environmental change from fossil assemblages and for establishing the environmental preferences of key species used in paleoenvironmental interpretations. Such modern studies are rare in the Arctic, partly because they rely on collection of surface sediments from remote sites that are difficult to access. Several modern assemblage studies using various size fractions have been reported from the Arctic Ocean (e.g., Lagoe Citation1977; Bergsten Citation1994; Wollenburg and Mackensen Citation1998; Osterman, Poore, and Foley Citation1999; Wollenburg and Kuhnt Citation2000) and the adjacent shelf areas (e.g., Schröder-Adams et al. Citation1990; Jennings and Helgadottir Citation1994; Scott et al. Citation2008), and these studies have demonstrated that arctic benthic foraminifera respond to fluxes of labile and refractory organic matter to the seabed, sedimentation rates, water mass variations, salinity, temperature, turbidity, and water column stratification, all of which are related to sea-ice cover, the presence of marine or terrestrial terminating glaciers, and the advection of Atlantic and polar water, making foraminiferal assemblages valuable for arctic paleoenvironmental reconstructions.
Rapid climate and environmental changes already underway in the Arctic underscore the urgency of gathering modern foraminiferal assemblage data, both to provide modern analogues for past conditions recorded in sediment cores and to provide a baseline to evaluate the faunal responses to rapidly changing arctic cryosphere and ocean conditions. The Petermann Glacier Expedition of Swedish icebreaker Oden in 2015 (OD1507) provided a rare opportunity to study the modern foraminiferal assemblages in a high Arctic setting including sub–ice tongue, fjord, and shelf sites (). This is the first study of living foraminifera beneath an arctic ice tongue and the first modern foraminiferal data reported from Petermann Fjord and northern Nares Strait. The faunal samples have accompanying environmental and sediment parameters (sea-ice conditions, water depth and water column structure, temperature, salinity and oxygen content, distance from the glacier grounding line, length of the ice tongue, grain size, and organic matter and nitrogen content) that provide a basis for reconstructing past environmental changes in sediment cores also collected during OD1507 and to support paleoenvironmental interpretations from other arctic marine sites. This article presents the results of foraminiferal analysis and supporting environmental data from thirteen surface sediment samples in northern Nares Strait and in Petermann Fjord, including two sites from beneath the modern ice tongue ().
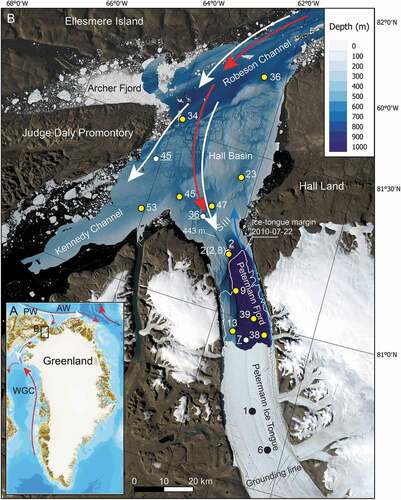
Figure 1. (a). Index map showing the study area location in northern Nares Strait and the general ocean circulation with polar water (PW), depicted by white arrows, and Atlantic water (AW), depicted by red arrows. WGC = West Greenland Current. (b). Location map of the study area showing the Uwitec (black dots) and multicore (yellow dots) site locations against the detailed bathymetry and satellite imagery of the area. The ice tongue margin in 2010 is shown by a white line. Uwitec sites 1 and 6 are at the locations of drill sites DS1 and DS3, respectively, which are the location of conductivity–temperature–depth (CTD) casts DS1 and DS3 of Figure 2. Other CTD stations of are shown by white hexagons with white station numbers underlined. Ocean current colors are as in (a) with the addition of glacial meltwater and runoff depicted by blue arrow exiting Petermann Fjord. Note that AW flows in the subsurface. The image base of the map is a composite of two Landsat 8 images from 11 August 2015 (bands 4, 3, 2) to make an RGB image. The Landsat Scene IDs for the two images for the composite are: LC80372472015223LGN02 and LC80372482015223LGN02
Environmental setting
The sites studied in this work are located north of 80° N in Kennedy Channel, Hall Basin, and Robeson Channel of Nares Strait and in Petermann Fjord (). They are strongly influenced by both sea ice and glacier ice, including meltwater from nearby plateau ice caps and meltwater and icebergs from Petermann Glacier, the largest outlet glacier of the northern Greenland Ice Sheet (Rignot and Mouginot Citation2012) that in 2015 terminated as a 47-km-long floating ice tongue (Münchow et al. Citation2016). The Petermann ice tongue has historically covered most of the Petermann Fjord, extending about 80 km from the grounding zone, but large calving events in 2010 and 2012 reduced it to its current length (Münchow, Padman, and Fricker Citation2014), opening the fjord to research from icebreaker Oden. The seafloor of the area is bathymetrically complex, with several basins formed by underlying bedrock topography and molded by confluent ice streams during previous glaciations (Jakobsson et al. Citation2018; Hogan et al. Citation2020; ).
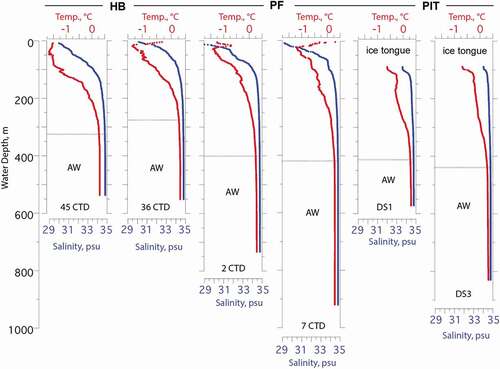
The water column in the region is stratified with cold, low-salinity polar water from the Arctic Ocean forming the upper approximately 50 to 135 m in Nares Strait, overlying relatively warm and saline (~0.3°C, 34.8 psu) water of Atlantic origin, henceforth referred to as Atlantic water (). The polar water enters the Petermann Fjord and was observed beneath the ice tongue in 2002 (Johnson et al. Citation2011) but was found to be limited to the upper 50 m in Petermann Fjord outside the ice tongue in 2015 (Washam et al. Citation2019). The Atlantic water is derived from the Atlantic layer in the central Arctic Ocean, in turn originating from inflows through the Fram Strait and Barents Sea (Rudels et al. Citation2012). Atlantic water from Baffin Bay is blocked by a 220-m-deep sill in southern Nares Strait (Münchow et al. Citation2011; ). The Atlantic water enters Nares Strait from the north and passes over a 443-m-deep sill at the mouth of the Petermann Fjord (Jakobsson et al. Citation2018) to form the bottom water in the fjord (Münchow et al. Citation2011, Citation2016; Johnson et al. Citation2011; Heuzé et al. Citation2017; ). Buoyant glacier meltwater mixes with the Atlantic water as it rises near the Petermann Glacier grounding line to form a transitional layer of glacially modified water above the Atlantic water (Münchow et al. Citation2016; Washam et al. Citation2019). Meltwater and runoff from the Petermann Glacier and ice tongue is concentrated on the northeastern side of the fjord and flows out over the sill into Hall Basin northward along Hall Land; it can be traced throughout Hall Basin (Johnson et al. Citation2011; Heuzé et al. Citation2017; ). Observations have shown that the Atlantic water has become warmer in Nares Strait and the Petermann Fjord over the last decade (Münchow et al. Citation2011; Washam, Münchow, and Nicholls Citation2018). Three sub–ice tongue conductivity–temperature–depth (CTD) casts taken in 2015 show Atlantic water filling the sub–ice tongue cavity with bottom water potential temperatures close to 0.3°C (Washam et al. Citation2019). This Atlantic layer is much colder than what is considered chilled Atlantic water around more southerly Greenland areas influenced by Irminger Current–sourced Atlantic water, where temperatures over 3°C are common (cf. Holland et al. Citation2008; Straneo et al. Citation2012). The ocean heat delivery of the relatively warm Atlantic water to the grounding line of the Petermann Glacier is enhanced by its entrainment in rising subglacial runoff (Washam et al. Citation2019). Under the ice tongue the upper water column is fresher and colder, influenced by meltwater and suspended sediment.
Figure 2. Examples of temperature (red) and salinity (blue) water column profiles from beneath the Petermann ice tongue (PIT), within Petermann Fjord (PF), and in Hall Basin (HB). Locations of conductivity–temperature–depth (CTD) profiles shown in . DS1 and DS3 are the locations of two drill sites through the PIT and are the same locations as 1UW and 6UW, respectively (). CTD data are from Muenchow (Citation2019). AW = Atlantic water as defined by Heuzé et al. (Citation2017). Overlying the AW are various mixtures of polar water, glacial meltwater and runoff, and Atlantic water
Apart from a three- to four-month period of mobile pack ice, landfast sea ice covers northern Nares Strait. The sea-ice regime (i.e., mobile or landfast) is governed by ice arches that form by consolidation of thick multiyear Arctic Ocean sea-ice floes that converge in the Lincoln Sea at the northern end of the strait (Kozo Citation1991) and/or in Kane Basin at the southern end. Ice arches form in late fall and early winter, blocking Arctic sea-ice flow through the Nares Strait (Kwok Citation2005). Ice arch failure in mid-July to mid-August allows sea ice to flow through Nares Strait toward Baffin Bay driven by strong northerly winds (Samelson et al. Citation2006). Sea-ice conditions have become more variable in recent years because ice arch formation has become inconsistent. Years without ice arch formation can result in a longer or even continuous mobile sea-ice season (Kwok et al. Citation2010; Ryan and Münchow Citation2017).
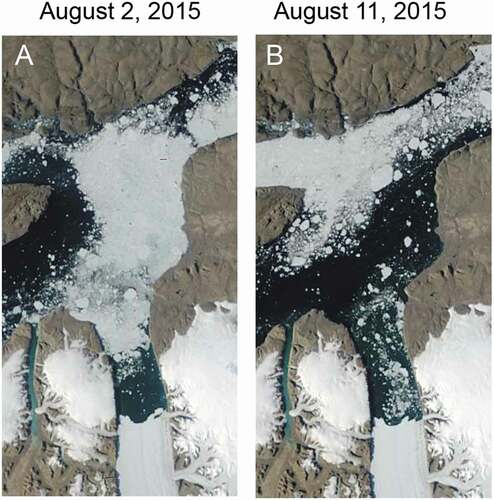
The typical sea-ice conditions for August of 2015 when the samples were collected are illustrated by two selected Terra/MODIS images from EOSDIS Worldview (). By 8 August 2015, the heavy mobile sea ice that had characterized Hall Basin () gave way to mobile sea ice, with low ice cover over the study area (). Petermann Fjord was sea ice covered until 29 July when a nearly ice-free area was established in front of the ice tongue, although the outer fjord had heavy sea ice cover (). By 6 August, there was much diminished sea ice cover in the fjord and Hall Basin, although heavy sea ice lingered at the fjord mouth and along Hall Land. By 8 August, sea ice was concentrated along Ellesmere Island and varied considerably daily with phases of increased mobile ice floes.
Figure 3. Modis satellite images from (a) 2 August and (b) 11 August 2015 showing the main changes in sea-ice conditions during OD1507 when the seabed samples were taken. Images courtesy of the NASA Worldview application (https://worldview.earthdata.nasa.gov/)
Polar night falls in early October and persists until late March, limiting the period of primary productivity in the surface ocean and delivery of fresh food to the seafloor.
Materials and methods
The seven coring sites in Petermann Fjord include two modified Uwitec cores recovered beneath the floating ice tongue (cf. Makinson and Anker Citation2014) and five multicores beyond the ice tongue (). In addition, multicores were collected from six sites in Nares Strait (Hall Basin, northern Kennedy Channel, and southern Robeson Channel; ). The sub-ice tongue surface sediment samples were suctioned with a pipette from the top 2 cm of the Uwitec core tubes and placed in a buffered solution (storage solution) comprising 70 percent distilled water and 30 percent alcohol (by weight), 1 g baking soda (sodium bicarbonate), and 1 g of rose bengal stain to preserve the foraminifera and to stain living specimens. For all of the other sites, a multicore tube (eight tubes were recovered at each site) with a clearly defined sediment–water interface was selected for study of the foraminifera. On deck, the uppermost 1 to 2 cm of sediments was extruded and sliced from the top of the tube and placed in a screw cap vial with the storage solution. The level of the sediment was marked on the vials to provide a later measurement of the sediment volume. Sample volumes ranged from 6 to 35 ml. The vials were kept in cold storage until processing. Twelve multicores at eleven sites were sampled, including two of the multicore tubes from site 2MC (2MC-02 and -08; ) in order to provide a duplicate analysis at the first site.
Samples were taken from the tops of two additional multicore tubes from site 39MC (39MC-04 and -06) in support of studies of sediment accumulation rates using 210Pb profiles (Reilly et al. Citation2019). For 39MC-04, a sample from 0 to 5 cm was stained for foraminifers; from 39MC-06, 1-cm-wide samples at 5-cm intervals were stained and analyzed to determine whether benthic foraminifers were living at depth in the sediments. These studies provide information on the depth in sediment of living fauna; the results are presented in Table S1.
Foraminiferal analysis of the surface samples was completed in the Micropaleontology Laboratory at INSTAAR, University of Colorado. The stained samples were washed through a sieve with 63-µm-mesh size. The >63 µm fraction was stored in a buffered solution (70 percent distilled water and 30 percent alcohol [by weight] and 1 g baking soda) to keep the pH close to 8.4. Foraminiferal assemblage analysis of these samples was carried out in the buffered solution in a foraminiferal picking tray under a binocular microscope. A wet splitter that divided a sample into eighths was used to provide a representative split of any samples that contained abundant foraminifera; a target count of at least 300 specimens was desired. The full sample was counted in cases in which foraminifera amounted to fewer than 300. Despite counting the full sample, the samples beneath the ice tongue, 06UW and 01UW, yielded only 58 and 203 specimens, respectively. Otherwise, the number counted and identified to genus and species ranged between 308 and 3199 specimens. In most samples more than 700 specimens were identified, counted, and expressed as percentages.
A freeze-dried bulk sediment sample from each of the original eleven multicore sites (twelve samples) was analyzed for carbon and nitrogen content at Oregon State University. The samples were acidified with 10 percent HCl in glass vials to remove carbonate. After each addition of HCl the samples were dried in a 50°C oven. This process of acidification and drying was carried out at least three times or until the sample did not fizz when more acid was added after drying. The percentage organic C and percentage total N were then obtained using an ECS 4010 Costech Elemental Analyzer.
Another subset of freeze-dried samples was analyzed for sediment grain size. The samples were wet sieved to remove clasts larger than 2 mm, treated with H2O2 to oxidize organic matter, and dispersed in sodium metaphosphate before particle size analysis (0.01–2,000 μm) on a Malvern Mastersizer 3000 laser diffraction particle size analyzer. The grain size data were analyzed using Gradistat (Blott and Pye Citation2001).
Multivariate Statistical Package was used to examine the associations among species and sites (Kovach Citation1998) in the total fauna (living and dead combined) using cluster analysis and principal component analysis (PCA) on the square root–transformed species assemblage data using all species with at least 2 percent in at least one sample. We use statistics on the total assemblage, rather than the living or dead fauna separately, because we feel that the total assemblage most reliably reflects the overall environmental conditions in the study area (cf. Scott and Medioli Citation1980) and thus will best aid interpretation of paleoenvironmental conditions from assemblages in sediment cores from the area that is in progress.
Results
Environmental data
shows environmental parameters that characterize the thirteen sites, including water depth, median grain size, weight percentage of sand (>63 µm), weight percentage nitrogen and organic carbon, as well as bottom water potential temperature and salinity (). Not all of these parameters could be measured at the two sub–ice tongue sites because surface sediment was limited (). These parameters aid in evaluating variations in the physical environment that might influence the composition of the foraminiferal assemblages.
Table 1. Environmental data and location information for OD1507 multicore and Uwitec core tops
The modern seafloor samples are from water depths ranging between 517 and 1,064 m, all are bathed in Atlantic water. Bottom water temperatures at or near these sites vary only slightly between 0.27°C to 0.3°C and bottom salinities also vary slightly from 34.77 to 34.82 psu. The seafloor sediment samples have very low nutrient contents, with nitrogen values between 0.01 and 0.04 percent by weight, with the highest values from the two sites in Nares Strait farthest from the grounding line (). Organic carbon values also were extremely low, ranging between 0.10 and 0.23 percent by weight, with the highest values outside the fjord. The very low nitrogen and carbon values suggest that the area is oligotrophic with benthic organisms relying on episodic plankton blooms during the short productivity season (cf. Wollenburg and Mackensen Citation1998).
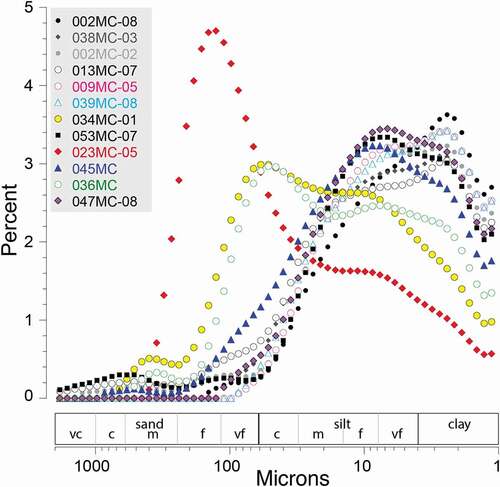
Grain size spectra for all multicore tops are shown in ; grain size data are not available for the sub–ice tongue surface samples. Median grain size ranges from clay to very fine silt with low sand percentages in the fjord (2-08, 2-02, 38, 13, 9, and 39MC). The grain size distributions are consistent with suspension of fine sediment in meltwater plumes as the primary sedimentation process in the fjord. The lack of coarse sediment is likely due to strong sub–ice shelf melting that removes coarse material near the grounding zone (Cai et al. Citation2017; Reilly et al. Citation2019). Samples 34 and 36MC in Nares Strait have fairly high sand percentages and coarser median grain sizes in medium silt to very fine sand, attesting to the stronger influence of ocean currents and mobile sea ice in Nares Strait (). Samples 45, 47, and 53MC in Hall Basin and Kennedy Channel have grain size distributions between these two areas, likely reflecting combined influences of suspended sediments, ice rafting, and current winnowing (). The cause of the high sand content of 23MC is unknown ().
Figure 4. Grain size spectra of the multicore tops showing the distribution of particle sizes between 2,000 and 1 µm on a log scale. Grain size divisions of sand, silt, and clay are shown along the x-axis. Further grain size subdivisions of sand and silt are vc = very coarse, c = coarse, f = fine, vf = very fine. Samples are listed in order of distance from the grounding line
Foraminifera
Eighty-three benthic foraminiferal species were identified, including twenty-eight agglutinated species and fifty-five calcareous species (, Plates 1 and 2; Table S1). Three planktonic species were encountered (; Table S1) but the planktic foraminifera were overwhelmingly dominated by the arctic species
Table 2. Foraminiferal taxa identified in this study with their original reference. Calcareous and agglutinated species are separated and listed alphabetically. Referral to the plate and number is provided if taxa are illustrated herein
Neogloboquadrina pachyderma (Np)
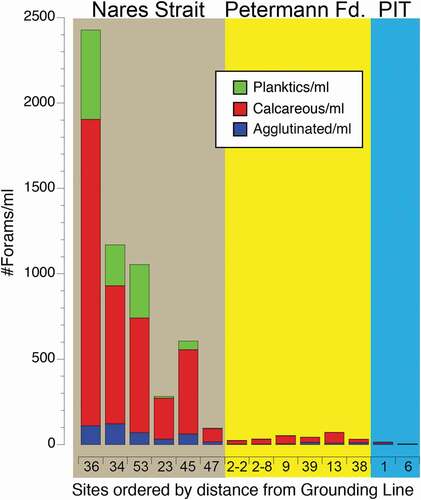
Dextrally coiled specimens of Np amounted to 4.9 percent of the planktic foraminifera in two samples from Nares Strait (47 and 36MC) but were less than 2.4 percent in all other samples. We consider the dextrally coiled specimens to be aberrant specimens of Np (Darling et al. Citation2006). Foraminiferal abundances per milliliter of wet sediment were lowest under the ice tongue followed by slightly higher abundances in the fjord; foraminiferal abundances at sites outside the fjord were an order of magnitude higher, particularly in Robeson Channel site 36MC, which had twice the foraminifera/ml of sediment of any other site (). Planktonic foraminifera were much more common outside the fjord but were present in all samples except the sample closest to the grounding line under the ice tongue (06UW; ). Given the lack of light for primary production under the ice tongue, we assume that any planktonic specimens found beneath the ice tongue were advected there by currents entering the sub–ice tongue cavity from the fjord. Benthic foram abundances were higher outside the fjord but the increase was much greater in the calcareous than in the agglutinated fauna ().
Figure 5. Histogram showing the numbers per milliliter of wet sediment of planktonic (green), calcareous benthic (red), and agglutinated benthic (blue) foraminifera from sites in Nares Strait (brown background), Petermann Fjord (yellow background), and beneath the Petermann Ice Tongue (PIT; blue background). Sites are arranged by distance from the Petermann Glacier grounding line. Site locations shown in
Calcareous foraminifera make up between 82 and 94 percent of the benthic fauna except for sites beneath the ice tongue where agglutinated foraminifera make up nearly 50 percent of the fauna (). Sites 38 and 39MC, very near the ice shelf front, also had elevated percentages of agglutinated fauna. All surface samples but one had living (brightly stained) foraminifera, with ratios ranging between 0.06 and 0.65 of the total (living + dead [unstained]) fauna (). Living specimens of Stetsonia horvathi, Elphidium clavatum, and Cibicidoides wuellerstorfi were found embedded in organic “fluff” (, no. 24).
Figure 6. Histograms showing the percentages of (a) agglutinated foraminifera, (b) calcareous foraminifera, and (c) the proportion of living (stained) foraminifera from the fourteen sites arranged by distance from the Petermann Glacier grounding line; color blocks as defined in . Darker colors in (a) and (b) represent the living component and lighter colors represent the dead (unstained empty test) component of the total calcareous and agglutinated benthic foraminifera. PIT = Petermann Ice Tongue. Site locations shown in
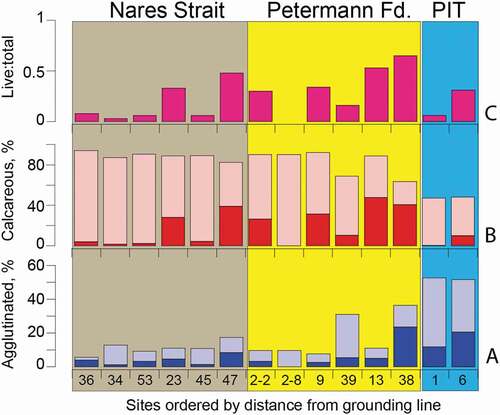
At 2MC in the outer fjord, we prepared surface samples from two multicore tubes (2MC-02 and -08) in order to compare samples from the same site. We found that whereas subcore 08 had a live : total ratio of 0.3, subcore 02 had no living fauna at all (). This finding suggests that subcore 02 was missing the sediment–water interface, although the total faunal composition of the two samples is very similar (). Because we did not subsample the multicores every centimeter downcore, we do not know how deep the foraminifers live in the sediment. But, at 39MC where we analyzed two additional subcore tops (39MC-04 and -06) in support of 210Pb analysis, we found 16 percent living fauna in 39MC-08, no living fauna in 0 to 1 cm of 39MC-06, and 23 percent living fauna in the 0- to 5-cm interval of 39MC-04. These data suggest but do not prove that the living fauna are limited to the uppermost sediments and are not deep dwelling, which is consistent with the low food resources in the sediments (39MC-06 and -04 data; Table S1; cf. Jorissen, de Stigter, and Widmark Citation1995).
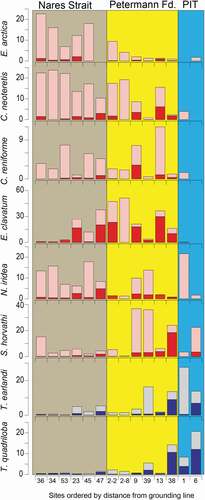
Figure 7. Histograms showing percentages of species along a transect organized by increasing distance from the Petermann Glacier grounding line. Sites are shown in . Color blocks as defined in . Red histograms are calcareous species, with the dark color representing the rose bengal stained (living) component. Blue histograms represent agglutinated species, with the dark color representing the rose bengal stained (living) component
Dominant species
shows histograms of the eight most common calcareous and agglutinated benthic species in the sites ordered by distance from the grounding line of the Petermann Glacier (). The sites beneath the ice tongue are dominated by the small agglutinated taxa Trochammina quadriloba and Textularia earlandi (). Stetsonia horvathi () was also found living beneath the ice tongue and in the inner fjord ().
These three species also are common in sites 38 and 39MC in the deep fjord near the ice shelf front. Rhizammina algaeformis () also is common beneath the ice tongue but has poor potential for preservation after death and in sediment cores. This species fragments easily and was counted only when it included branching as shown in .
Calcareous species dominate the assemblages beyond the inner fjord sites and in the shallower site 13MC. S. horvathi and E. clavatum were the most abundant species in the fjord and have high living components, but they have different distributions. Stetsonia horvathi is the most common species in the inner part of the fjord (38, 39, and 9MC) but is much lower in relative abundance elsewhere. At 38MC where there were many living specimens, they were found embedded in organic fluff, consistent with an opportunistic life strategy dependent on food flux from the surface ocean. This tiny species is common in the Arctic Ocean in the oligotrophic environment beneath perennial sea ice (Wollenburg and Mackensen Citation1998). Elphidium clavatum (Darling et al. Citation2016) is common in unstable, glacial marine environments characterized by turbid glacial meltwater (Hald et al. Citation1994). E. clavatum was common in the fjord and had high stained proportions, suggesting that our sampling coincided with a bloom of this species. The highest percentages occurred in the outer fjord and in sites 47 and 23MC in Nares Strait. Unlike other common fjord-dwelling species, only one dead specimen was found under the ice tongue even though there were abundant living and dead specimens near the ice tongue margin (). This observation is consistent with Vilks’ (Citation1980) assertion that this species does not live beneath perennial ice.
Cassidulina neoteretis occurs in all samples except the sample closest to the grounding line. It is common in the outer fjord and is abundant outside the fjord, especially at sites 34 and 36MC where it is the dominant species. Consistent with its distribution in the study area, C. neoteretis is associated with chilled Atlantic water stratified beneath colder and fresher polar water (Jennings and Helgadottir Citation1994) and with the Atlantic layer in the Arctic Ocean (Wollenburg, Knies, and Mackensen Citation2004). In addition, it has been considered to be an opportunistic phytodetritus feeder (Gooday and Lambshead Citation1989).
Epistominella arctica is most common outside of the fjord, although it is present at low percentages in the fjord (). Its distribution in the Arctic Ocean is associated with peaks in phytodetritus deposition in an overall oligotrophic environment (Wollenburg and Mackensen Citation1998), and we assume similar associations in Nares Strait beneath the mobile sea ice. Nonionella iridea is a small, fragile species that is widespread in the study area and was found living at all sites. It is most common outside the fjord, although it makes up a large proportion of the sub–ice tongue fauna, possibly suggesting that its light, inflated test is prone to entrainment and advection by currents entering the sub–ice tongue cavity. N. iridea has been considered to be a phytodetritus feeder (Gooday and Hughes Citation2002), but it lives as well on bacterial populations developed in the phytodetritus (Duffield et al. Citation2015). Cassidulina reniforme is a common arctic species that often occurs with Elphidium clavatum in glaciomarine environments (Hald et al. Citation1994). Its highest living abundance is in 9MC in association with E. clavatum, but it is present in all samples except the site closest to the grounding line ().
Accessory species
Melonis barleeanus was rare in the study area. A few living specimens were found in 09 and 02-2MC as well as one in 53MC in Nares Strait. M. barleeanus did not exceed 0.4 percent in any sample, which is consistent with the evidence of little food to support infaunal species. Cibicidoides wuellerstorfi was found in low numbers in several of the fjord samples and in 34MC in Nares Strait. This species is common from 1,000 to 3,000 m in the Arctic Ocean (Osterman, Poore, and Foley Citation1999). Bolivina arctica is a tiny species that was limited to the fjord and in 34MC in Nares Strait. Parafissurina spp. are widespread auxiliary species. Stainforthia feylingi, a tiny species, was rare. Buccella frigida was widespread in the fjord, including a live specimen under the ice tongue, but it was not found in Nares Strait. Buliminella elegantissima, a tiny species, was a widespread accessory species in the study area. A single dead specimen was found in the inner sub–ice tongue sample (6UW). It was rare in the fjord and more common in Nares Strait. Glomulina oculus was found in every sample but stained specimens were most abundant near the ice shelf front and in 47 and 23MC. Ceratobulimina arctica, a tiny calcareous species, was found in every sample. Two living specimens were found under the ice tongue at site 06UW and sixty-four living specimens were found in 38MC in front of the ice tongue.
Measures of diversity
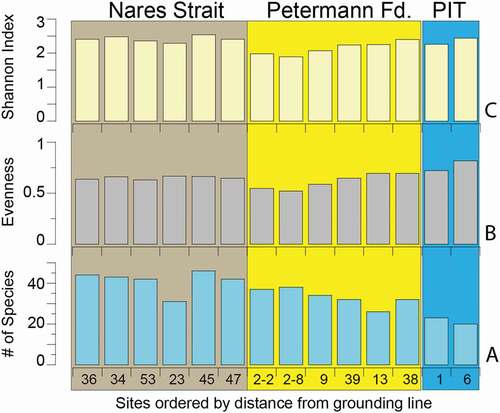
Three measures of diversity in the foraminiferal populations at each site were taken on the total (living and dead) faunal data set using Multivariate Statistical Package (). Species richness, S (), is the number of species at each site calculated without regard to relative abundances. Species richness ranged from 20 to 46, with the lowest numbers of species beneath the ice tongue and rising generally with distance from the grounding line out the fjord and into Nares Strait. Evenness, E (), is an indication of how similar the abundances of all species are in the assemblage. The sub–ice tongue sites are the most equitable (0.82 and 0.72) even though they have lowest species richness (twenty and twenty-three species). Evenness is highest beneath the ice tongue because there were many species with low abundance. The decline in evenness along the fjord is caused by the strong dominance of S. horvathi in the inner to middle fjord, followed by dominance of E. clavatum and C. neoteretis in the outer fjord. In the outer fjord and beyond, evenness changes very little. Shannon’s diversity index, H, takes into account the relative abundances of species and also considers the evenness or equitability of their distributions. H ranges between 2.26 and 2.54, with the maximum possible value, Hmax, of 7.8 (Miller and Kahn Citation1962). The highest H values occur in Nares Strait and in the site closest to the grounding line beneath the ice tongue. The lowest H values (1.89 and 1.98) and evenness (.52 and.55) were found in the outer fjord samples at 02MC-08 and -02 where E. clavatum and C. neoteretis were dominant, but the number of species observed was still high (twenty-six to thirty-eight species). The relatively low values for H% (≤33 percent), a measure of how close to Hmax each sample is, are primarily a function of the large number of taxa (ninety-two categories including species and other groups; Table S1) that were included in the calculation. Notwithstanding this limit, diversity is quite high, but the dip in H values reflects the increased dominance of a few species in the middle to outer fjord.
Figure 8. Histograms showing measures of diversity from the fourteen sites arranged by distance from the Petermann Glacier grounding line. (a) Species richness or number of species, S; (b) Evenness, E; and (c) Shannon Index, H. PIT = Petermann Ice Tongue. Site locations shown in . Color blocks as defined in
Cluster analysis
Cluster analysis by species (R-mode) breaks the species into two main clusters that are subdivided into two subclusters (). Cluster 1 contains most of the dominant species. Cluster 1a comprises T. earlandi, T. quadriloba, S. horvathi, and Ceratobulimina arctica. We surmise that these species have low trophic requirements. C. arctica belongs in this cluster because like the other species in cluster 1, it has a strong presence beneath the ice tongue and in the environment near the ice shelf front and is present at low percentages (c. 1.5 percent or less) in the other samples (Table S1).
Figure 9. R-mode cluster dendrogram showing two major clusters of species (C1 and C2) as well as the division of C1 into C1a and C1b
In cluster 1b, opportunistic species Nonionella iridea and E. arctica and chilled Atlantic water species C. neoteretis were closely correlated, dominating the environments outside of the fjord, as their distributions in show. Elphidium clavatum is part of this cluster but is joined at such a great variance that it essentially forms its own cluster dominating the fjord and extending into the near-fjord mouth portions of Hall Basin ().
Cluster 2a comprises the auxiliary species Glomulina oculus (n. sp. Jennings et al. Citation2020), Portatrochammina bipolaris, and Buliminella elegantissima that group closely with Cibicides lobatulus and Cassidulina reniforme (). All of these species except for C. reniforme occur in larger percentages outside of the fjord. Cluster 2b comprises the other auxiliary species.
Cluster analysis of the sites (Q-mode; ) shows that the sub–ice tongue sites (01, 06) and site 38 immediately in front of the ice tongue form cluster C1 and are very different from all of the other sites. The sites in Nares Strait (53, 34, 36) form a distinct cluster, C3, that is more similar to the sites in the fjord and remaining Nares Strait sites than it is to the sub–ice tongue cluster (). All of the remaining sites in the fjord and the three sites immediately outside of the fjord (45, 47, 23) form a two-part cluster. Sites 13, 39, and 09, in the central fjord form subcluster C2a, although sites 39 and 09 are more similar to one another than to the far shallower site 13. Outer fjord samples 02-08 and 02-02MC are very similar to one another and to 47MC, located just beyond the sill, and to sites 23 and 45 MC immediately outside the fjord and form subcluster C2b ().
Figure 10. Q-mode cluster dendrogram showing the three main clusters of sites (C1, C2, C3) that represent major geographic areas. Cluster 2 is represented by two subclusters, C2a and C2b
Principal component analysis
PCA analysis yielded six components with eigenvalues greater than 1, but we limit our interpretation to the first two components. Axis 1 explains 37 percent of the variance; it is interpreted to separate oligotrophic sites such as those beneath the ice tongue from the sites in Nares Strait and outer fjord under the mobile sea ice that we presume are associated with greater phytoplankton blooms and export to the seabed (). C. neoteretis has the highest positive variable loading on Axis 1. C. neoteretis is associated with phytoplankton blooms (cf. Gooday and Lambshead Citation1989) and with stratified water column with chilled Atlantic water overlain by polar water and sea ice (Jennings and Helgadottir Citation1994; Wollenburg, Knies, and Mackensen Citation2004). The agglutinated species Textularia earlandi and Trochammina quadriloba have high negative loadings on Axis 1 along with the oligotrophic calcareous species Stetsonia horvathi found beneath perennial sea ice in the Arctic Ocean (Lagoe Citation1977; Wollenburg and Mackensen Citation1998; Wollenburg and Kuhnt Citation2000). Agglutinated taxa are considered to have low trophic requirements (Jernas et al. Citation2018). For example, T. earlandi has been shown to thrive for at least two years without input of labile organic matter, whereas under these same food deprived conditions, calcareous species reliant on phytodetritus diminished greatly in abundance (Alve Citation2010). The sub–ice tongue sites and innermost fjord sites (38 and 39MC) have high negative scores on Axis 1, whereas the sites in Nares Strait and in the outer fjord and along Hall Land have positive scores on Axis 1.
Figure 11. PCA biplot showing site scores and species loadings on PC Axes 1 and 2
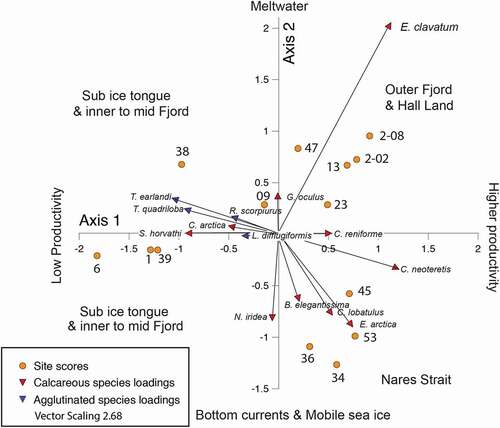
Axis 2 explains 25 percent of the variance. It separates lower energy sites with glacier meltwater influence from sites under a stronger current regime with mobile sea ice (). Elphidium clavatum has high positive loadings on Axis 2. E. clavatum dominates environments with reduced salinity, cold temperatures, and high turbidity, conditions associated with glaciomarine environments (Hald et al. Citation1994). In the data set, E. clavatum is highest at the sites with finer grain sizes associated with turbid meltwater plumes. Glomulina oculus, a new species first described from the OD1507 samples, is associated with glaciomarine conditions (Jennings, Seidenkrantz, and Knudsen Citation2020) and also has positive loadings on Axis 2. Epistominella arctica has the highest negative loadings on Axis 2. This species is found in the Arctic Ocean in an overall oligotrophic environment where it reproduces in response to pulsed phytoplankton blooms (Wollenburg and Kuhnt Citation2000). This type of environment is consistent with Nares Strait where phytoplankton blooms occur during the brief mobile sea ice season. Nonionella iridea has the second most negative loadings on Axis 2. This species has been suggested to respond opportunistically to phytodetritus (Gooday and Hughes Citation2002), but it has been shown in laboratory experiments to feed on degrading organic matter and bacteria associated with organic matter degradation (Duffield et al. Citation2015). Duchemin et al. (Citation2005) suggested that it can live through periods of low food supply but only dominates the assemblage in response to pulsed phytodetritus delivery to the seabed. N. iridea was not among the species with high loadings on Axis 1.
The site scores on Axis 1 separate the four sites closest to the grounding line (two under the ice tongue) from all of the other sites. The Nares Strait sites have negative scores on Axis 2 and are aligned with the species associated with episodic marine productivity, whereas the sites in the fjord and site 47 outside the sill and site 23 along Hall Land have positive scores, along with the rest of the fjord sites. This group of sites is clearly aligned with Elphidium clavatum as well as Glomulina oculus, suggesting an association with glaciomarine conditions.
Discussion
Environmental influences on foraminiferal assemblages
There are distinct assemblage changes associated with site locations in the data set, suggesting strong environmental influences on the foraminifera. indicates very little variation in the temperature and salinity of bottom water throughout the study area. The water properties suggest that Atlantic water strongly influences the sampled depth range (). All sites have very low organic carbon and nitrogen contents, indicating that the whole study area is on the oligotrophic end of environments, although the sites outside of the fjord, particularly those most closely associated with the mobile sea ice, have greater nutrient content (). The living component of several key species in the study area suggests that species were blooming at the time the samples were taken in response to the opening of the ice cover and production and export of phytodetritus. Results of the PCA implicate differences in food supply as a primary source of assemblage variations among the sites (). The flux of phytodetritus to the seabed during brief periods of productivity has been shown to be a primary forcing on benthic foraminiferal assemblages in the Arctic Ocean (Wollenburg and Kuhnt Citation2000), and this appears to extend as well to northern Nares Strait and Petermann Fjord. With its very thick ice cover, the sub–ice tongue environment is presumably the most severely oligotrophic (). Its low faunal abundances and the dominance of agglutinated species are consistent with the very low food supply that must arrive by current advection into the sub–ice tongue cavity from the fjord beyond the ice shelf. Two sites immediately in front of the ice tongue have assemblage characteristics similar to the sub–ice tongue sites, indicating very low food supply near the ice front as well. Site 13MC, also near the ice tongue but on the western side of the fjord and in shallower water, is much more similar to the other fjord sites (). Beyond the ice shelf, prominent numbers of stained Elphidium clavatum, as well as several other species (), some of which were embedded in surface fluff with organic matter (e.g., , no. 24, Cibicidoides wuellerstorfi; also observed but not photographed were Stetsonia horvathi and E. clavatum), indicate recent delivery of fresh organic matter to the seabed coincident with the time the multicores were taken. In Nares Strait, the greatly increased abundances of foraminifera, including a living component, suggest greater productivity beyond the fjord and beneath the mobile sea ice (). Given the slight increase in percentage Corg outside the fjord we infer that marine productivity is greater in Nares Strait than it is in Petermann Fjord. Although we do not have firm data on the depth of infaunal foraminifera, the extremely low occurrences of infaunal species such as Melonis barleeanus (Caralp Citation1989; Linke and Lutze Citation1993) support the idea that living fauna are mostly at or near the surface.
The spread of sites and species along PCA Axis 2 implicates the influences of currents and turbid glacial meltwater on the foraminiferal assemblages. Sediment accumulation rates in the fjord are rather high in the deep basin of the inner fjord at 38MC, with an estimated rate of 0.3 to 1 cm a−1 from 210Pb analysis owing to sediment input events at this site. Overall Holocene rates from radiocarbon-based analyses in cores free of downslope deposits are about 0.06 cm a−1 (Reilly et al. Citation2019), indicating that side glaciers and proximity to the grounding line of Petermann Glacier produce time and site variable sedimentation rates. CTD measurements indicate that glacial meltwater preferentially exits the fjord on the eastern side and turns northward along Hall Land as it exits (Heuzé et al. Citation2017; ). This pattern may explain the strong signal of the glaciomarine species Elphidium clavatum (Hald et al. Citation1994) and Glomulina oculus n. sp (Jennings, Seidenkrantz, and Knudsen Citation2020) in the fjord, beyond the fjord mouth and northward to 23MC (). The sites in Hall Basin to the south of the fjord mouth and within the mobile sea ice environment have associations with stronger bottom currents supported by the presence of current dwelling Cibicides lobatulus (). The increase in sand percentages and coarser mean grain sizes at these sites are consistent with stronger currents, ice rafting, and reduced influence of fine material deposited from turbid meltwater.
Sub–ice tongue foraminifera
Because of the lack of light to support marine productivity at the sea surface, foraminifers in the sub–ice tongue environment subsist on very low food supply advected beneath the ice shelf from the fjord. Limited by low food supply, the sub–ice tongue fauna occur in very low abundance, have fewer species, and are dominated by the arctic agglutinated species Textularia earlandi, Trochammina quadriloba, and Rhizammina algaeformis and calcareous species Stetsonia horvathi and Ceratobulimina arctica. Faunal abundances decrease toward the grounding line and with increasing distance beneath the ice shelf cavity. Given that the bottom water temperatures and salinities beneath the ice tongue are very similar to those outside, we suggest that low food supply is the main cause of the low abundance of fauna with low trophic requirements. These characteristics highlight faunal reliance on sparse food advected into the sub–ice tongue cavity by Atlantic water from areas beyond the front of the ice tongue. Cluster analysis shows that the sub–ice tongue sites, including the site nearest to the ice front, group together and are only distantly associated with any of the other sites (). Important for paleo reconstructions is the pronounced exclusion of Elphidium clavatum from under the ice tongue, even though it is abundant in the adjacent areas of the fjord. Together, low faunal abundance and dominance of agglutinated species and other low trophic requirement species as well as the exclusion of Elphidium clavatum are the characteristics of an arctic sub–ice tongue foraminiferal fauna. Rhizammina algaeformis has low preservation potential, so it would not be part of the assemblage preserved in sediment cores. A living specimen of Buccella frigida was found in 06UW, but this species was rare in the study area, never exceeding 4 percent of the total fauna. Empty tests of Nonionella iridea were found beneath the ice tongue. Given that no living specimens were found, we suspect that these specimens were advected beneath the ice tongue but do not live there. Advection of other thin-walled, inflated species, such as Epistominella arctica, might also be explained in this way.
Petermann Fjord
The middle fjord is dominated by the oligotrophic species Stetsonia horvathi, whose low trophic requirements suggest that the middle fjord receives/produces limited fresh food for export to the seabed. However, the large component of living Elphidium clavatum and S. horvathi suggests a recent bloom of these opportunistic species in response to fresh export of labile organic matter. Potentially this bloom was associated with the formation on 2 August of the sea ice–free area in front of the ice tongue (). The high dead percentages of these same species suggest that blooming of these species in the short productivity season is typical of the area. A third cluster encompasses the outer fjord site and the sites immediately outside the fjord and along Hall Land. These sites have a strong component of the glaciomarine-associated species E. clavatum, which may align with the outflow of meltwater and suspended sediment from Petermann Glacier (Heuzé et al. Citation2017).
Nares Strait and the mobile sea-ice belt
The three sites in Nares Strait are distinct in their faunal composition. They are the farthest from the Petermann Glacier influence and underlie the mobile sea-ice belt. The three dominant species (Cassidulina neoteretis, Epistominella arctica, and Nonionella iridea) all are related to episodic phytodetritus production or the related bacterial populations, in an overall oligotrophic environment (Gooday and Hughes Citation2002; Wollenburg, Knies, and Mackensen Citation2004; Alve Citation2010; Duffield et al. Citation2015). The high numbers of foraminifera per milliliter of sediment along with abundant Np suggest much higher productivity at these sites, although the living component ranked among the lowest (). This observation supports the interpretation of episodic productivity associated with broken-up sea ice in an overall oligotrophic environment ascribed to these species, especially when they occur in high abundances.
Conclusions
Modern living and total (living + dead) foraminiferal fauna from surface sediments (multicore tops) in northern Nares Strait and Petermann Fjord, including samples from beneath Petermann ice tongue were studied to gain understanding of the associations between the high Arctic environments and species assemblages. Cluster analysis of the species data shows distinct assemblages associated with (1) the sub–ice tongue environment, (2) the inner fjord, (3) the outer fjord and eastern Hall Basin, and (4) Nares Strait. PCA results indicate that marine productivity modulated by sea ice and glacier ice cover (ice tongue and mobile sea ice) is the primary control over variations in the species assemblages. However, the influence of turbid meltwater and the low energy environment in the fjord and along eastern Hall Basin vs. the higher energy conditions in Nares Strait under the mobile sea-ice regime further explains variance in the assemblage data. The sub–ice tongue environment had low abundance assemblages dominated by the agglutinated species Textularia earlandi and Trochammina quadriloba and calcareous species Ceratobulimina arctica and Stetsonia arctica. These small species have low trophic requirements that allow them to live on food advected into the sub–ice shelf cavity by currents from beyond the ice shelf front and on bacteria and degradation products of this organic matter (cf. Alve Citation2010). To sum up, the sub–ice tongue faunal characteristics include low faunal abundance, dominance of agglutinated species and other low trophic requirement species, and exclusion of Elphidium clavatum. The fjord sites had greater faunal abundances and increasing calcareous fauna and were dominated by Elphidium clavatum, which was not found living beneath the ice tongue; E. clavatum along with G. oculus were associated with glacial meltwater in the fjord, near the fjord mouth and northward along Greenland. Much greater faunal abundances and increased abundance of planktonic foraminifera (Np) characterize the Nares Strait assemblages. The characteristic Nares Strait species are Cassidulina neoteretis, Epistominella arctica, and Nonionella iridea. These species are associated with spikes in marine productivity that punctuate the brief period of mobile sea ice. These distinct faunal associations provide a clear basis to interpret sub–ice tongue, meltwater-dominated, and mobile sea-ice regimes from sediment cores.
Plate 1. Examples of agglutinated foraminifera from OD1507 surface samples as light microscope photographs. Pink colored specimens were alive at the time of collection. 1 = Lagenammina difflugiformis, 6UW. 2 = Textularia earlandi, 6UW. 3 = Textularia torquata, 45MC. 4 = Pseudobolivina antarctica, 45MC. 5a, 5b = Portatrochammina bipolaris dorsal (5a) and umbilical of a different specimen (5b), 38MC. 6 = Reophax scorpiurus, 39MC. 7a, 7b = Trochammina quadriloba dorsal (7a) and umbilical (7b), 39MC. 8 = Rhizammina alageformis, 39MC. 9a, 9b = Trochammina nitida dorsal (9a) and umbilical (9b). 10 = Trochammina quadriloba umbilical, 6UW. 11 = Reophax catenata, 13MC. 12 = Reophax subfusiformis, 38MC. 13 = Reophax bilocularis, 39MC. 14 = Silicosigmoilina groenlandica, 9MC. 15 = Reophax dentaliniformis, 47MC. All scale bars are equal to 50 µm and are placed at the bottom left of each photo
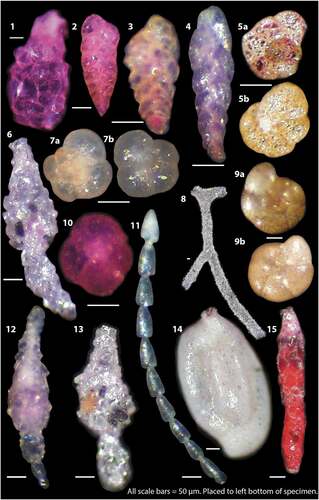
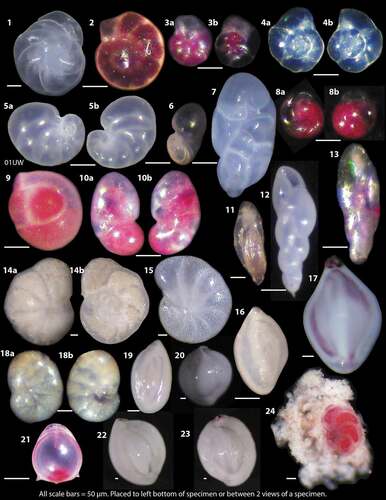
Plate 2. Examples of calcareous benthic foraminifers from OD1507 surface samples as light microscope photographs. Pink colored specimens were alive at the time of collection. 1 = Cassidulina neoteretis from 09MC. 2 = Elphidium clavatum (live) from 09MC. 3a, 3b = Stetsonia horvathi, umbilical (3a) and dorsal (3b) sides from 38MC. 4a, 4b = Stetsonia horvathi, dorsal (4a) and spiral (4b) sides from 39MC. 5a, 5b = Nonionella iridea, spiral (5a) and umbilical (5b) sides from 1UW. 6 = Nonionella iridea apertural view from 47MC. 7 = Robertinoides charlottensis, 39MC. 8a, 8b = Epistominella arctica, apertural (8a) and dorsal (8b) from 53MC. 9 = Glomulina oculus with three chambers from 47MC. 10a, 10b = Ceratobulimina arctica spiral (10a) and apertural (10b) views from 9MC. 11 = Buliminella elegantissima, 47MC. 12 = Stainforthia concava, 9MC. 13 = Stainforthia feylingi, 13MC. 14a, 14b = Cibicides lobatulus, umbilical (14a) and dorsal (14b) views, 53MC. 15 = Melonis baarleeanus, 36MC. 16 = Triloculina trihedra, juvenile, 34MC. 17 = Triloculina trihedra, adult 45MC. 18a, 18b = Valvulineria arctica, dorsal (18a), umbilical (18b), 45MC. 19 = Quinqueloculina sp. 23MC. 20 = Quinqueloculina akneriana, 09MC. 21 = Parafissurina arctica, 9MC. 22 = Quinqueloculina seminulum, 23MC. 23 = Quinqueloculina arctica, 23MC. 24 = Cibicidoides wuellerstorfi, 38MC. All scale bars are equal to 50 µm and are placed at the bottom left of each photo
Supplemental Material
Download Zip (31.6 KB)Acknowledgments
We thank the captain and crew of icebreaker Oden and the scientific party of OD1507 and the BAS ice shelf drilling team and Lawrence Dyke for their help in obtaining the samples. We thank Professor Marit-Solveig Seidenkrantz and an anonymous reviewer for their helpful critique of the manuscript. We acknowledge the use of imagery from the NASA Worldview application (https://worldview.earthdata.nasa.gov/), part of the NASA Earth Observing System Data and Information System (EOSDIS).
Disclosure statement
No potential conflict of interest was reported by the authors.
Supplementary material
Supplemental data for this article can be accessed on the publisher’s website.
Additional information
Funding
Related Research Data
References
- Alve, E. 2010. Benthic foraminiferal responses to absence of fresh phytodetritus: A two-year experiment. Marine Micropaleontology 76:67–75. doi:https://doi.org/10.1016/j.marmicro.2010.05.003.
- Bergsten, H. 1994. Recent benthic foraminifera of a transect from the North Pole to the Yermak Plateau, eastern central Arctic Ocean. Marine Geology 119:251–67. doi:https://doi.org/10.1016/0025-3227(94)90184-8.
- Blott, S. J., and K. Pye. 2001. GRADISTAT: A grain size distribution and statistics package for the analysis of unconsolidated sediments. Earth Surface Processes and Landforms 26 (11):1237–48. doi:https://doi.org/10.1002/esp.261.
- Cai, C. E., E. Rignot, D. Menemenlis, and Y. Nakayama. 2017. Observations and modeling of ocean-induced melt beneath Petermann Glacier Ice Shelf in northwestern Greenland. Geophyysical Research. Letters 44:8396–403. doi:https://doi.org/10.1002/2017GL073711.
- Caralp, M. H. 1989. Size and morphology of the benthic foraminifer Melonis barleeanum - relationships with marine organic matter. Journal of Foraminiferal Research 19:235–45. doi:https://doi.org/10.2113/gsjfr.19.3.235.
- Darling, K. F., M. Kucera, D. Kroon, and C. M. Wade. 2006. A resolution for the coiling direction paradox in Neogloboquadrina pachyderma. Paleoceanography 21:PA2011. doi:https://doi.org/10.1029/2005PA001189.
- Darling, K. F., M. Schweizer, K. L. Knudsen, K. M. Evans, C. Bird, A. Roberts, H. Filipsson, H.-J. Kim, G. Gudmundsson, C. M. Wade, et al. 2016. The genetic diversity, phylogeography and morphology of Elphidiidae (Foraminifera) in the Northeast Atlantic. Marine Micropalaeontology 129:1–23. doi:https://doi.org/10.1016/j.marmicro.2016.09.001.
- Duchemin, G., F. J. Jorissen, F. Andrieux-Loyer, F. Le Loc’h, C. Hily, and X. Philippon. 2005. Living benthic foraminifera from “La Grande Vasière”, French Atlantic continental shelf: Faunal composition and microhabitats. Journal of Foraminiferal Research 35:198–218. doi:https://doi.org/10.2113/35.3.198.
- Duffield, C. J., S. Hess, K. Norling, and E. Alve. 2015. The response of Nonionella iridea and other benthic foraminifera to “fresh” organic matter enrichment and physical disturbance. Marine Micropaleontology 120:20–30. doi:https://doi.org/10.1016/j.marmicro.2015.08.002.
- Gooday, A. J., and J. A. Hughes. 2002. Foraminifera associated with phytodetritus deposits at a bathyal site in the northern Rockall Trough (NE Atlantic): Seasonal contrasts and a comparison of stained and dead assemblages. Marine Micropaleontology 46:83–110. doi:https://doi.org/10.1016/S0377-8398(02)00050-6.
- Gooday, A. J., and P. J. D. Lambshead. 1989. Influence of seasonally deposited phytodetritus on benthic foraminiferal populations in the bathyal northeast Atlantic. Marine Ecology Progress Series 58:53–67. doi:https://doi.org/10.3354/meps058053.
- Hald, M., P. I. Steinsund, T. Dokken, S. Korsun, L. Polyak, and R. Aspeli. 1994. Recent and late Quaternary distribution of Elphidium excavatum f. clavata in Arctic Seas. Cushman Foundation Special Publication 32:141–53.
- Heuzé, C., A. Wåhlin, H. L. Johnson, and A. Münchow. 2017. Pathways of meltwater export from Petermann Glacier. Greenland: Journal of Physical Oceanography 47:405–18.
- Hogan, K. A., M. Jakobsson, L. Mayer, B. T. Reilly, A. E. Jennings, J. S. Stoner, T. Nielsen, K. J. Andresen, E. Nørmark, K. A. Heirman, et al. 2020. Glacial sedimentation, fluxes and erosion rates associated with ice retreat in Petermann Fjord and Nares Strait, north-west Greenland. The Cryosphere 14:261–86. doi:https://doi.org/10.5194/tc-14-261-2020.
- Holland, D. M., R. H. Thomas, B. D. Young, M. H. Ribergaard, and B. Lyberth. 2008. Acceleration of Jakobshavn Isbræ triggered by warm subsurface ocean waters. Nature Geoscience 1:659–64. doi:https://doi.org/10.1038/ngeo316.
- Jakobsson, M., K. A. Hogan, L. A. Mayer, A. Mix, A. Jennings, J. Stoner, B. Eriksson, K. Jerram, R. Mohammad, C. Pearce, et al. 2018. The Holocene retreat dynamics and stability of Petermann Glacier in northwest Greenland. Nature Communications 9:2104. doi:https://doi.org/10.1038/s41467-018-04573-2.
- Jennings, A. E., and G. Helgadottir. 1994. Foraminiferal assemblages from the fjords and shelf of eastern Greenland. Journal of Foraminiferal Research 24 (2):123–44. doi:https://doi.org/10.2113/gsjfr.24.2.123.
- Jennings, A. E., M.-S. Seidenkrantz, and K. L. Knudsen. 2020. Glomulina oculus, new calcareous foraminiferal species from the high Arctic: A potential indicator of a nearby marine-terminating glacier. Journal of Foraminiferal Research 50 (2):219–34. doi:https://doi.org/10.2113/gsjfr.52.2.219.
- Jennings, A. E., C. Sheldon, T. M. Cronin, P. Francus, J. Stoner, and J. Andrews. 2011. The Holocene history of Nares Strait: Transition from glacial bay to Arctic-Atlantic throughflow. Oceanography 24:26–41. doi:https://doi.org/10.5670/oceanog.2011.52.
- Jernas, P., D. Klitgaard-Kristensen, K. Husum, N. Koç, V. Tverberg, P. Loubere, M. Prins, N. Dijkstra, and M. Gluchowska. 2018. Annual changes in Arctic fjord environment and modern benthic foraminiferal fauna: Evidence from Kongsfjorden, Svalbard. Global and Planetary Change 163:119–40. doi:https://doi.org/10.1016/j.gloplacha.2017.11.013.
- Johnson, H. L., A. Münchow, K. K. Falkner, and H. Melling. 2011. Ocean circulation and properties in Petermann Fjord, Greenland. Journal of Geophysical Research 116:C01003. doi:https://doi.org/10.1029/2010JC006519.
- Jorissen, F. J., H. C. de Stigter, and J. G. V. Widmark. 1995. A conceptual model explaining benthic foraminiferal microhabitats. Marine Micropaleontology 26:3–15. doi:https://doi.org/10.1016/0377-8398(95)00047-X.
- Kovach. 1998. Multi-variate statistical package. Pentraeth, Wales: Kovach Computing Services.
- Kozo, T. L. 1991. The hybrid polynya at the northern end of Nares Strait. Geophysical Research Letters 18:2059–62. doi:https://doi.org/10.1029/91GL02574.
- Kwok, R. 2005. Variability of Nares Strait ice flux. Geophysical Research Letters 32. doi:https://doi.org/10.1029/2005GL024768.
- Kwok, R., L. Toudal Pederson, P. Gudmandsen, and S. S. Pang. 2010. Large sea ice outflow into the Nares Strait in 2007. Geophysical Research Letters 37. doi:https://doi.org/10.1029/2009GL041872.
- Lagoe, M. B. 1977. Recent benthic foraminifera from the Central Arctic Ocean. Journal of Foraminiferal Research 7:106–29. doi:https://doi.org/10.2113/gsjfr.7.2.106.
- Linke, P., and G. F. Lutze. 1993. Microhabitat preferences of benthic foraminifera — A static concept or a dynamic adaption to optimize food acquisition. Marine Micropaleontoly 20:215–34. doi:https://doi.org/10.1016/0377-8398(93)90034-U.
- Makinson, K., and P. G. Anker. 2014. The BAS ice-shelf hot-water drill: Design, methods and tools. Annals of Glaciology 55:44–52. doi:https://doi.org/10.3189/2014AoG68A030.
- Miller, R. L., and J. S. Kahn. 1962. Statistical analysis in the geological sciences. New York: John Wiley and Sons, Inc.
- Muenchow, A. 2019. Physical ocean property profile from Petermann Fjord, Greenland, surveyed in 2015 by IB/Oden. Arctic Data Center. doi:https://doi.org/10.18739/A2XS5JH16.
- Münchow, A., K. K. Falkner, H. Melling, B. Rabe, and H. L. Johnson. 2011. Ocean warming of Nares Strait bottom waters off Northwest Greenland, 2003–2009. Oceanography 24:114–23. doi:https://doi.org/10.5670/oceanog.2011.62.
- Münchow, A., L. Padman, and H. A. Fricker. 2014. Interannual changes of the floating ice shelf of Petermann Gletscher, North Greenland, from 2000 to 2012. Journal of Glaciology 60:489–99. doi:https://doi.org/10.3189/2014JoG13J135.
- Münchow, A., L. Padman, P. Washam, and K. W. Nicholls. 2016. The ice shelf of Petermann Gletscher, North Greenland, and its connection to the Arctic and Atlantic Oceans. Oceanography 29:84–95. doi:https://doi.org/10.5670/oceanog.2016.101.
- Osterman, L. E., R. Z. Poore, and K. M. Foley. 1999. Distribution of benthic foraminifers (>125 μm) in the surface sediments of the Arctic Ocean. US Geological Survey Bulletin 2164:1–28.
- Perner, K., M. Moros, A. Jennings, J. M. Lloyd, and K. L. Knudsen. 2012. Holocene palaeoceanographic evolution off West Greenland. The Holocene 23:374–87. doi:https://doi.org/10.1177/0959683612460785.
- Polyak, L., K. M. Best, K. A. Crawford, E. A. Council, and G. St-Onge. 2013. Quaternary history of sea ice in the western Arctic Ocean based on foraminifera. Quaternary Science Reviews 79:145–56. doi:https://doi.org/10.1016/j.quascirev.2012.12.018.
- Reilly, B. T., J. S. Stoner, A. C. Mix, M. H. Walczak, A. E. Jennings, M. Jakobsson, L. Dyke, A. Glueder, K. Nicholls, K. A. Hogan, et al. 2019. Holocene break-up and reestablishment of the Petermann Ice Tongue, northwest Greenland. Quaternary Science Reviews 218:322–42. doi:https://doi.org/10.1016/j.quascirev.2019.06.023.
- Rignot, E., and J. Mouginot. 2012. Ice flow in Greenland for the International Polar Year 2008–2009. Geophysical Research Letters 39 (11):L11501. doi:https://doi.org/10.1029/2012GL051634.
- Rudels, B., L. Anderson, P. Eriksson, E. Fahrbach, M. E. P. J. Jakobsson, H. Melling, S. Prinsenberg, U. Schauer, and T. Yao. 2012. Observations in the ocean. In Arctic Climate Change. Atmospheric and Oceanographic Sciences Library, ed. P. Lemke and H. W. Jacobi, vol. 43, 117–98. Dordrecht: Springer.
- Ryan, P. A., and A. Münchow. 2017. Sea ice draft observations in Nares Strait from 2003 to 2012. Journal of Geophysical Research, Oceans 122:3057–80. doi:https://doi.org/10.1002/2016JC011966.
- Samelson, R. M., T. Agnew, H. Melling, and A. Münchow. 2006. Evidence for atmospheric control of sea-ice motion through Nares Strait. Geophysical Research Letters 33:L02506. doi:https://doi.org/10.1029/2005GL025016.
- Schröder-Adams, C. J., F. E. Cole, F. S. Medioli, P. J. Mudie, D. B. Scott, and L. Dobbin. 1990. Recent Arctic shelf foraminifera: Seasonally ice covered vs. perennial ice covered areas. Journal of Foraminiferal Research 20:8–36. doi:https://doi.org/10.2113/gsjfr.20.1.8.
- Scott, D. B., and F. S. Medioli. 1980. Living vs. total foraminiferal populations: Their relative usefulness in paleoecology. Journal of Paleontology 54:814–31.
- Scott, D. B., T. Schell, A. Rochon, and S. Blasco. 2008. Modern benthic foraminifera in the surface sediments of the Beaufort Shelf, slope and Mackenzie Trough, Beaufort Sea, Canada: Taxonomy and summary of surficial distribution. Journal of Foraminiferal Research 38:228–50. doi:https://doi.org/10.2113/gsjfr.38.3.228.
- Seidenkrantz, M.-S. 2013. Benthic foraminifera as palaeo sea-ice indicators in the subarctic realm – Examples from the Labrador Sea – Baffin Bay region. Quaternary Science Reviews 79:135–44. doi:https://doi.org/10.1016/j.quascirev.2013.03.014.
- Straneo, F., D. A. Sutherland, D. Holland, C. Gladish, G. S. Hamilton, H. L. Johnson, E. Rignot, Y. Xu, and M. Koppes. 2012. Characteristics of ocean waters reaching Greenland’s glaciers. Annals of Glaciology 53:202–10. doi:https://doi.org/10.3189/2012AoG60A059.
- Vilks, G. 1980. Postglacial basin sedimentation on Labrador Shelf. Geological Survey Paper 78-28:17.
- Washam, P., A. Münchow, and K. W. Nicholls. 2018. A decade of ocean changes impacting the ice shelf of Petermann Gletscher, Greenland. Journal of Physical Oceanography 48:2477–93. doi:https://doi.org/10.1175/JPO-D-17-0181.1.
- Washam, P., P. W. Nicholls, A. Münchow, and L. Padman. 2019. Summer surface melt thins Petermann Gletscher Ice Shelf by enhancing channelized basal melt. Journal of Glaciology 13. doi:https://doi.org/10.1017/jog.2019.43.
- Wollenburg, J. E., J. Knies, and A. Mackensen. 2004. High-resolution paleoproductivity fluctuations during the past 24 kyr as indicated by benthic foraminifera in the marginal Arctic Ocean. Palaeogeography, Palaeoclimatology, Palaeoecology 204:209–38. doi:https://doi.org/10.1016/S0031-0182(03)00726-0.
- Wollenburg, J. E., and W. Kuhnt. 2000. The response of benthic foraminifers to carbon flux and primary production in the Arctic Ocean. Marine Micropaleontology 40:189–231. doi:https://doi.org/10.1016/S0377-8398(00)00039-6.
- Wollenburg, J. E., and A. Mackensen. 1998. Living benthic foraminifera from the central Arctic Ocean: Faunal composition, standing stock and diversity. Marine Micropaleontology 34:153–85. doi:https://doi.org/10.1016/S0377-8398(98)00007-3.