
ABSTRACT
In recently deglaciated soils, microbial organisms drive soil transformations by increasing carbon (C) and nitrogen (N) pools while depleting available phosphorous (P), thus improving plant colonization and soil development. However, the rate of soil development can vary in response to local environmental conditions that affect microbial abundance and activity. In this contribution we use observational and experimental approaches to evaluate the interplay between soil biogeochemical features and microbial abundance and function after approximately seventy years of soil development in the forefield of the Exploradores Glacier that is located at the northernmost end of the Northern Patagonian Ice Field. Our findings suggest that after approximately seventy years of soil development, microbial abundance and soil C and N accumulation increase with soil age, soil bulk density and pH decreased, and microbial activity measured as soil chlorophyll a and nifH gene abundance increased. In turn, decomposition increased with fungal abundance, showing higher values in the late stages of soil development where the soil C:N ratio was higher and soil pH was lower. Overall, biogeochemical changes along this chronosequence followed the predicted pattern, with gradual increases in soil nutrients and microbial abundance, in addition to decomposition processes.
Introduction
After glacier retreat, soil biogeochemical properties change in response to shifts in temperature, microbial activity, and environmental weathering (Tscherko et al. Citation2003; Brankatschk et al. Citation2011; Zumsteg et al. Citation2012; Bradley, Singarayer, and Anesio Citation2014). These soil formation and successional processes in cold glacier environments tend to be very slow (Bardgett et al. Citation2005; Esperschutz et al. Citation2011; Bradley, Singarayer, and Anesio Citation2014; but see Schweizer et al. Citation2018). Low temperature and nutrient availability in soil often reduce microbial growth and activity that slow down accumulation rates of organic matter (OM) in soil (Matthews Citation1992; Bardgett et al. Citation2005; Kim et al. Citation2017). Although we know that plant colonization and primary productivity rely on soil resource availability (e.g., energy and nutrients) and features such as soil pH and texture (Bardgett and Walker Citation2004), we have just started to understand the role of microorganisms in driving soil development and ecosystem succession in cold environments.
Recently deglaciated exposed rocks or silty soils are colonized by lichens, mosses, and soil microorganisms (Favero-Longo et al. Citation2012). Through mineral weathering these organisms promote changes in soil chemical properties such as pH and availability of cations such as calcium and potassium (Matthews Citation1992; Chapin et al. Citation1994; Frey et al. Citation2010; Schuette et al. Citation2010). Thus, biological in addition to physical weathering increases the availability of essential nutrients for soil and ecosystem development (Schuette et al. Citation2010; Schweizer et al. Citation2018). Microbial colonizers in early stages of soil development are exposed to oligotrophic and frequently nitrogen-limited soils (Brankatschk et al. Citation2011; Bradley, Singarayer, and Anesio Citation2014). Thus, C-fixing autotrophic microorganisms and free-living nitrogen-fixing groups (e.g., diazotrophs) are key for soil biogeochemistry, because these organisms increase soil carbon (C) and nitrogen (N) pools (Nemergut et al. Citation2007; Göransson, Venterink, and Bååth Citation2011), although at the same time available P decreases in soils as is depleted by microbial activity. Accordingly, past research has shown that free-living N fixation and soil C increase with cyanobacteria diversity, which further promotes the abundance of heterotrophic bacterial and fungal groups (Chapin et al. Citation1994; Walker and Moral Citation2003; Schmidt et al. Citation2008). Some of these microbial heterotrophs are decomposers, and their activity is very important for organic C accumulation and soil formation (Bardgett et al. Citation2007; Wietrzyk-Pełka et al. Citation2019). Therefore, understanding the role of microbial communities is essential to comprehend the process of OM accumulation in young soils, a condition that is pivotal for plant colonization and establishment (Nemergut et al. Citation2007; Boy et al. Citation2016).
Overall, soil microbial abundance and thus function increase with soil age (Bardgett et al. Citation2005; Schmidt et al. Citation2008). However, archaeal, bacterial, and fungal abundances often show different trajectories during early stages of soil development (Schmidt et al. Citation2014). For example, Brown and Jumpponen (Citation2014) observed that bacterial and fungal communities in recently deglaciated soils showed large differences in community structure and composition patterns during succession. These patterns may be related to different ecological and physiological strategies (Schmidt et al. Citation2014). Bacteria colonize young and oligotrophic soils during early stages of succession, which promotes the accumulation of OM. This, in turn, favors the growth of heterotrophic fungi (Schmidt et al. Citation2014; Alfaro et al. Citation2017). There is evidence from different environments that as soil develops, fungal dominance increases, which is associated with changes in soil pH and an increase of nutrient pools (i.e., notably C and N; Bardgett et al. Citation2005; Williamson, Wardle, and Yeates Citation2005; Jiang et al. Citation2018). These changes in the relative abundance of microbial groups are reflected in changes in the fungal-to-bacterial ratio during late stages of soil development (Alfaro et al. Citation2017; Jiang et al. Citation2018).
Large decreases in ice cover in the Northern Patagonian Ice Field (NPIF) have exposed the vast soil surface of the major ice field in the Southern Hemisphere (Rignot, Rivera, and Casass Citation2003; Willis et al. Citation2012; Barcaza et al. Citation2017). These soils have been subject to extensive and prolonged ice cover during the last 100,000 years (Rasmussen, Conway, and Raymond Citation2007; Masiokas et al. Citation2015; Mardones et al. Citation2018). Therefore, these soils are relatively young and N-limited (Thébault et al. Citation2014; Pérez et al. Citation2017). Furthermore, environmental conditions in these mid-latitudes of the Southern Hemisphere (46°30′ S), even at low elevation (180 m), can hamper biological activity and the accumulation of OM in soil (Pérez, Carmona, and Armesto Citation2010; Pérez et al. Citation2017). Under these environmental conditions, the soil formation process is expected to be slow and strongly related to microbial activity. Thus, glacier forefields provide a unique opportunity to assess the role of microbial communities behind soil formation that create the conditions for successful colonization of vegetation in recently deglaciated environments.
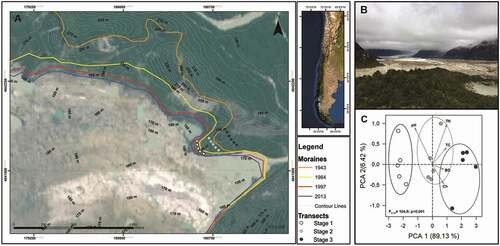
In this study we focused on how soil microbial abundance and decomposer activity change after approximately seventy years of soil development following glacier retreat in the NPIF in Chile. The Exploradores Glacier is in the northern border of the NPIF (), where the large glaciated surface is being replaced by recently deglacied soils and austral forests. We hypothesized that increases in soil microbial abundance as soil development proceeds would be associated with an increase in soil C and N availabilities and a decline in soil pH. Further, we hypothesized that the fungal-to-bacterial ratio (a measure of relative abundance) would increase through time in parallel with soil OM accumulation and that this would be reflected in an enhanced nitrogen fixation potential for older soils. We expected an increase in below-ground decomposition rate as nutrient availability and microbial abundance increases during soil development. To test these hypotheses, we followed two different approaches. First, through observation we evaluated the changes in abundance of archaeal, bacterial, and fungal groups, as well as abundance of genes involved in N fixation during early stages of soil development in nonvegetated soils. Second, through an experimental approach we assessed belowground decomposition.
Figure 1. Study site description: a) Satellite image illustrating the retreat of the Exploradores glacier in last 70 years. Color lines show the age-limit of the three stages of soil development. b) Photo showing a frontal view of Exploradores forefield glacier. c) A principal component analysis (PCA) of soil features during soil development. F and P-value correspond to PerManova test results. Open symbols: stage 1; light grey: stage 2; dark grey: stage 3
Methods
Study site
The forefield of the Exploradores Glacier is located at 46°30′ S and 73°10′ W, at the northern end of the NPIF. The glacier is formed by the junction of three main tributaries draining the northeastern side of the Monte San Valentín, the highest mountain in Patagonia (3,910 m a.s.l.). From this glacier originates the Exploradores River, which constitutes the main river in the valley (Mardones et al. Citation2018; Bañales-Seguel, Salazar, and Mao Citation2020). The mean annual temperature is 9.1°C, and the mean annual precipitation is around 2,000 mm (Aniya Citation2007), with abundant precipitation during the winter season (June–August). Whereas the mean annual temperature decreases with elevation, the mean annual precipitation tends to increase with elevation close to the Exploradores Glacier (Aniya Citation2007).
Chronosequence description
This chronosequence spans a period of approximately seventy years of soil development, with three well-defined stages. The distal side of the terminal moraine (approximately seventy years) is covered by multilayer vegetation, including trees with diameter at breast height of up to 70 cm, which contrasts with the bare soil in the proximal side of the moraine. The age of each stage was determined by using recent satellite image from 2010 and historic aerial photography (from 1943, 1984, 1997) of glacier retreat (). On the 1943 Trimetrogon aerial photograph, the glacier’s terminus was in contact with the terminal moraine and at least three meltwater outlets can be recognized. In the 1984 photograph, the ice terminus had separated from the main moraine and two outlets dried out, leaving only Deshielo River. At the aerial photograph spatial scale (1:70,000), limited retreat is observed between 1997 and 2013. Instead, this period is better characterized by a down-wasting (e.g., thickness loss) of ice. Soils formed in newly deglaciated terrain are mixtures of fine-silty sand and clay, whereas more distant moraine deposits are covered by large rocks and coarse sediments (Aniya Citation2007). Subdued and irregular ice-cored moraine topography occurs toward the glacier and exposes the ongoing deglacial phase.
Soil samples collection and analysis
Five soil samples of 50 g were collected along a 50-m transect on each of the three soil development stages () to assess the soil biogeochemical features. All soil samples were collected with a core sampler from the top layer (>5 cm) of nonvegetated soils, without lichens and mosses that could be observed with the naked eye. A portion of soils was sieved (<2 mm) and separated for estimation of element content (i.e., C and N) and soil pH. Soil pH was determined with a pH sensor in a 1:2 soil:water suspension. Total phosphorus was estimated through acid extraction with sulphuric acid and peroxide and determined colorimetrically with molybdenum-blue method (Steubing and Fangmeier Citation1992). Soil elemental content of total carbon (TC) and total nitrogen (TN) was determined using a Thermo Delta V Advantage IRMS, coupled with a Flash2000 Elemental Analyzer at the Biogeochemistry Lab (LABASI), Pontificia Universidad Católica de Chile (Santiago, Chile). Bulk density was estimated by the core method (10 cm soil depth) at five points within each stage of soil development. Chlorophyll a concentration was estimated using a fluorometer to quantify the photosynthetic activity of microbial organisms in soils (Turner Designs TD-700, Santiago, Chile). Soil samples for DNA analysis were sieved (<2 mm) and preserved in liquid nitrogen during transport to the laboratory.
DNA extraction and quantification by quantitative polymerase chain reaction
DNA was extracted from 500 mg samples of soil, using the FastDNA Spin Kit for Soil Kit (BIO101, MP Biomedical, Solon, OH), according to the instructions of the manufacturer. The soil samples were lysed in a FastPrep Instrument (Santiago, Chile) with a single 40-second run at a speed setting of 6.0. DNA concentration was estimated using a Nanodrop ND-2000c (Thermo Scientific, Wilmington, DE), and integrity was evaluated on agarose gel. Purified DNAs were stored at −80°C.
The abundance of archaea, bacteria, and fungi was determined via quantitative polymerase chain reaction (qPCR; Eco Real-Time PCR System, Illumina, San Diego, CA) and KAPA SYBR FAST qPCR Master Mix Universal (Kapa Biosystems, Boston, MA). The bacterial and archaeal 16S rRNA gene was amplified using the 0.5 μM 338 f-518 r and 931 f-m1100r primer sets, respectively (Einen et al. Citation2008). The fungal 18S rRNA gene was quantified using 1.25 μM of primer FR1-FF390 (Prévost-Bouré et al. Citation2011). The abundances of nifH gene was evaluated using 0.2 μM of PolF 5′-TGC GAY CCS AAR GCB GAC TC-3ʹ and PolR 5′-ATS GCC ATC ATY TCR CCG GA-3ʹ (Poly, Monrozier, and Bally Citation2001) following thermal protocols (Mao, Yannarell, and Mackie Citation2011). The specificity of PCR was evaluated by running products on a 1 percent (w/v) agarose gel. Purified PCR products from a DNA common to all samples were used to prepare standards curves using serial dilutions. Two independent qPCRs were performed for each microbial group. The standard curves had R2 values of 0.997, 0.998, and 0.992 and amplification efficiency estimated to be 98, 97, and 101 percent for bacteria, archaea, and fungi, respectively.
Microbial abundances (gene copy number) estimated using qPCR should be considered carefully, because of great variation in copy numbers of rRNAs (Smith and Osborn Citation2009). Nonetheless, this technique is now widely used in soil microbial ecology. To avoid the potential effect of large variation of copy number estimation, we followed three procedures. First, we repeatedly homogenized each soil sample before DNA extraction; second, we removed extreme values from each qPCR estimation; and third, we repeated our tests when the results were abnormal for R2 coefficients of standard curves and amplification efficiency.
Field decomposition experiment
In order to have an indirect measurement of microbial decomposer activity, we decided to establish a decomposition experiment across stages of soil development. We reasoned that, although primary productivity is scarce, microbial communities could be acting as belowground decomposers and this activity should increase with soil age and ecosystem development. We used standard Whatman cellulose filters (2.54 g) as substrate for microbial decomposition. Twenty filters were buried (10 cm soil depth) inside plastic mesh across a 100-m transect within each stage of soil development. We used a soil core sampler to extract soils and after filters were buried. Five filters were collected from each stage of soil development after seven (T1), twelve (T2), and nineteen (T3) months.
Mass loss was evaluated as the difference in dry weight in cellulose filters after exposure to decomposition.
Data analysis
Microbial abundance and nifH gene abundance patterns across stages of soil development were analyzed using one-way analysis of variance followed by the assessment of pairwise differences with Tukey’s honestly significant difference post hoc test. Principal component analysis was performed to assess the variation in soil features among stages of soil development. The differences in soil biogeochemical properties among stages of soil development was evaluated by permutational multivariate analysis of variance (PERMANOVA). Ordinary least squares regression was used to evaluate the relationships between soil C, N, and pH and microbial abundance patterns during soil development. Statistical procedures were performed using R software (R Development Core Team Citation2014).
Results
Soil biogeochemical patterns during soil development
Soil biogeochemistry changed as a function of age. As expected, soil TC and TN increased with soil age (F = 36.69, p < .001; F = 25.16, p < .001, respectively), whereas soil pH decreased (F = 34.36, p < .001; ). Total phosphorous (TP) did not show any temporal trend. Soil productivity expressed as chlorophyll a concentration also increased with soil age (F = 289.71, p < .001; ). Finally, changes in soil features were accompanied by increases in bulk density (F = 31.8, p < .001; ). Differences in soil chemical and physical features differentiated the three stages of the chronosequence (principal component analysis; ). This was supported by the PERMANOVA test, which also indicated that soils were significantly different across stages.
Table 1. Changes in soil biogeochemical features across three stages of soil development of the NPFI chronosequence
Changes in microbial abundance and function during soil development
Microbial abundance changed across stages of the chronosequence. Archaeal, bacterial, and fungal abundance increased significantly with soil age (; F = 196.3, p < .001; F = 97.18, p < .001; F = 87.27, p < .001). Also as expected, bacterial abundance was higher than archaeal and fungal communities in all stages of soil development (). In turn, the nifH gene copy number increased significantly during soil development (). On the other hand, we observed significant changes in microbial ratios during soil development (). The archaea-to-bacteria (A:B), fungi-to-bacteria (F:B), and nifH-to-bacteria (N:B) ratios increased significantly with soil age ().
Table 2. Differences in the relative abundance of microbial groups, measured as ratios across the three stages of soil development of the NPFI glaciar retreat chronosequence
Figure 2. Changes in microbial community abundance and the nifH gene (i.e. nitrogen cycle gene) across stages of soil development at the NPIF. In a) Archaeal, b) Bacterial, c) Fungal abundances, and in d) nifH gene-copy number. Bars represent mean values and ±1 SE of gene abundance from five samples. Different letters shows significant differences across stages of soil development for F and P-values of ANOVA given in right upper corner
Changes in soil C:N were positively associated with the increases in abundance of microbial groups in advanced soil development stages (), whereas soil pH decreases were associated with an increase microbial abundance. Increases in A:B and F:B ratios as well as in nifH gene copy number were positively correlated with soil C:N (, ) and reductions in soil pH (, ). The coefficient of regression suggests that the associations of soil C:N and pH were higher for A:B ratios than for F:B.
Figure 3. Changes in the relative abundance of microbial groups as a function of changes in (a) soil C:N and (b) soil pH (i.e., soil variables with the highest relative contribution to change in microbial abundance). Circles: fungal-to-bacterial ratios; Triangles: archaeal-to-bacterial ratios across three stages of the NPFI. (c), (d) Changes in nifH gene copy number. For all panels, open symbols: stage 1; light grey: stage 2; dark grey: stage 3. Solid lines represent significant linear regression adjusted for variables
After nineteen months, mass loss of the cellulose discs (i.e., Whatman filters) was 6.5 percent (±0.90) in early stages, with 11.9 percent (±0.87) and 28.7 percent (±1.88) in the second and third stages, respectively (). Mass loss could be related to increases in soil fungal abundance during soil development ().
Figure 4. Differences in mass loss (buried) across stages of soil development in the NPIF chronosequence. (a) Mass loss of Whatman filter after nineteen months in three stages of soil development. T1: after seven months, T2: after 12 months; T3: after nineteen months. (b) Relationship between mass loss of Whatman filters as a function of higher fungal abundance across stages of the NPIF chronosequence. Open circle: stage 1; light grey: stage 2; dark grey: stage 3. Solid lines represent a significant linear relationship (all data included)
Discussion
Microbial abundance during soil development
After glacier retreat, increases in soil microbial activity and biomass promote important changes in soil chemical and physical features. As expected, when soil age increased, higher values of soil TC and TN were observed (, ) and microbial abundance was higher ( and ). Across the soil chronosequence, archaea, bacteria, and fungi abundance increased with soil age (). However, F:B and A:B ratios increased significantly with soil age, suggesting that fungi and archaea abundance increased more relative to bacteria (). This change from bacterial- to fungal-dominated soils is often associated with increases in OM accumulation and nutrient availability (notably C and N) during soil development and prior to plant colonization (Bardgett et al. Citation2005; Allison et al. Citation2007; Zhang et al. Citation2019).
Fungal-to-bacterial ratios showed large values in these relatively acidic soils (), similar to previously reported mesic chronosequences, where fungal abundance outnumbers bacterial abundance during soil development (Williamson, Wardle, and Yeates Citation2005; Allison et al. Citation2007). This negative relationship between soil pH and fungal abundance, in turn, has been associated with changes in soil microbial dominance and soil processes such as decomposition and nutrient mineralization (Williamson, Wardle, and Yeates Citation2005). Accordingly, we observed a positive effect of fungal abundance on decomposition during soil development (). Interestingly, low soil pH observed after approximately seventy years of soil development was similar to that reported in other mesic chronosequences after thousands of years of development (Bardgett et al. Citation2005; Williamson, Wardle, and Yeates Citation2005). The apparent low soil pH in all stages of soil development in our chronosequence suggests that soils from Patagonia turn relatively quickly into acidic soils, affecting elemental depletion and immobilization. Evidence of this is that soil P was low and did not show changes between all stages of soil development (). Accordingly, recent experimental studies suggest that soil P during early stages of soil development in glacier chronosequences could be a limiting factor, even more than soil N (Darcy et al. Citation2018). Despite this, over broad temporal scales, large declines in soil P have been positively related to acidification of soil (Williamson, Wardle, and Yeates Citation2005).
Although little is known about the importance of activity of archaeal communities during early soil development (Zumsteg et al. Citation2012), it has been recently posited that archaeal groups play an important role in nutrient cycling (e.g., C and N) during early stages of primary succession (Nicol et al. Citation2005; Brankatschk et al. Citation2011; Fernández-Martínez et al. Citation2017). In our chronosequence, archaeal abundance as well nifH gene abundance and soil TN increased during soil development. In young stages, characterized by bare soil with large temperature fluctuations and low OM, archaeal groups could rapidly colonize soil and improve conditions for arrival of bacteria and fungi (Fernández-Martínez et al. Citation2017). For example, in very young soils close to glaciers, ammonium-oxidizing archaea may be dominant (Harding et al. Citation2011; Zarsky et al. Citation2013).
Carbon and nitrogen accumulation during soil development
After approximately seventy years of soil development, the buildup of soil C and N increased significantly (). These patterns could be attributed to an increase in abundance and activity of autotrophic and N-fixing bacteria (, ), such as those seen in alpine and arctic chronosequences, where the N-fixing autotrophs plays a critical role in N fixation prior to plant colonization (Nemergut et al. Citation2007; Schmidt et al. Citation2008, Citation2014). Biological N fixation is an energetically demanding process (Vitousek et al. Citation2002; Reed, Cleveland, and Townsend Citation2011), which is intimately associated with resource availability, in particular energy available from photosynthetic activity (i.e., C; Vitousek et al. Citation2002; Dynarski and Houlton Citation2018). Accordingly, here, the nifH gene copy number increased with soil C:N from early to late stages of soil development. On the other hand, an increase in chlorophyll a with soil age was positively associated with soil C:N ratio (Figure S1A); therefore, chlorophyll a levels in soil could be a good indicator of microbial photosynthetic activity during soil development (Darcy et al. Citation2018) and could indicate the abundance of chlorophyll-based food chains during early stages of soil development.
Belowground decomposition during soil development
The decomposition process depends on soil development, given related changes in soil physicochemical features and the colonization, growth, and activity of microorganisms that underlie decomposition (Bardgett et al. Citation2005; Wang et al. Citation2020; Zhu et al. Citation2020). Here after approximately seventy years of soil development, we found that belowground decomposition was significantly associated with increases in C:N and decreases in soil pH (Figure S1). There is scarce evidence of belowground decomposition in bare soils from glacier areas; however, some studies indicate that large amounts of ancient OM could be used as source of C for heterotrophic organisms during early stages of soil development (Bardgett et al. Citation2007). Our findings also showed that increases in fungal abundance were positively associated with belowground decomposition (), which was expected, given that fungi are the main agent of decomposition (Wardle Citation2006; Bardgett et al. Citation2007).
Conclusions
Glaciers in NPIF have been rapidly decreasing in mass in the last decade, driving changes in soil structure and function that promote organic soil formation. These patterns are expected to continue, expanding the ice-free areas to be colonized. In the present study we report that soil archaeal, bacterial, and fungal abundance increased with soil age after approximately seventy years of soil development. Before plant colonization, changes in soil microbial abundance were associated with increases in C and N pools and decreases in soil pH. These findings suggest that soil development of such nutrient-poor soils is strongly associated with observed increases in abundance of microbial communities and the associated changes in soil pH, C and N pools, and decomposition activity; together such observed patterns may ultimately impact later successional processes such as plant colonization.
Author contributions
FDA, AG, and PMA: Study and sampling design. FDA, CB, MM, and JLG: Sample preparation and fieldwork. FDA, JLG, CB, and KR: Data analysis. FDA, AG with input from all coauthors: Manuscript preparation.
Supplemental Material
Download Zip (19.2 KB)Acknowledgments
We thank Benjamin Glasner for field assistance. Research reported here are contributions to the program of the Long-Term Socio-Ecological Research Network- Chile (LTSER-Chile) and the Red de Centros y Estaciones Regionales de Investigación, RECER UC, Pontificia Universidad Católica de Chile. The authors gratefully acknowledge the work of the Observatoire homme-milieux International, Patagonia-Bahía Exploradores (OHM-I, INEE, CNRS and the Estación Patagonia UC, Pontificia Universidad Católica de Chile).
Disclosure statement
No potential conflict of interest was reported by the authors.
Supplementary material
Supplemental data for this article can be accessed on the publisher’s website.
Additional information
Funding
References
- Alfaro, F. D., M. Manzano, P. A. Marquet, and A. Gaxiola. 2017. Microbial communities in soil chronosequences with distinct parent material: The effect of soil pH and litter quality. Journal of Ecology 105:1709–22.
- Allison, V. J., L. M. Condron, D. A. Peltzer, S. J. Richardson, and B. L. Turner. 2007. Changes in enzyme activities and soil microbial community composition along carbon and nutrient gradients at the Franz Josef chronosequence, New Zealand. Soil Biology & Biochemistry 39:1770–81. doi:https://doi.org/10.1016/j.soilbio.2007.02.006.
- Aniya, M. 2007. Glacier variations of Hielo Patagónico Norte, Chile, for 1944/45-2004/05. Bulletin of Glaciological Research 24:59–70.
- Bañales-Seguel, C., A. Salazar, and L. Mao. 2020. Hydro-morphological characteristics and recent changes of a nearly pristine river system in Chilean Patagonia: The Exploradores River network. Journal of South American Earth Sciences 98:102444. doi:https://doi.org/10.1016/j.jsames.2019.102444.
- Barcaza, G., S. Nussbaumer, J. Valdés, G. Tapia, J. L. García, Y. Videla, A. Albornoz, and V. Arias. 2017. Glacier inventory and recent glacier variations in the Andes of Chile, South America. Annals of Glaciology 58:166–80. doi:https://doi.org/10.1017/aog.2017.28.
- Bardgett, R. D., A. Richter, R. Bol, M. H. Garnett, R. Bäumler, X. Xu, E. Lopez-Capel, D. A. C. Manning, P. J. Hobbs, I. R. Hartley, et al. 2007. Heterotrophic microbial communities use ancient carbon following glacial retreat. Biology Letters 3:487–90. doi:https://doi.org/10.1098/rsbl.2007.0242.
- Bardgett, R. D., and L. R. Walker. 2004. Impact of colonizer plant species on the development of decomposer microbial communities following deglaciation. Soil Biology & Biochemistry 36:555–59. doi:https://doi.org/10.1016/j.soilbio.2003.11.002.
- Bardgett, R. D., W. D. Bowman, R. Kaufmann, and S. K. Schmidt. 2005. A temporal approach to linking aboveground and belowground ecology. Trends in Ecology & Evolution 20:634–41. doi:https://doi.org/10.1016/j.tree.2005.08.005.
- Boy, J., R. Godoy, O. Shibistova, D. Boy, R. McCulloch, A. A. de la Fuente, M. A. Morales, R. Mikutta, and G. Guggenberger. 2016. Successional patterns along soil development gradients formed by glacier retreat in the Maritime Antarctic, King George Island. Revista Chilena de Historia Natural 89:2–17. doi:https://doi.org/10.1186/s40693-016-0056-8.
- Bradley, J. A., J. S. Singarayer, and A. M. Anesio. 2014. Microbial community dynamics in the forefield of glaciers. Proceedings of the Royal Society B: Biological Sciences 281:20140882.
- Brankatschk, R., S. Töwe, K. Kleineidam, M. Schloter, and J. Zeyer. 2011. Abundances and potential activities of nitrogen cycling microbial communities along a chronosequence of a glacier forefield. The ISME Journal 5:1025–37. doi:https://doi.org/10.1038/ismej.2010.184.
- Brown, S. P., and A. Jumpponen. 2014. Contrasting primary successional trajectories of fungi and bacteria in retreating glacier soils. Molecular Ecology 23:481–97. doi:https://doi.org/10.1111/mec.12487.
- Chapin, F. S., F. S. Walker, C. L. Fastie, and L. C. Sharman. 1994. Mechanisms of primary succession following deglaciation at Glacier Bay, Alaska. Ecological Monographs 64:149–75. doi:https://doi.org/10.2307/2937039.
- Darcy, J. L., S. K. Schmidt, J. E. Knelman, C. C. Cleveland, S. C. Castle, and D. R. Nemergut. 2018. Phosphorus, not nitrogen, limits plants and microbial primary producers following glacial retreat. Science Advances 4:eaaq0942. doi:https://doi.org/10.1126/sciadv.aaq0942.
- Dynarski, K. A., and B. Z. Houlton. 2018. Nutrient limitation of terrestrial free‐living nitrogen fixation. New Phytologist 217:1050–61. doi:https://doi.org/10.1111/nph.14905.
- Einen, J., I. H. Thorseth, and L. Ovreås. 2008. Enumeration of Archaea and Bacteria in seafloor basalt using real-time quantitative PCR and fluorescence microscopy. FEMS Microbiology Letters 282:182–187.
- Esperschutz, J., A. Pérez-De-Mora, K. Schreiner, G. Welzl, F. Buegger, J. Zeyer, F. Hagedorn, J. C. Munch, and M. Schloter. 2011. Microbial food web dynamics along a soil chronosequence of a glacier forefield. Biogeosciences 8:3283–94. doi:https://doi.org/10.5194/bg-8-3283-2011.
- Favero-Longo, S. E., M. R. Worland, P. Convey, R. I. L. Smith, R. Piervittori, M. Guglielmin, and N. Cannone. 2012. Primary succession of lichen and bryophyte communities following glacial recession on Signy Island, South Orkney Islands, Maritime Antarctic. Antarctic Science 24:323–36. doi:https://doi.org/10.1017/S0954102012000120.
- Fernández-Martínez, M. A., S. B. Pointing, S. Pérez-Ortega, M. Arróniz Crespo, T. A. Green, R. Rozzi, L. G. Sancho, and A. de Los Ríos. 2017. Functional ecology of soil microbial communities along a glacier forefield in Tierra del Fuego (Chile). International Microbiology 19:161–73.
- Frey, B., S. Rieder, I. Brunner, I. M. Plotze, S. Koetzsch, A. Lapanje, H. Brandl, and G. Furrer. 2010. Weathering-associated bacteria from the Damma glacier forefield: Physiological capabilities and impact on granite dissolution. Applied Environmental Microbiology 76:4788–96. doi:https://doi.org/10.1128/AEM.00657-10.
- Göransson, H., H. O. Venterink, and E. Bååth. 2011. Soil bacterial growth and nutrient limitation along a chronosequence from a glacier forefield. Soil Biology & Biochemistry 43:1333–40. doi:https://doi.org/10.1016/j.soilbio.2011.03.006.
- Harding, T., A. D. Jungblut, C. Lovejoy, and W. F. Vincent. 2011. Microbes in high arctic snow and implications for the cold biosphere. Applied and Environmental Microbiology 77:3234–43. doi:https://doi.org/10.1128/AEM.02611-10.
- Jiang, Y., Y. Lei, Y. Yang, H. Korpelainen, U. Niinemets, and C. Li. 2018. Divergent assemblage patterns and driving forces for bacterial and fungal communities along a glacier forefield chronosequence. Soil Biology & Biochemistry 118:207–16. doi:https://doi.org/10.1016/j.soilbio.2017.12.019.
- Kim, M., J. Y. Jung, D. Laffly, H. Y. Kwon, and Y. K. Lee. 2017. Shifts in bacterial community structure during succession in a glacier foreland of the High Arctic. FEMS Microbiology Ecology 93:1–9. doi:https://doi.org/10.1093/femsec/fiw213.
- Mao, Y., A. C. Yannarell, and R. I. Mackie. 2011. Changes in N-transforming archaea and bacteria in soil during the establishment of bioenergy crops. PLoS One 6 (9):e24750. doi:https://doi.org/10.1371/journal.pone.0024750.
- Mardones, F., A. Aguayo, A. Smith, and L. Ruiz. 2018. Retroceso glacial reciente en el Campo de Hielo Norte, región de Aysén, Chile: Relación con variaciones climáticas. Revista de geografía Norte Grande 69:121–47. doi:https://doi.org/10.4067/S0718-34022018000100121.
- Masiokas, M. H., S. Delgado, P. Pitte, E. Berthier, R. Villalba, P. Skvarca, and S. Marinsek. 2015. Inventory and recent changes of small glaciers on the northeast margin of the Southern Patagonia Icefield, Argentina. Journal of Glaciology 61:511–23. doi:https://doi.org/10.3189/2015JoG14J094.
- Matthews, J. A. 1992. The ecology of recently deglaciated terrain. Cambridge: Cambridge University Press.
- Nemergut, D. R., S. P. Anderson, C. C. Cleveland, A. P. Martin, A. E. Miller, A. Seimon, and S. K. Schmidt. 2007. Microbial community succession in an unvegetated, recently deglaciated soil. Microbial Ecology 53:110–22. doi:https://doi.org/10.1007/s00248-006-9144-7.
- Nicol, G. W., D. Tscherko, T. M. Embley, and J. I. Prosser. 2005. Primary succession of soil crenarchaeota across a receding glacier foreland. Environmental Microbiology 7:337–47. doi:https://doi.org/10.1111/j.1462-2920.2005.00698.x.
- Pérez, C. A., M. R. Carmona, and J. J. Armesto. 2010. Non‐symbiotic nitrogen fixation during leaf litter decomposition in an old‐growth temperate rain forest of Chiloé Island, southern Chile: Effects of single versus mixed species litter. Austral Ecology 35:148–56.
- Pérez, C. A., W. A. Silva, J. C. Aravena, and J. J. Armesto. 2017. Limitations and relevance of biological nitrogen fixation during postglacial succession in Cordillera Darwin, Tierra del Fuego, Chile. Arctic, Antarctic, and Alpine Research 49:29–42. doi:https://doi.org/10.1657/AAAR0016-014.
- Poly, F., L. J. Monrozier, and R. Bally. 2001. Improvement in RFLP procedure to study the community of nitrogen fixers in soil through the diversity of nifH gene. Research in Microbiology 152:95–103. doi:https://doi.org/10.1016/S0923-2508(00)01172-4.
- Prévost-Bouré, N. C., R. Christen, S. Dequiedt, C. Mougel, M. Lelièvre, C. Jolivet, H. R. Shahbazkia, J. Guillou, D. Arrouays, and L. Ranjard. 2011. Validation and application of a PCR primer set to quantify fungal communities in the soil environment by real-time quantitative PCR. PloS One 6 (9):e24166.
- R Development Core Team. 2014. R: A language and environment for statistical computing. Vienna: R Foundation for Statistical Computing. Available at: http://www.Rproject.org/ .
- Rasmussen, L., H. Conway, and C. Raymond. 2007. Influence of upper air conditions on the Patagonia Icefields. Global and Planetary Change 59:203–16. doi:https://doi.org/10.1016/j.gloplacha.2006.11.025.
- Reed, S. C., C. C. Cleveland, and A. R. Townsend. 2011. Functional ecology of free-living nitrogen fixation: A contemporary perspective. Annual Review of Ecology, Evolution, and Systematics 42:489–512. doi:https://doi.org/10.1146/annurev-ecolsys-102710-145034.
- Rignot, E., A. Rivera, and G. Casass. 2003. Contribution of the Patagonia Icefields of South America to sea level rise. Science 302:434–37. doi:https://doi.org/10.1126/science.1087393.
- Schmidt, S. K., D. R. Nemergut, J. L. Darcy, and R. Lynch. 2014. Do bacterial and fungal communities assemble differently during primary succession? Molecular Ecology 23:254–58. doi:https://doi.org/10.1111/mec.12589.
- Schmidt, S. K., S. C. Reed, D. R. Nemergut, A. Stuart Grandy, C. C. Cleveland, M. N. Weintraub, A. W. Hilland, E. K. Costello, A. F. Meyer, J. C. Neff, et al. 2008. The earliest stages of ecosystem succession in high-elevation (5000 meters above sea level), recently deglaciated soils. Proceedings of the Royal Society B: Biological Sciences 275:2793–802. doi:https://doi.org/10.1098/rspb.2008.0808.
- Schuette, U. M., Z. Abdo, J. Foster, J. Ravel, J. Bunge, B. Solheim, and L. J. Forney. 2010. Bacterial diversity in a glacier foreland of the high Arctic. Molecular Ecology 19:54–66. doi:https://doi.org/10.1111/j.1365-294X.2009.04479.x.
- Schweizer, S. A., C. Hoeschen, S. Schlüter, I. Kögel‐Knabner, and C. W. Mueller. 2018. Rapid soil formation after glacial retreat shaped by spatial patterns of organic matter accrual in microaggregates. Global Change Biology 24:1637–50.
- Smith, C. J., and A. M. Osborn. 2009. Advantages and limitations of quantitative PCR (Q- PCR)-based approaches in microbial ecology. FEMS Microbiology Ecology 67:6–20. doi:https://doi.org/10.1111/j.1574-6941.2008.00629.x.
- Steubing, L., and A. Fangmeier. 1992. Pflanzenökologisches Praktikum. Berlin: Parey Verlag.
- Thébault, A., J. C. Clément, S. Ibanez, J. Roy, R. A. Geremia, C. A. Pérez, A. Buttler, Y. Estienne, and S. Lavorel. 2014. Nitrogen limitation and microbial diversity at the treeline. Oikos 123:729–40. doi:https://doi.org/10.1111/j.1600-0706.2013.00860.x.
- Tscherko, D., J. Rustemeier, A. Richter, W. Wanek, and E. Kandeler. 2003. Functional diversity of the soil microflora in primary succession across two glacier forelands in the Central Alps. European Journal of Soil Science 54:685–96. doi:https://doi.org/10.1046/j.1351-0754.2003.0570.x.
- Vitousek, P. M., K. Cassman, C. C. Cleveland, T. E. Crews, C. B. Field, N. B. Grimm, R. W. Howarth, R. Marino, L. A. Martinelli, E. B. Rastetter, et al. 2002. Towards an ecological understanding of biological nitrogen fixation. Biogeochemistry 58:1–45. doi:https://doi.org/10.1023/A:1015798428743.
- Walker, L. R., and R. Moral. 2003. Primary succession and ecosystem rehabilitation. Cambridge, UK: Cambridge University Press.
- Wang, Y., A. Ma, G. Liu, J. Ma, J. Wei, H. Zhou, K. K. Brandt, and G. Zhuang. 2020. Potential feedback mediated by soil microbiome response to warming in a glacier forefield. Global Change Biology 26:697–708. doi:https://doi.org/10.1111/gcb.14936.
- Wardle, D. A. 2006. The influence of biotic interactions on soil biodiversity. Ecology Letters 9:870–86. doi:https://doi.org/10.1111/j.1461-0248.2006.00931.x.
- Wietrzyk-Pełka, P., K. Rola, W. Szymański, and M. H. Węgrzyn. 2019. Organic carbon accumulation in the glacier forelands with regard to variability of environmental conditions in different ecogenesis stages of High Arctic ecosystems. Science of the Total Environment 717:135151.
- Williamson, W. M., D. A. Wardle, and G. W. Yeates. 2005. Changes in soil microbial and nematode communities during ecosystem decline across a long-term chronosequence. Soil Biology & Biochemistry 37:1289–301. doi:https://doi.org/10.1016/j.soilbio.2004.11.025.
- Willis, M. J., A. K. Melkonian, M. E. Pritchard, and J. M. Ramage. 2012. Ice loss rates at the Northern Patagonian Ice Field derived using a decade of satellite remote sensing. Remote Sensing of Environment 117:184–98. doi:https://doi.org/10.1016/j.rse.2011.09.017.
- Zarsky, J. D., M. Stibal, A. Hodson, B. Sattler, M. Schostag, L. H. Hansen, C. S. Jacobsen, and R. Psenner. 2013. Large cryoconite aggregates on a Svalbard glacier support a diverse microbial community including ammonia-oxidizing archaea. Environmental Research Letters 8:035044. doi:https://doi.org/10.1088/1748-9326/8/3/035044.
- Zhang, G., J. Bai, J. Jia, W. Wang, X. Wang, Q. Zhao, and Q. Lu. 2019. Shifts of soil microbial community composition along a short-term invasion chronosequence of Spartina alterniflora in a Chinese estuary. Science of the Total Environment 657:222–33. doi:https://doi.org/10.1016/j.scitotenv.2018.12.061.
- Zhu, Y., Y. Zhang, H. Chen, Y. Wang, F. Cao, W. Sun, X. Qi, Y. Zhao, and F. Xu. 2020. Soil properties and microbial diversity at the frontier of Laohugou Glacier retreat in Qilian Mountains. Current Microbiology 77:425–33. doi:https://doi.org/10.1007/s00284-019-01846-x.
- Zumsteg, A., J. Luster, H. Göransson, R. H. Smittenberg, I. Brunner, S. M. Bernasconi, J. Zeyer, and B. Frey. 2012. Bacterial, archaeal and fungal succession in the forefield of a receding glacier. Microbial Ecology 63:552–64.