
ABSTRACT
Venezuela will soon become the first Andean country to lose all of its glaciers, as the “eternal snows” of the Sierra Nevada de Mérida (SNM) disappear. Although documentation of glacier retreat in Venezuela commenced over a century ago, an updated reconstruction at sufficient spatial resolution is warranted. Our objectives were to (a) produce detailed multitemporal maps of glacier cover in the SNM since 1952 and revise historical estimates for 1910 and (b) document changes in cover and rates of glacier retreat of the last Venezuelan glacier at Humboldt Peak. We integrated multiple information sources, including topographic/geomorphic evidence, high-resolution aerial photographs, satellite images, historical maps, panoramic photos, and field observations. We present 1:5,000 maps of glacier cover between 1952 and 2019 and revise the maps of 1910. In Venezuela, glacial area has decreased 98 percent between 1952 and 2019 (from 2.317 km2 to 0.046 km2). Glacier retreat rates increased after 1998, with a maximum of −16.9 percent year−1 between 2016 and 2019. These new maps should provide an essential tool for biophysical, ecological, and historical studies and a key reference for promoting awareness on climate change in the tropical Andes, where glaciers are intimately linked with cultural identity.
Introduction
Glacier retreat in mountainous regions has accelerated worldwide within the last fifty years, triggering efforts to document what will soon become legacy landscapes (Barry Citation2006; Zemp et al. Citation2015; Huss et al. Citation2017). In the tropical Andes, the rate of glacier retreat after 1950 is above the world’s average, with a notable increase after 1970 (Rabatel et al. Citation2013; Veettil and Kamp Citation2017). This general trend has been paralleled by an observed average increase of surface air temperature of 0.1°C per decade over the last seventy years in the tropical Andean region, with even faster rates of 0.3°C per decade after 1980, particularly at high elevations (Vuille et al. Citation2008; Magrin et al. Citation2014). Venezuela provides a particularly interesting case study, with only one glacier remaining in the country. This glacier is located on Humboldt Peak (4,942 m a.s.l.), whereas all other peaks above 4,700 m a.s.l. have lost all of their glacier cover during the last century (Schubert Citation1998; Braun and Bezada Citation2013). This includes the highest summit in the country, Bolivar Peak (4,978 m a.s.l.), where the small remnant firn patch on its north face disappeared early in 2020.
The highest section of the Venezuelan Andes is located in the Sierra Nevada National Park, a protected area created in 1952. Most of the Sierra Nevada National Park glaciers were visible from the nearby city of Mérida and constituted an important component of the cultural landscape. For many tourists and mountaineers, the presence of glaciers in a tropical country was a major draw to Mérida, the so-called city of eternal snows. The attention prompted installation of a cable car in 1960 that runs from the city of Mérida to Pico Espejo at 4,765 m a.s.l. It remains the longest and highest cable car in the world. The glaciers inspired myths and legends from ancient times and were a true trademark of the city and the region (e.g., Febres-Cordero Citation1930). Today, all glaciers formerly visible from the main populated areas have effectively disappeared, radically changing the Sierra as seen from the city. The last Venezuelan glacier on Humboldt Peak lies in a remote area, with the nearest access requiring a two-day walk from the cable car station at Pico Espejo. Its disappearance in a few years will mark the end of an era for the country, making it the first postglacial nation in the Andes.
The tropical Andes constitute the most extensively glaciated tropical area in the world, with more than 95 percent of the total area of tropical glaciers (Veettil and Kamp Citation2017). Glacier retreat is impacting local communities (Mote and Kaser Citation2007; Chevallier et al. Citation2010; Buytaert and De Bièvre Citation2012), especially in the dry central Andes of Bolivia and Peru, where they play a significant role in the hydrological dynamics of important catchments for both urban and rural populations (Mark Citation2008; Vuille et al. Citation2008, Citation2018; Mark et al. Citation2017). In the humid northern Andes of Colombia and Venezuela, glacier retreat is expected to have a comparatively limited impact on water provision for human populations due to the smaller spatial extent of glaciers, the remote location of glaciated peaks relative to urban population centers, and the major role of Andean forests and paramo vegetation and soils in regulating water provision (Morán-Tejeda et al. Citation2018). However, glacier loss will undoubtedly impact local tropical alpine biodiversity and downstream ecosystems and landscapes, including the dynamics of river and wetland ecosystems in catchments with glacier influence (Dangles et al. Citation2017; Polk et al. Citation2017; Young et al. Citation2017; Rabatel, Ceballos et al. Citation2017; Cuesta et al. Citation2019).
The Northern Andes are projected to be glacier free by 2050 (Schauwecker et al. Citation2017), providing a unique opportunity to study the last stages of glacier retreat and its ecological and social consequences in the highland tropics. Of particular interest are studies of primary succession in rapidly deglaciating areas with a space-for-time substitution approach (i.e., chronosequence), which are notoriously scarce in the tropical Andes and require detailed multitemporal maps of glacier cover (e.g., Zimmer et al. Citation2018). Such studies could provide important information on the dynamic response of high Andean vegetation under rapid climate change and the development of novel no-analog plant communities (sensu Williams and Jackson Citation2007).
Due to the small size of the remaining glaciers in the northern Andes, maps suitable for a chronosequence analysis would need to be sufficiently accurate and provide enough historical depth. Maps for such purposes are generally produced using high spatial resolution remotely sensed imagery (e.g., Ommanney, Ferrigno, and Williams Citation2002; Campbell and Resler Citation2015), but few studies in the tropical Andes have analyzed changes in glacier cover using high-resolution satellite images (Albert et al. Citation2014; Veettil and Kamp Citation2017). Research in hydrology, extremophile bacteria, paleoecology, climate change monitoring, and the historical and cultural importance of glaciers would also require sufficiently accurate spatial information to limit uncertainty in geographic information systems (GIS)-based analyses of the areas involved. However, for very small glaciers, the resolution provided by commonly used publicly available satellite imagery such as Landsat (~30 m) is not enough (for an area of 0.1 km2, as mapped in this study, a 30-m resolution would imply an error in area estimate of around 30 percent). Moreover, most satellite image archives do not provide the desired temporal or historical depth.
Therefore, a detailed analysis requires the integration of diverse sources of information, including aerial photographs, historical maps and pictures, and panoramic photographs, in order to recreate historical glacier boundaries (see reviews for the tropical Andes in Veettil and Kamp [Citation2017] and Veettil et al. [Citation2017] and examples in Schubert Citation1992; Brecher and Thompson Citation1993; Jordan et al. Citation2005; Ceballos et al. Citation2006; Soruco et al. Citation2009). For example, the studies of the historical extent of glaciers in neighboring Colombia have combined aerial photos between the late 1940s and the 1990s (which are considered particularly appropriate because of the high spatial resolution) and Landsat from the mid-1990s to early 2000s. Higher resolution images have been used for recent studies (between 2.5- and 10-m resolution; e.g., QuickBird, ALOS, and Landsat 8; Rabatel, Francou et al. Citation2017).
Although there are ongoing efforts to monitor the effects of climate change on vegetation dynamics in the Venezuelan high Andes (Cuesta et al. Citation2017), there is no official program for glacier monitoring, as there is in Colombia and other countries along the Andes (Rabatel et al. Citation2013; IDEAM Citation2017). Information on glacier retreat in the Sierra Nevada de Mérida was summarized by Braun and Bezada (Citation2013). These authors reviewed historical evidence and maps of the glaciated areas since the early nineteenth century. The first available map was published by Jahn (Citation1925) and estimated the extent of the glaciers in 1910 based on personal observations, but it was not until the work of Carlos Schubert starting in the 1970s that more reliable maps were produced (see Schubert and Clapperton Citation1990; Schubert Citation1998). However, Schubert’s maps of the glaciers in the Sierra Nevada for 1910 and 1952, based on Jahn’s earlier maps and aerial photographs, had a very coarse resolution (1:100,000 scale). A more recent analysis of Humboldt Peak glacier cover by Morris, Poole, and Klein (Citation2006) for 1985–1988 and 2000–2003 and Braun and Bezada (Citation2013) for 2009–2011 used Landsat and ASTER images with a 15- to 30-m pixel resolution. Braun and Bezada’s (2013) estimates are also based on direct field observations (including Global Positioning System [GPS] reconstruction of the glacier contour), making them more reliable.
Interest in detailed studies of glacier coverage in Venezuela has recently renewed, both because of the imminent disappearance of the last glacier on Humboldt Peak and because of demand from research projects related to ice retreat. For example, in a series of pioneer studies in the tropical Andes, psychrophyllic bacteria were recovered from Humboldt Peak glacier (Ball et al. Citation2014) and Bolívar Peak glacier (Balcazar et al. Citation2015; Rondón et al. Citation2016). Currently, a detailed study of primary succession with a chronosequence approach is underway on Humboldt Peak, of which the work presented here is a key first step (within the framework of the Last Venezuelan Glacier project, funded by the National Geographic Society).
Multitemporal maps, depicting the extent and localization of glaciated areas in the Sierra Nevada, with a resolution of at least 3 m and useful for research involving the last stages of glacier retreat are, however, lacking. Fortunately, high-resolution remotely sensed imagery is available for the Sierra Nevada de Mérida glaciers since the 1950s (including aerial photographs and more recent satellite images). Here, our objectives were to (a) produce detailed multitemporal maps of the change in glacier cover in the Sierra Nevada de Mérida since 1952 and revise previous historical estimates; (b) document recent changes in the cover of the last Venezuelan glacier at Humboldt Peak; and (c) estimate, based on this information, the rates of change in glacier cover during the last century. To meet these objectives, we integrated multiple sources of information into a GIS, including basic cartographic information, high-resolution aerial photography and satellite images, historical panoramic photos, reports from veteran mountaineers, recent field observations, and unmanned aerial vehicle images, to produce high-resolution (2.5 m) and multitemporal maps of the glacier caps of Sierra Nevada de Mérida. Mapping was possible for years 1952, 1998, 2009, 2015, 2016, and 2019. Additionally, we used georeferenced historical photographs and geomorphological evidences to provide a reasonable estimate of the glacier cover extent in 1910, revising the earlier estimates for that year on the maps by Jahn (Citation1925) and Schubert (Citation1970).
Methods
Study area, historical and biophysical context
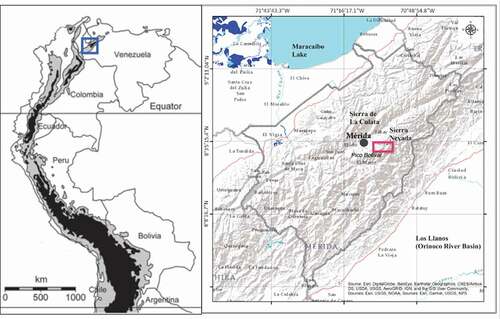
The Cordillera de Mérida, located in western Venezuela, extends approximately 450 km in a southwest to northeast direction from the Táchira depression on the Colombian border (Schubert and Vivas Citation1993). The Sierra Nevada de Mérida constitutes the southeastern range of the Cordillera, separating the central valley of the Chama River watershed (which drains into the Maracaibo Lake basin) from the Orinoco plains and basin (). In the central portion of the Sierra Nevada, the Cordillera attains the highest elevations in the country, including, from west to east, the León (4,720 m a.s.l.), Toro (4,758 m a.s.l.), Bolivar (4,978 m a.s.l.), La Concha (4,922 m a.s.l.), Humboldt (4,942 m a.s.l.), and Bonpland (4,883 m a.s.l.) peaks.
Figure 1. Study region map. Left: The Northern Andes of South America. Right: Detail of the area indicated by the blue square, Mérida State in the Venezuelan Andes. Shown are the city of Mérida and the location of the Sierra Nevada. The area of study is indicated by the red rectangle, corresponding to the region mapped in . Adapted from Anthelme et al. (Citation2014)
As they shrank and fractured into distinct ice masses, the glaciers were renamed (Supplemental ). Bolivar Peak, for example, is referred to as La Columna by Jahn (Citation1925), who reported glaciers named Espejo, Bourgoin, and Karsten on the north face and Timoncito and Las Hermanas on the southern slope of the peak. The glacier that extended between Humboldt and Bonpland peaks was traditionally called La Corona, with parts of it later called Sinigüis (Schubert Citation1998), Sievers, La Plazuela, or Coromoto glaciers by different authors (for a discussion on naming, see Braun and Bezada Citation2013). Its remnant is the only extant glacier in Venezuela and is lately referred to as Humboldt’s glacier or Humboldt Peak glacier, having retreated to a small area on a relatively protected saddle close to that peak. Due to the wide inconsistencies in naming in the literature and in order to avoid confusion, we choose not to give specific names to the glaciers but rather to refer to three general glaciated areas around the following peaks
La Concha, 4,922 m a.s.l. (8°33′19″ N, 71°01′36.7″ W). Also known as La Garza, it had the smallest of the glaciated areas, until its disappearance in 1990.
Bolívar, 4,980 m a.s.l. (8°32′25.5″ N, 71°02′52.6″ W). Referred to as La Columna in earlier texts (Blumenthal Citation1923; Jahn Citation1925; Gunther Citation1940), it is the highest peak in the Sierra Nevada. Its glacier cover can be considered extinct by 2017, although the remaining ice was already too small to be considered a glacier by 2011 (Braun and Bezada Citation2013).
Humboldt, 4,942 m a.s.l. (8°33′0.8″ N, 71°59′50.6″ W). The only remaining glacier covered the area between this peak and nearby Bonpland (4,883 m a.s.l.) and was often called La Corona.
Table 1. Results for the change in surface area, perimeter, and elevation of the glacier terminus and highest portion (maximum) for the three glaciated regions/peaks in Sierra Nevada de Mérida (Venezuela) since 1910, based on our analyses of glacier cover and extent for each date
A list of the names most commonly quoted in the literature for the glaciers in these three areas is given in Supplementary Table 1.
Geology of the region is characterized by the Iglesias group formation at the highest elevations, which corresponds to Precambrian high-grade metamorphic rocks including banded gneiss, schist, and amphibolite, with frequent granitic dikes and quartz veins (Schubert Citation1970). The Sierra Nevada de Mérida attained its present elevations toward the mid-Pliocene (ca. 4 my BP, Schubert and Vivas Citation1993).
Glaciers mapped in this study have been retreating since the local expression of the Little Ice Age (Piedras Blancas Cold Phase) that occurred between the fourteenth and nineteenth centuries in the region, with moraines at the terminus reaching c. 4,200 to 4,300 m elevation (Rull et al. Citation1987; Salgado-Labouriau Citation1989; Mahaney et al. Citation2000; Jomelli et al. Citation2009). Between 1250 and 1820 AD, average air temperatures are estimated to have been 3.2 ± 1.4°C cooler and precipitation about 22 percent higher than at present (Polissar et al. Citation2006). However, erosional and depositional glacial features found in the vicinity of the study region correspond to previous glacial advances. Geomorphological studies have revealed well-preserved erosional glacial features and landforms above 3,000 m of elevation (Schubert Citation1974; Schubert and Clapperton Citation1990; Schubert and Vivas Citation1993; Rull Citation1996) that correspond to the Last Glacial Maximum, which occurred between 22,750 and 19,960 cal. yr BP (Stansell et al. Citation2005). Subsequently, during the Younger Dryas (Mucubají Cold Phase, 12,850 to 11,750 years BP) advance, the glacier terminus extended down to 4,000 m elevation in the area near the Humboldt and Bonpland Peaks (Mahaney et al. Citation2008).
Current annual precipitation at the highest elevations in the Sierra Nevada de Mérida is estimated to be 1,200 to 1,000 mm with high interannual variability. Dry periods with significant reductions in precipitation are associated with El Niño–Southern Oscillation years (Andressen Citation2007; Rodríguez-Morales et al. Citation2019). In the inner tropics, the frequency and intensity of El Niño years, with lower precipitation, higher temperatures, and reduced snowfall at high elevations, have also been associated with increased rates of glacier retreat, particularly after the 1970s (Rabatel, Ceballos et al. Citation2017; Vuille et al. Citation2018; IDEAM Citation2019).
As is common in mountainous regions in the inner tropics above the cloud forest belt (Sarmiento Citation1986), both precipitation and temperature decrease with elevation in the study area from 1,811 mm mean annual precipitation and 7.1°C mean temperature at La Aguada cable car station (3,446 m) to 1,173 mm and −0.4°C in the highest station where records are available in the country (4,766 m). Mean temperature decreases 0.63°C for every 100 m increase in elevation, and the number of days lower than 0°C ranges from 3 at La Aguada to 360 at Pico Espejo. Although there is little annual variability in temperature (less than 3°C between the coldest and the warmest month), precipitation is seasonal due to the marked influence of the displacement of the Intertropical Convergence Zone (associated with the highest precipitation). The dry period extends between December and March, when the influence of the northeastern trade winds predominates (see Andressen Citation2007). Hence, both rainfall and snowfall concentrate during the wet season, with snow increasing in frequency with elevation above c. 4,000 m. However, despite its importance for analyzing glacier mass balance and dynamics, there is no published data for this region on the spatial–temporal changes in snow.
Data and preprocessing for deriving glacier boundaries
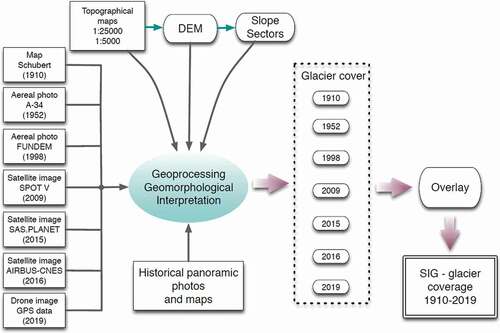
Meeting our mapping-based objectives necessitated an integrative methodology that involved synthesizing primary and secondary information obtained from a variety of historical and contemporary sources (). We were limited by data consistency, availability, resolution, and quality. Thus, mapping of glacier boundaries for these areas was restricted to specific years, so that the historical record is neither continuous nor available for fixed time intervals. Mapping of glacier margins and areal cover of glaciers became more frequent after high-resolution satellite images were available for the region beginning in 2009.
Figure 2. Synthesis of the main sources of information and the methods used to integrate this information and estimate changes in glacier coverage between 1910 and 2019 in the Sierra Nevada de Mérida, Venezuela
Because there are limited spatial data layers available for Venezuela, we generated a base map for mapping glacier cover for each of our dates of interest. We used ArcGIS (version 10.3.1) to digitize basic cartographic information (e.g., landmarks) from the official maps of the Dirección de Cartografía Nacional of Venezuela at a 1:25,000 scale (1975–1986). We georeferenced the maps using the official Venezuelan reference system, REGVEN datum. In particular, we were interested in capturing the hydrographic network, mountain trekking routes, names (for peaks, lagoons, and villages), and contour lines at 20-m intervals. Using the contour layer as input, we generated a digital elevation model (~20-m resolution) using a triangular interpolation network algorithm in ArcGIS 3D-Analyst.
Georeferencing and geometric corrections were conducted using known control points (e.g., salient topographic features) on a stereoscopic pair of aerial photographs of the entire study area from 1952 (aerial photos A-34, scale 1:20,000) and three aerial photographs from 1998 (Photosur Geomat Inc., Fondo de Desarrollo Nacional (FONDEN) project, 1:20,000 scale). The same procedure was applied to the satellite images used: a Spot V panchromatic image at 2.5-m spatial resolution for 2009 and 1-m resolution AIRBUS CNES images (downloaded from Bing Maps) for 2015 and 2016 (RGB bands). Approximately 200 control points distributed over the entire images were used in each case; these points included topographical features as well as hiking paths and camping sites used in the rescue operations by Defensa Civil Mérida (for which precise location data were available). Images were all captured during the dry season (December–March) and were cloud free on the glaciated areas of interest.
Due to the small size of the glaciers and their limited number, the delineation of the glacier outlines was done manually; manual delineation can be more precise than automatic detection of glacier ice when glaciers are small (below 5 km2; see Gardent et al. Citation2014; Rabatel, Francou et al. Citation2017). We combined the digitized cartographic/topographic information and the information provided by the satellite imagery to identify and vectorize the contour of the areas covered by glaciers. For the aerial photos, photointerpretation was aided by the use of stereoscopic pairs. For the panchromatic aerial and satellite images from 1952, 1998, and 2009, photointerpretation was also assisted by manual pixel classification. For pixels where ice could be mistaken for rocks or other features of the terrain, the color index, in a gray scale ranging from 0 to 255, was determined and compared with pixels in the same image where ice presence was certain. In general, pixels with high saturation values (above 240) were considered to be ice; decisions on those with values above 230 were additionally informed by field data. For the 2015–2016 multispectral images, visual interpretation was used to delineate the glacial areas. Other information used in the photointerpretation process included visual reference points made from personal observations obtained during field visits between 1998 and 2019; interpretation of the spatial patterns of shadows, surface textures, slope orientation, and geomorphic features (i.e., Little Ice Age [LIA] moraines, glacially sculpted bedrock, cirques); and drone imagery obtained in January and December 2019. Additional sources of information, including historical maps, panoramic photographs, informal communications with mountaineers, and ground control points collected in the field were integrated into the reconstruction, when appropriate. Examples of the historical photographs used are depicted in . Supplemental Table 2 presents a list of the images used in this study, and Supplemental Table 3 gives details of aerial, satellite, and GPS data.
Table 2. Estimated average rates of retreat of the Humboldt Peak glacier (Venezuela), during the 1910–2019 period. Rates were calculated in terms of the average percentage loss in glacier area per year and in terms of the average change per year in elevation (vertical) and projected retreat in distance (longitudinal) of the glacier terminus on the northwest face
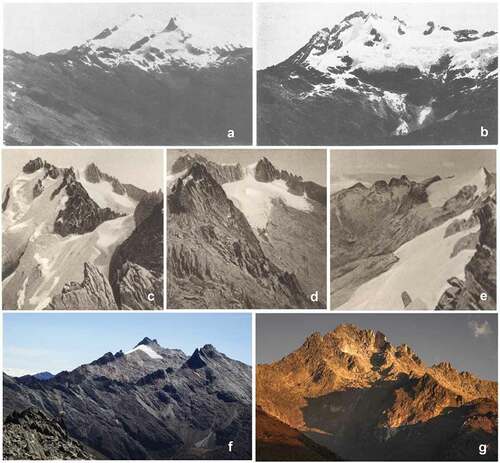
Figure 3. Some of the historic panoramic photographs used in this work and comparison with recent images: (A) La Corona glacier, then covering Humboldt and Bonpland peaks, seen from Pico Espejo in 1910 (Jahn Citation1925); (B) northwest face of Bolívar peak in 1910 (Jahn Citation1925); (C) southwest face of Bolívar peak in 1922 (Blumenthal 1922); (D) south face of Bolívar in 1922 (Blumenthal, 1922); (E) west side of La Concha seen from Bolívar (Blumenthal 1922); (F) La Corona glacier from Pico Espejo in 2013; and (G) northwest face of Bolívar in 2020 . Photos in (F) and (G) by J.M. Romero, used with permission
Methods for reconstructing glacier margins were dependent on data available for the year of assessment, as we detail below:
Year 1910: We used maps by Jahn (Citation1925) in Schubert (Citation1998). Because these maps lacked adequate cartographic precision, we georeferenced them using distinct topographic reference features (peaks, lakes, and rivers). We then overlaid the georeferenced map on the 1952 aerial photography (Mission 010494, scale 1:20,000) and evident geomorphological features were used to fine-tune the glacier contour lines from the map (i.e., moraine deposits, glacially sculpted bedrock, and glacial striations resulting from recent glacier erosion). In particular, the position of recessional moraines from the Little Ice Age, which are located at approximately 4,200–4,300 m a.s.l. on the northwest flanks of Humboldt Peaks (determined by lichenometric estimations) were particularly useful as reference points (Rull and Schubert 1989; Mahaney et al. Citation2000, Citation2009). Examples of these moraines in a photograph by Jahn (1910) and one taken in 2019 during this study are shown in . In addition, panoramic photos by Jahn (1910–1912), Blumenthal (1922), and Jagenberg (1936) were used to complement the analysis. Estimation of glacier extents during this time period, especially for the southern slopes of Humboldt and Bonpland peaks (La Corona glacier), was limited by the absence of reference imagery.
Year 1952: The basis for analysis of glacier cover in the three glaciated regions of the Sierra Nevada was the earliest photogrammetric aerial photograph available for the Sierra Nevada (1952). The image was taken during the dry season and has no snow or cloud cover. We also used for reference of the area covered by glaciers in this period a panoramic photo taken from an airplane and published in the book by Marrero (Citation1964). This aerial photo, as well as panoramic photos by Betancourt (1950), Díaz-Walter (1950), and Anzil (1957), provided information of sectors that had glacier cover at those or earlier dates.
Year 1998: The analysis was based on the detailed aerial photographs by FONDEN (1998; 1:20,000), which were taken during the dry season and have no snow or cloud cover, and complemented using the coordinates of control points taken in the field (Instituto Geográfico Simón Bolívar expedition 2004), interviews with veteran mountaineers (José Betancourt, Carlos Reyes, José Arévalo, Nelson Rojas), and panoramic photos by Rangel and Valero (1998). Stills from a video of a rescue in the Humboldt Peak by Protección Civil Mérida in 1998 also provided context.
Year 2009: A Spot V satellite image with a resolution of 2.5 m (panchromatic) was used. Informal interviews with climbers (see above) were also useful. This image was taken during the dry season and has no snow. It is also free from cloud cover.
Years 2015–2016: We used Airbus CNES satellite imagery (1-m resolution, 2015–2016, RGB combination). High-resolution images of Humboldt Peak area were downloaded from SAS Planet (at that point the only remaining glacier area in Sierra Nevada). Images were taken during the dry season and are free of snow and cloud cover.
Year 2019: Information on the position of the receding edge of the glacier was directly collected in the field along 430 m of the contour (north face, east to west) with thirty-four control points, using a GARMIN GPSMAP 62s GPS with a ±3 m precision. Drone images (Hasselbad camera, 1-in. sensor CMOS 20 Mp, 542 × 3,648 resolution) taken in January and December were also used. The only available drone images were not orthogonal and were used as panoramic images, supplementing the field data.
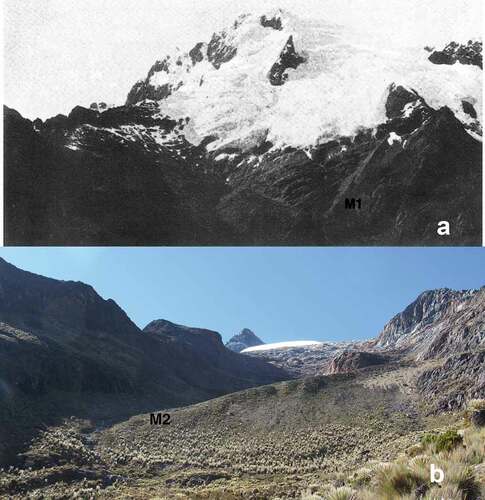
Figure 4. Examples of recessional moraines from the LIA in Humboldt Peak. (A) A 1910 photograph by Jahn (Jahn Citation1925) of the northern face, La Verde valley. (B) A 2019 photograph of the northwest face, Las Cascadas valley by L.D. Llambí. Labels M1, M2 correspond to those of the map in
The contour lines of glacier cover for the different dates were thus integrated into the GIS to produce final maps for the changes in the glaciated areas at Bolivar, La Concha, and Humboldt at a 1:5,000 scale.
Calculating glacier attributes
Once glacier margins were obtained, we calculated glacier area cover and perimeter of the glacier outline using ArcGIS toolbox (“Calculate Geometry” tools). Uncertainties in area were calculated by multiplying the perimeter with the estimated longitudinal error E, found with the formula:
E = √(p2 + g2),
where p is the pixel size in meters and g is the geometric correction error in meters (note that this calculation does not apply to the 1910 estimation).
Next, we chose points along the glacier terminus to estimate the elevation for each year. Elevations were recorded at sites representative of the general condition of the glacier position, from the two main orientations of the Sierra Nevada (i.e., northwest-facing slopes, oriented toward the inter-Andean valley of the Chama River and the city of Mérida, and southeast-facing slopes, oriented toward the Venezuelan Orinoco Plains in the external flanks of the Sierra). We manually selected representative points along the terminus of each glacier to estimate the elevation of the glacier termini. The same process was conducted to estimate maximum glacier elevation.
We estimated the rate of retreat of Humboldt Peak glacier for the study time periods using two complementary approaches. First, based on the calculated surface area for each year for which we generated detailed maps, we calculated an average percentage yearly rate of glacier area loss based on the area difference between dates, assuming a constant retreat rate for each period (the most parsimonious option in the absence of additional information). Second, we obtained the average rate of change per year of the elevation of the terminus by dividing the elevation difference by the number of years in each period considered. This was done in the mountain face with maximum extension (northwest), where enough data are available for the calculation. Third, we used a line drawn between the point in the 1910 terminus and the glacier’s maximum altitude point to find the distance between glacier terminus and this point for each year. The average change in distance per year was then found. This method was not applied to the other glaciers because they melted too early to allow comparisons of changes in retreat rates between different periods.
Results
The integrated methodology allowed for a high-resolution (1:5,000 scale) estimate of the glacier extent in the years 1952, 1998, 2009, 2015, 2016, and 2019 and for a revised but conservative estimate of the glaciated areas in 1910, due to data limitations. Glacier coverage for these dates in the three glaciated areas at Bolívar, La Concha, and Humboldt is shown in ; detailed maps for each glaciated area are depicted in and . Morphometric and geographic characteristics of each glacier and glacier terminus are documented in and .
Figure 5. General view of glaciated areas in Sierra Nevada de Mérida (Venezuela), between Bolívar and Humboldt peaks from 1910 to 2019, drawn over a Spot satellite image of 2009. Main peaks and lakes (in blue) are indicated. The 1910 area should be considered a conservative estimate
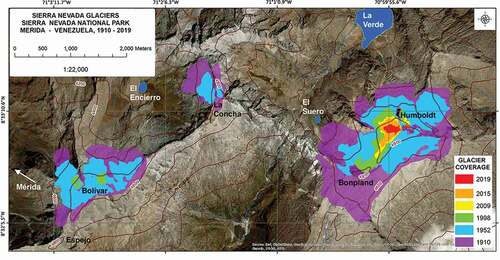
Figure 6. (A) Areas covered by the La Concha peak glaciers in 1910 and 1952, with El Encierro lake identified. The last glacier in this region (northwest side) disappeared in 1990. (B) Areas covered by glaciers around Bolivar Peak in 1910, 1952, and 1998, and the small patch in 2015 (no longer considered a glacier). Both maps are overlaid on the 1952 aerial photograph (aerial photos A-34, scale 1:20,000). The 1910 line is dashed to indicate less precision in the estimate for this date
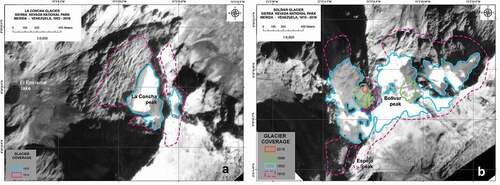
Figure 7. Areas covered by glaciers around Humboldt Peak, 1910–2019, overlaid on a Spot satellite image of 2009. The 1910 line is dashed to indicate less precision in the estimate for this date. LIA moraines in La Verde valley (M1), Las Cascadas valley (M2), and near El Suero lake (M3) are indicated
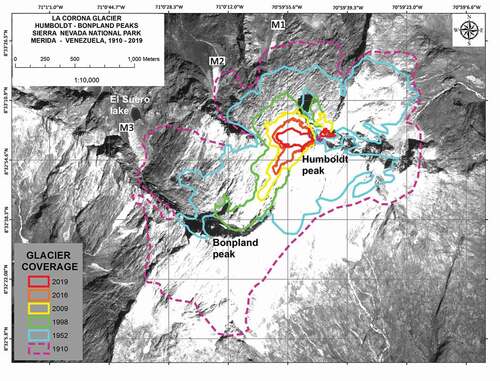
Figure 8. Estimates of surface area (km2) covered by glaciers for different dates between 1911 and 2019 in the Sierra Nevada de Mérida, Venezuela. (A) Sum of the total area for the three studied peaks (Sierra Nevada Total) as well as the desegregated glacier area for Humboldt, Bolívar, and La Concha Peaks. (B) Detail of the surface area for Humboldt Peak glaciers between 1998 and 2019
Mapping for 1910 indicated total glacier area to be 5.026 km2 for the three glacier complexes, but this estimate is considered conservative. The small patch of ice remaining in El Toro peak until 1931 (Schubert 1992) is not included in this or any other calculation in this article, because no reliable information is available for mapping it. We note three separate glaciated areas surrounding Humboldt Peak (and Bonpland Peak), Bolívar Peak, and La Concha Peak (). The overall area we report appears more fragmented than initially reported by Jahn (Citation1925). It should be noted that the southeast side of the Humboldt glaciated area is not well documented. In general, the southeast side is less photographed for this time, with the exception of the area around Bolívar Peak, where multiple panoramic photographs allow for a confident estimate of the glacier extent.
Our maps for the 1952 glacier extent provide updates to Schubert’s (Citation1998) map for 1952. Topographic maps with a 1:25,000 resolution have been available since the mid-1980s in Venezuela. Thus, we were able to update the previous map, based on 20-m contours (compared to 200-m contours used by Schubert).
In 1952, the area covered by glaciers in Humboldt Peak was 1.613 ± 0.044 km2, followed by Bolivar and then La Concha (, ). However, at that time, the difference in perimeter between the glacier-covered areas in Humboldt and Bolivar was much smaller than would be expected from their large difference in area (Bolivar Peak’s glacier was already fragmented, whereas Humboldt Peak glacier was still characterized by a single mass). Elevations of the glacier’s terminus were always higher on the southeast side (). Humboldt Peak glacier terminus has the lowest elevation on this side, because the glacier was larger in that area than those at Bolivar or La Concha. The La Concha Peak glacier has the highest terminus elevation on the northwest side and is approximately 200 m higher than Bolívar and Humboldt Peaks’ glaciers (). Maximum glacier elevations did not differ between both flanks of the Sierra for the three glaciated areas and showed very little change over time.
Mapping of glacier extents in 1998 indicate that the slopes on the southeast side (facing the Orinoco plains) were free of ice by that time, whereas glaciated areas remained in Bolivar and Humboldt in the northwest side of the Sierra, facing the city of Mérida. The La Concha Peak was devoid of ice cover by 1998. Bolívar Peak ice cover consisted of two fragments in 1998 on the northwest and northeast faces only (). The slopes of the peak were very steep and fractured, and the remaining ice (only 0.047 ± 0.009 km2) was confined to a small area with a gentler slope (c. 35° inclination).
Mapping of the glacier extents between 2009 and 2019 was based on satellite imagery with 2.5-m pixel resolution, field data, and drone images. By 2016, the Bolívar Peak glacier was reduced to a small patch of ice in the northwest face. This last remnant disappeared in early 2020. Unfortunately, the satellite imagery for 2009 in the Bolívar peak area was partially snow covered, making it difficult to distinguish glacier ice in some places. Thus, we report only the 2016 area in the map. The glacier at Humboldt Peak can be considered the only one remaining in the Sierra Nevada after 2009, with a total estimated area of 0.046 ± 0.004 km2 by July 2019 (, and ). Since at least 2015, the slope inclination of the glacier in the distal point from the peak was significantly gentler than prior to that time, in the range of 15° to 20° (estimated from the digital elevation model), as the glacier started to become restricted to a small saddle below the peak. This may have facilitated snow accumulation in recent years (Braun and Bezada Citation2013).
depicts the sustained loss of glacier area surface between 1910 and 2019 for the Sierra Nevada de Mérida as a whole and for each of the three glacier masses at Bolívar, La Concha, and Humboldt. Between 2009 and the present, only the glacier at the base of Humboldt Peak was present, shrinking from 0.164 ± 0.019 km2 in 2009 to 0.045 ± 0.004 km2 in 2019. Based on this information, we estimate that the average rate of Humboldt Peak glacier area loss (between these periods for which reliable information is available) increased from 1.7 percent year−1 for the period between 1910 and 1952 to a maximum of 16.86 percent between 2016 and 2019 (, northwest side). Although in terms of proportional rate of area loss, the period between 1952 and 1998 showed an increased rate (3.05 percent year−1) compared to 1910 to 1952, the average rate of retreat in elevation of the glacier terminus was lower during 1952 to 1998 (3.48 m year−1) than between 1910 and 1952 (4.29 m year−1). The rate of retreat in the elevation of the glacier terminus reached a maximum of 9.09 m year−1 between 1998 and 2009 and decreased thereafter. However, the projected longitudinal rate of retreat of the glacier terminus showed the highest average values between 2016 and 2019 ().
Discussion
In this study, we reconstructed change in glacier extension in the Sierra Nevada de Mérida, Venezuela, from 1952 to 2019. We also revised the maps of glacier extent for 1910 by Jahn (Citation1925). Our analysis documents the continued process of retreat of all glaciers in the Sierra Nevada de Mérida during this last century, with an overall estimated reduction of 99.01 percent in the glaciated surface area from 1910 to 2019. Ablation has led to the complete disappearance of all the glaciers in La Concha Peak (in 1991) and Bolívar Peaks (2019–2020) and a drastic reduction in the extent of Humboldt glacier from 3.374 km2 in 1910 to a current extension of only 0.045 km2 (a 98.65 percent reduction in area).
Methodological aspects
The use of cartographic maps at a 1:25,000 scale with elevation contours every 20 m was key for georeferencing the remotely sensed images used and evaluating glacier elevation changes more precisely than in previous studies (e.g., Jahn [Citation1925], with a 1:100,000 map with no elevation contours; Schubert [1998], with a 1:50,000 map with elevation contours every 200 m). Additionally, the use of aerial photographs for 1952 (1:20,000 scale, 1.2 m pixel size) and 1998 (1:20,000 scale, 2.4 m pixel size) and satellite images (2009, 2015, 2016) with pixel sizes of 2.5 m and 1.0 m (SPOT V and AIRBUS CNES) enabled us to generate more precise maps of the position of the glaciated area than previous studies using ASTER and LANDSAT images of 15- to 30-m pixel resolution (e.g., Schubert 1998; Morris, Poole, and Klein Citation2006). This contribution is important given the small size of the glacier in the final stages of retreat (see below). Field controls and expeditions to the area were also key for making corrections to the 1998 aerial photographs of the region around Humboldt Peak and to generate the most recent map for the Humboldt glacier in 2019 (the last available maps are from 2011 by Braun and Bezada Citation2013).
Field controls and the use of other historical sources of information also proved invaluable. Inspired by the systematic pioneering work of Schubert (1992), we were able to use panoramic photographs taken between 1910 and 1998 (see examples in ). These were particularly important for correcting Jahn’s maps from 1910. Photographs from that year taken by Jahn were the oldest available, but some taken later (Blumenthal [Citation1923], unknown sources from 1925 and 1928, Jagenberg [1936]) were useful in establishing an upper limit of the glacier extent for our conservative estimate, notably in the areas north of La Concha and in the region around Humboldt and Bonpland peaks, except for the east and southeast sides, where no photos are available. Panoramic photos were also used to assist in the interpretation of the aerial photos in areas with shadows and suspected fresh snow cover, and in the manual pixel classification. This was particularly important in the analysis of the 1952 aerial photographs. Some particularly useful photographs in the Humboldt area were those of the southwest side by Gunther (Citation1940) and of the northwest by Anzil (1950), in the Bolivar–La Concha area the view from the northeast photographed by Anzil (Marrero Citation1964), and photos by Anzil taken from the Pico Espejo area in 1956. All historic photographs quoted in Supplemental were used also to validate the multitemporal maps of glacier coverage.
However, one important limitation of the study is the discontinuity in the dates that could be analyzed because of the lack of images of sufficient quality, particularly between the aerial photographs of 1952 and the images we used for 2009. The small extent of the Sierra Nevada ice cover is also problematic, because retreat for such small glaciers is strongly influenced by local topography, as we discuss below. For this reason, it is difficult to establish reliable correlations between glacier retreat and climate change, a challenge further complicated by the lack of weather stations at high elevations and reliable climate archives. There is only one station above 4,700 m in the Sierra Nevada, at Pico Espejo station of the Mérida Cable Car, and the available data have many gaps, particularly in recent years.
Comparison of our results with previous studies in the Sierra Nevada de Mérida
Our reanalysis based on Jahn’s (Citation1925) maps indicates an approximate elevation for 1910 of the glacier´s terminus in northwest side of the Sierra at 4,280 m a.s.l. (Bolivar and Humboldt). This would be consistent with indications for the elevations of LIA recessional moraines in the northwest side of the Sierra Nevada surrounding Bolivar and Humboldt c. 4,200 to 4,300 m a.s.l. (Rull and Schubert Citation1989;Mahaney et al. Citation2000, Citation2009). Similar terminus elevations have also been estimated in several glaciated areas in Colombia during the LIA (Jomelli et al. Citation2009; Rabatel, Francou et al. Citation2017). Moreover, Mahaney et al. (Citation2000) indicated that the moraines at 4,200 m a.s.l. on Humboldt Peak’s northwest face (around El Suero Lake) can be “a little more than c. 100 years of age” (p. 215; on the basis of lichenometric estimations) supporting the idea that at the start of the twentieth century the glaciers on the northwest side of the Sierra Nevada extended to near 4,200 to 4,300 m a.s.l.
Schubert (1998), based on the maps by Jahn (Citation1925) and using rudimentary planimetric techniques, estimated the total cover of the glaciers in the Sierra Nevada in 1910 at 10 km2, which is twice our more conservative estimate of 5.03 km2 (in both cases excluding the small ice patch present at that moment at El Toro Peak). This is despite the fact that Schubert’s estimates were presented as minimum area estimates. The discrepancy is probably due to a lack of cartographic accuracy in Jahn’s initial maps and problems in Schubert’s reinterpretation. When georeferenced, Schubert’s reinterpretation of the 1910 maps generates large errors. According to these maps, the southwest area of Bolívar and La Concha Peaks, where incident radiation is higher, was covered by ice in 1910, even to a larger extent than the northwest face. We find that unlikely and not supported by photographic or historic evidence, and no geomorphological features were found that could indicate the presence of glacier ice in the southwest slope of the ridge between Bolívar and La Concha Peaks.
Regarding the analysis for 1952 based on aerial photos, Schubert (1998) estimated 2.91 km2 for the Sierra Nevada and 2.03 km2 for the Humboldt–Bonpland Peaks (again, minimum area estimates), whereas our estimates are of 2.32 km2 for the whole area and 1.61 km2 for the glaciers in the Humboldt and Bonpland Peak area. Again, Schubert’s results overestimate the overall area, which is not surprising because he did not have the georeferencing and area estimation tools available today. As noted by Braun and Bezada (Citation2013), even the position of Bonpland Peak in Schubert’s map is off by 1.5 km. Using more accurate cartography, with contour lines of 20 m (instead of the 200 m ones available to Schubert), and the described integrative approach, our maps based on the 1952 images look different, and the estimated glacier surface areas are smaller.
Between 1952 and 1976, Schubert indicated no change in his estimate of 2.91 km2 for glacier cover in the Sierra Nevada, but this was based on approximate visual comparisons of the aerial photograph of 1952 with a LANDSAT 2 MSS image (with a coarse 60-m resolution). Then, there were very large discrepancies between estimates by Schubert for the Sierra Nevada in 1991 of c. 2.0 km2 (based on field observations and a qualitative assessment of LANDSAT 5 MSS images) and estimates by Morris, Poole, and Klein (Citation2006) of 0.95 and 0.83 km2 for 1985 and 1987, based on a more detailed analysis of LANDSAT 4 and 5 images (with a higher resolution of 30 m but lacking field control, which can be very important for these small glaciers; Veettil and Kamp Citation2017). For 1998 we estimated a total area of 0.433 km2 for the Sierra Nevada, with two small ice patches on the northwest face of Bolivar, and the remaining 0.386 km2 correspond to a larger continuous glacier mass on the northwest of Humboldt Peak. The closest date with data available is the estimate by Morris, Poole, and Klein (Citation2006) for the year 2000 placing the total glaciated area for the Sierra Nevada at 0.54 km2 (a larger value than our estimate, probably because of an overestimate of the small glacier area at Bolivar Peak) and a very similar value to our estimate of 0.38 km2 for Humboldt.
For 2009 we estimated 0.164 km2 for Humboldt, and Braun and Bezada (Citation2013) provided a very similar value of 0.15 km2 on the basis of GPS mapping. There is then a small discrepancy between our estimate of 0.11 km2 for 2015, because Braun and Bezada (Citation2013) indicate an area below this value of 0.10 km2 for 2011. This discrepancy could be in part due to the small patch to the northeast of Humboldt Peak, which was probably not included in Braun and Bezada’s estimate. A study purely based on the analysis of remote images by Rekowsky (Citation2016) using segmented Normalized Difference Soil Index (NDSI) on a Landsat OLI image estimated a larger area of 0.14 km2 for Humboldt Peak glacier in 2015.
Estimated glacier retreat rates and possible drivers of change
The average rate of glacier retreat in the Humboldt glacier (the only one for which we can track changes for the entire study period) has been accelerating continuously from 1910 to the present (). These rates accelerate from 1998 to 2009, exceeding an average area loss of 7 percent year−1. The remnant is rapidly approaching the lower limit of 0.01 km2 in area, below which it would no longer be considered a glacier (Paul et al. Citation2009). For the period between 1910 and 1952, we calculated an average rate of retreat in the percentage surface area of Humboldt of 1.7 percent year−1. This rate is slightly higher compared to the estimated rate of retreat of Colombian glaciers between the 1940s and 1970s of 1 percent year (IDEAM Citation2012; Rabatel, Ceballos et al. Citation2017; Rabatel, Francou et al. Citation2017), and the overall average rate of loss in surface area documented for the tropical Andes before 1960s is 0.5 percent (Rabatel et al. Citation2013).
After 1952, Schubert (1992, Citation1998) proposed a complete stasis in glacier area up to 1976 (based on visual comparisons of the aerial photos with LANDSANT 2 MSS images), coinciding with a temporary halt in the retreat of many tropical Andean glaciers between the 1960s and 1970s (Vuille et al. Citation2008, Citation2018; Rabatel et al. Citation2013; Rabatel, Francou et al. Citation2017; Veettil and Kamp Citation2017). For the entire period between 1952 and 1998, we estimated an overall average rate of retreat of 3.05 percent year−1. However, comparing our 1952 estimate for Humboldt Peak area and Morris, Poole, and Klein (Citation2006) for 1985 suggests a lower average rate of retreat to 2.70 percent year−1 during this period, and the comparison of areas for the period between 1985 and our next year with data in 1998 suggests a higher rate of loss (4.04 percent year−1). After that, the changes based on our estimates indicate an unprecedented acceleration in the average loss of area from 7.47 percent year−1 for 1998 to 2009 to a record of 16.86 percent year−1 between 2016 and 2019. These rates are higher than the rates reported for the last thirty years in other glaciers in the tropical Andes, which are typically below 5 percent year−1 (Rabatel et al. Citation2013; Rabatel, Francou et al. Citation2017).
The Humboldt Peak glacier terminus has now retreated to an area with a lower slope inclination (15°, a protected saddle just below the northwest side of the peak), which likely fosters snow accumulation and lower incident radiation on the glacier surface (Mahaney et al. Citation2000; Braun and Bezada Citation2013). This topographic configuration could be linked to the recent, although modest, slowdown of the rate of change in elevation of the glacier terminus from −9.1 m year−1 from 1998 to 2009 to −6.6 m year−1 for 2016 to 2019. However, the average rate of retreat in terms of the horizontal distance (−23 m year−1) and in terms area change (−16.86 percent year−1) between 2016 and 2019 was still the fastest we recorded. These recent horizontal rates of retreat are on the same order of magnitude as those reported for other low-elevation tropical alpine glaciers such as those at Mount Kenya (Mizuno and Fujita Citation2014).
What could be the possible climatic drivers of these observed rapid rates of glacier retreat? The available evidence for the tropical Andes suggests that increased temperatures and changes in precipitation (particularly an increase in frequency of El Niño events after the 1970s) are two important general controlling factors. Differences in incident radiation controlled by aspect could play an additional modulating role (Mark Citation2008; Rabatel et al. Citation2013; Rabatel, Francou et al. Citation2017; Vuille et al. Citation2018). In the case of the Venezuelan Andes, evidence compiled by Braun and Bezada (Citation2013) from long-term records from the Mérida airport show a general trend of increased temperatures and reduced precipitation between 1961 and 2011, which, together with the low maximum elevation of Venezuelan glaciers, can help to explain the fast rates of glacier recession observed. In fact, the rapid retreat of the glaciers in the Sierra Nevada de Mérida and the Humboldt glacier in the last few decades coincides with the faster retreat and more consistently negative mass balances observed for glaciers at elevations below 5,400 m across the tropical Andes (Rabatel et al. Citation2013; Veettil and Kamp Citation2017). In Colombia, a constant increase in the rate of shrinkage at the country scale over the past four decades has been attributed to the strong imbalance of glaciers with current climate, resulting in predominantly negative mass balances in the two glaciers monitored since 2006 (Santa Isabel, Ritacuba Blanco). Moreover, a faster loss of surface area has been reported in Colombia for the lower elevation peaks (e.g., Tolima, Santa Isabel) compared to the higher peaks in the Sierra Nevada de Santa Marta (IDEAM 2012, 2019; Rabatel, Ceballos et al. Citation2017; Rabatel, Francou et al. Citation2017).
Regarding the role of temperature as an important driver of glacier recession, ablation in tropical Andean glaciers occurs year-round, making glacier extent more sensitive to warming (Francou et al. Citation1995). Vuille et al. (Citation2018), also indicates that there is good correlation between freezing level height (FLH) and equilibrium line elevation for the tropical Andes. Moreover, research indicates that an increase in the equilibrium line elevation as a result of a rise in the FLH should affect the inner tropics more (including those in Colombia and Venezuela), where the mass balance of glaciers is more sensitive (Veettil et al. Citation2017, 2018). In particular, the low maximum elevation of the Venezuelan glaciers in the Sierra Nevada de Mérida, below 4,970 m in all cases (see ), has probably resulted in a very fast reduction and disappearance of their accumulation zone in the last decades. In fact, Braun and Bezada (Citation2013) indicate that the average FLH from 1948 to 2011 was located at 4,864 m, which is very close to the highest elevation of Humboldt Peak glacier after 1952 (4,890 m). Therefore, Humboldt Peak glacier appears to have been lacking a significant accumulation zone for a long time (this is also the case for Bolivar Peak glaciers). Moreover, the FLH moved upwards at a rate of 1.65 m per year during this period and experienced a fast increase from the mid-1970s. In fact, the mean FLH for the twenty-first century was 4,911 m and reached 5,000 m in 2010 (Braun and Bezada Citation2013). Hence, the glacier at Humboldt Peak is bound to disappear in the next few years. However, though ice at Bolivar Peak (4,978 m, the highest in Venezuela) completely disappeared while writing this article in 2020, the protected topographic position of the last remaining glacier at Humboldt Peak probably explains its continued, albeit fragile, existence.
With respect to precipitation as a second important driver of change, our back-to-back measurements for Humboldt glacier in 2015 and 2016 indicated particularly fast rates of retreat during that year, characterized by a 28.09 percent in area loss and a vertical retreat of 40 m in elevation. This rapid retreat could have been associated with a severe El Niño event during 2015–2016, which resulted in much lower precipitation than average in the Venezuelan high Andes (IDEAM 2019; Rodríguez-Morales et al. Citation2019). The low recorded amounts of precipitation likely coincided with lower overall cloud cover, reduced snowfall (and reduced albedo on the glacier surface), and higher temperatures (Vuille et al. Citation2018).
Finally, regarding the possible role of changes in incident radiation modulated by aspect, a notable pattern reported for the Sierra Nevada and corroborated here is the earlier and faster disappearance of the glaciers on the southeast facing slopes during the twentieth century (facing the Orinoco Llanos), compared to the northwest slopes, facing the inter-Andean valley of the city of Mérida. This difference was already noted by Jahn (Citation1925), and Schubert (1992) called attention to the faster disappearance of the glaciers in the southeast face of the Sierra since 1972 (e.g., Timoncito in Bolivar Peak, Coromoto or Mucuy Glacier in La Concha Peak, and the Nuestra Señora Glacier in Bonpland Peak). The difference in glacier dynamics in the two main orientations of the Sierra Nevada de Mérida has been attributed to (a) the position of the sun during winter in the Northern Hemisphere, which results in higher incident radiation on south facing slopes, coinciding with the dry season months in which there is lower cloud cover (December to January); (b) the fact that morning cloud cover tends lower than afternoon cloud cover in the high Venezuelan Andes. Thus, east-facing slopes tend to receive more direct radiation during the day; and c) the local influence of a semi-arid enclave (Nuestra Señora river valley) toward the southeast facing slopes of the Sierra Nevada, which could result in reduced cloud cover, increased incident radiation, and reduced precipitation/snow inputs on the high slopes on this side (Jahn Citation1925; Schubert 1992; Mahaney et al. Citation2000; Braun and Bezada Citation2013).
Interestingly, opposite but consistent patterns have been observed in glaciated peaks in the tropical Andes in the Southern Hemisphere, which have been characterized by lower elevations of the glacier terminus and slower rates of retreat on the south-facing slopes compared to north-facing slopes (Mark Citation2008; Veettil and Kamp Citation2017). These aspect-related differences in glacier retreat rates have also been found to influence rates of vegetation colonization and primary succession (Young et al. Citation2017).
Implications and opportunities for further research
As indicated above, there is no longer any ice visible from the city of Mérida, because the last remnant firn patch in Bolivar Peak finally melted during the dry season of 2020. The remaining 0.0454 km2 of ice at Humboldt Peak is not visible from Mérida, limiting its role as a signpost for climate change.
It is difficult to predict how much longer it will be before the final disappearance of Humboldt Peak glacier, especially because previous predictions for the remaining low-elevation glaciers in Colombia and Venezuela have proven too drastic (e.g., Poveda and Pineda Citation2009) and given the lack of detailed climatic data and glaciological measurements in Venezuela (i.e., lack of data on mass balance, ice thickness, snowfall, etc.). However, we can be certain that Venezuela will be the first Andean country to lose all of its glaciers in the next few years, and likely among the first in the world, in a close race with Indonesia’s Puncak Jaya Peak glaciers Mount Kenya and Stanley Peak in the Rwenzori mountains (Permana et al. Citation2019; Veettil and Kamp Citation2019). Thus, studying the trajectory of Venezuelan glacier retreat constitutes a unique opportunity to promote interest in and further research on the consequences of climate change in the tropical Andes, thereby strengthening conservation and climate change adaptation initiatives.
It is too late to attend Schubert’s (1992) call for a detailed monitoring programme of glacier retreat in the Venezuelan Andes. However, climate change will continue to affect the Venezuelan high Andes, with fast warming and reduced precipitation projected for the twenty-first century (Buytaert et al. Citation2010; Schoolmeester et al. Citation2016). These changes will continue to have important consequences for biodiversity, ecosystem services, and land use, particularly given the limited extension of páramo ecosystems in Venezuela (2,405 km2; Llambí and Cuesta 2014). This is further complicated by conditions that result in a high vulnerability, such as the limited water retention capacity of most páramo soils in Venezuela compared to other more humid volcanic regions in Colombia or Ecuador (Rodríguez-Morales et al. Citation2019) or their unusually high proportion of endemics plant species with narrow thermal niche traits (Cuesta et al. Citation2020). Hence, it is essential to strengthen long-term monitoring efforts to understand the impacts of climate change in the Venezuelan high Andes (Llambí and Rada Citation2019). An important step in this direction has been the establishment, since 2012, of a system of permanent plots to study changes in vegetation and temperatures in seven summits between 3,800 and 4,600 m in the Venezuelan páramos. These summits are part of the GLORIA global monitoring network and its South American chapter GLORIA-Andes (see Cuesta et al. Citation2017, Citation2020). Moreover, given the small spatial extent of glaciers in the Venezuela, the conservation and restoration of páramo vegetation and soils assumes a critical importance in terms of the maintenance of key ecosystem services such as hydrological regulation and water supply.
Climate change and glacier loss could also have a major impact on tourism and cultural identity in the Venezuelan Andes. Previous studies in the tropical Andes, particularly in Ecuador and Peru, have documented the deep emotional impact of glacier loss to local inhabitants, including the renaming of culturally important sites and changes in religious ceremonies involving glaciers (e.g., Young and Lipton Citation2006; Rhoades et al. Citation2008; Brugger et al. Citation2013; Allison Citation2015). As for the impacts on tourism, the profound economic and social crisis of the last few years in Venezuela has sharply decreased the flow of national and international visitors, which was an important part of the economy of the Andes of Merida. Consequently, the glacier’s shrinkage (and in the case of Bolivar Peak, its final disappearance) has not been as prominent an issue as could have been expected. In other countries in the region, glacier retreat has been shown to have very significant impacts for the outdoors recreation industry because glaciers constitute a key attraction for mountaineers (Vuille et al. Citation2018). Innovative responses have been developed in some areas, such as the Huascaran National Park in Peru or the Chacaltaya glacier near La Paz (which used to be the highest ski slope in the world but is now disappeared), shifting the emphasis to promoting awareness among visitors about the consequences of climate change (Gagné, Rasmussen, and Orlove Citation2014; Kaenzig, Rebetez, and Serquet Citation2016).
However, there has been limited research on these cultural and touristic impacts of glacier retreat in the case of Mérida, a city whose cultural identity is intimately linked with its Sierra Nevada. For recreational climbers, the impacts have been drastic, because the only remaining glacier is in a very remote area, and a new environmental regulation prohibits climbing on it (INPARQUES 2018). Similar strict regulations are now in place in Colombia. Although these regulations will probably have a very limited impact on the glacier itself, they could be important for reducing risks for mountaineers, given the increased instability and development of new deep crevasses on the ice. For many tourists, the only opportunity to see ice in Venezuela will now be from the highest station of the cable car system (Pico Espejo, 4,765 m), from which the glacier at Humboldt Peak is still visible. This in itself constitutes a valuable opportunity to utilize the cable car stations and other public spaces in the city for educational exhibits on climate change and its impacts in the Venezuelan Andes.
In the Sierra Nevada de Mérida, the snows are frequent in the high summits during the wet season (May–November), and the peaks are frequently clouded. The glaciers are then usually difficult to distinguish from seasonal snow, to the point that many of the inhabitants of the city believe that the glaciers will “recover” in the next snow season. The 2020 dry season has seen for the first time the complete disappearance of the glacier ice in the zones visible from the city and its surroundings, but Merideños are still not feeling the full impact of this huge loss. For many, it is just unthinkable that in the “City of Eternal Snows,” eternity has just ended.
Supplemental Material
Download Zip (28.9 KB)Acknowledgments
We thank two anonymous referees for their detailed comments and suggestions, which greatly improved the article. The Mérida Cable Car System (Mucumbarí) and the Instituto Nacional de Parques provided key assistance for access to the study area in the Humboldt Peak. Thanks also to URO and UGAM mountaineering organizations for their invaluable assistance and logistic support during field expeditions. We are especially grateful to José Betancourt for sharing with us his private collection of photographs and information from his unique experience of fifty years of exploration of the Sierra Nevada and to José M. Romero for recent photos of Humboldt and Bolivar Peaks. Finally, thanks to the incredible spirit of the Last Venezuelan Glacier team and colleagues at ICAE, Universidad de Los Andes, for their perseverance during challenging times for scientific research in Venezuela.
Disclosure statement
No potential conflict of interest was reported by the authors.
Supplementary material
Supplemental data for this article can be accessed on the publisher’s website.
Funding
We thank the National Geographic Society for their financial support (Grant No. NGS-55170R-19).
References
- Albert, T., A. Klein, J. L. Kincaid, C. Huggel, A. E. Racoviteanu, Y. Arnaud, W. Silverio, and J. L. Ceballos. 2014. Remote sensing of rapidly diminishing tropical glaciers in the Northern Andes. In Global land ice measurements from space, ed. G. J. Kargel, M. P. Leonard, A. K. Bishop, and B. H. Raup, 603–09. Berlin: Springer.
- Allison, E. A. 2015. The spiritual significance of glaciers in an age of climate change. Wiley Interdisciplinary Reviews: Climate Change 6 (5):493–508.
- Andressen, R. 2007. Circulación atmosférica y tipos de climas. In GeoVenezuela 2. Medio Físico y Recursos Naturales, ed. P. Cunill Grau, 238–329. Caracas: Fundación Polar.
- Anthelme, F., D. Jacobsen, P. Macek, R. I. Meneses, P. Moret, S. Beck, and O. Dangles. 2014. Biodiversity patternes and continental insularity in the tropical High Andes. Arctic, Antartic and Alpine Research 46 (4):811–28. doi:https://doi.org/10.1657/1938-4246-46.4.811.
- Balcazar, W., J. Rondón, M. Rengifo, M. M. Ball, A. Melfo, W. Gómez, and L. A. Yarzábal. 2015. Bioprospecting glacial ice for plant growth promoting bacteria. Microbiological Research 177:1–7. PMID:26211959. doi:https://doi.org/10.1016/j.micres.2015.05.001.
- Ball, M. M., W. Gómez, X. Magallanes, R. Rosales, A. Melfo, and L. A. Yarzábal. 2014. Bacteria recovered from a high-altitude, tropical glacier in Venezuelan Andes. World Journal of Microbiology and Biotechnology 30 (3):931–41. doi:https://doi.org/10.1007/s11274-013-1511-1.
- Barry, R. G. 2006. The status of research on glaciers and global glacier recession: A review. Progress in Physical Geography 30 (3):285–306. doi:https://doi.org/10.1191/0309133306pp478ra.
- Blumenthal, M. 1923. In der Längrichtung durch die venezolanische Anden. Jahrbuch des Schweizer Alpenklub 57:213–40.
- Braun, C., and M. Bezada. 2013. The history and disappearance of glaciers in Venezuela. Journal of Latin American Geography 12 (2):85–124. doi:https://doi.org/10.1353/lag.2013.0016.
- Brecher, H. H., and L. G. Thompson. 1993. Measurement of the retreat of Qori Kalis glacier in the tropical Andes of Peru by terrestrial photogrammetry. Photogrammetric Engineering and Remote Sensing 59:1017–22.
- Brugger, J., K. W. Dunbar, C. Jurt, and B. Orlove. 2013. Climates of anxiety: Comparing experience of glacier retreat across three mountain regions. Emotion, Space and Society 6:4–13. doi:https://doi.org/10.1016/j.emospa.2012.05.001.
- Buytaert, W., and B. De Bièvre. 2012. Water for cities: The impact of climate change and demographic growth in the Tropical Andes. Water Resources Research 48 (8):W08503. doi:https://doi.org/10.1029/2011WR011755.
- Buytaert, W., M. Vuille, A. Dewulf, R. Urrutia, A. Karmalkar, and R. Célleri. 2010. Uncertainties in climate change projections and regional downscaling in the tropical Andes: Implications for water resources management. Hydrology and Earth System Sciences 14 (7):1247–58. doi:https://doi.org/10.5194/hess-14-1247-2010.
- Campbell, J. B., and L. M. Resler. 2015. Geomorphological studies from remote sensing. In Remote sensing of water resources, disasters, and urban studies, ed. P. Thenkabail, vol. 2, 313. London: Taylor and Francis.
- Ceballos, J. L., C. Euscategui, J. Ramirez, M. Canon, C. Huggel, W. Haeberli, and H. Machguth. 2006. Fast shrinkage of tropical glaciers in Colombia. Annals of Glaciolology 43:194–201. doi:https://doi.org/10.3189/172756406781812429.
- Chevallier, P., B. Pouyaud, W. Suarez, and T. Condom. 2010. Climate change threats to environment in the tropical Andes: Glaciers and water resources. Regional Environmental Change 11 (1):179–87. doi:https://doi.org/10.1007/s10113-010-0177-6.
- Cuesta, F., C. Tovar, L. D. Llambí, W. D. Gosling, S. Halloy, J. Carilla, P. Muriel, R. I. Meneses, S. Beck, C. Ulloa Ulloa, et al. 2020. Thermal niche traits of high alpine plant species and communities across the tropical Andes and their vulnerability to global warming. Journal of Biogeography 47 (2):408–20. doi:https://doi.org/10.1111/jbi.13759.
- Cuesta, F., L. D. Llambí, C. Huggel, F. Drenkhan, W. D. Gosling, P. Muriel, R. Jaramillo, and C. Tovar. 2019. New land in the Neotropics: A review of biotic community, ecosystem and landscape transformations in the face of climate and glacier change. Regional Environmental Change 1–20. doi:https://doi.org/10.1007/s10113-019-01499-3.
- Cuesta, F., P. Muriel, L. D. Llambí, S. Halloy, N. Aguirre, S. Beck, J. Carilla, R. I. Meneses, S. Cuello, A. Grau, et al. 2017. Latitudinal and altitudinal patterns of plant community diversity on mountain summits across the tropical Andes. Ecography 40 (12):1381–94. doi:https://doi.org/10.1111/ecog.02567.
- Dangles, O., A. Rabatel, M. Kraemer, G. Zeballos, A. Soruco, D. Jacobsen, and F. Anthelme. 2017. Ecosystem sentinels for climate change? Evidence of wetland cover changes over the last 30 years in the tropical Andes. PLoS One 12 (5):e0175814. doi:https://doi.org/10.1371/journal.pone.0175814.
- Febres-Cordero, T. 1930. Clave Histórica de Mérida. Mérida: Editorial El Lapiz.
- Francou, B., Ribstein, P., Saravia, R., and Tiriau, E. 1995. Monthly balance and water discharge of an inter-tropical glacier: Zongo Glacier, Cordillera Real, Bolivia. Journal of Glaciology 41: 61–67.
- Gagné, K., M. B. Rasmussen, and B. Orlove. 2014. Glaciers and society: Attributions, perceptions, and valuations. WIREs Climate Change 5:793–808. doi:https://doi.org/10.1002/wcc.315.
- Gardent, M., A. Rabatel, J.-P. Dedieu, and P. Deline. 2014. Multitemporal glacier inventory of the French Alps from the late 1960s to the late 2000s. Global and Planetary Change 120:24–37. doi:https://doi.org/10.1016/j.gloplacha.2014.05.004.
- Gunther, A. E. 1940. A visit to the Andes of Venezuela. Alpine Journal 52 (260):70–89.
- Huss, M., B. Bookhagen, C. Huggel, D. Jacobsen, R. Bradley, J. Clague, M. Vuille, W. Buytaert, D. Cayan, G. Greenwood, et al. 2017. Towards mountains without permanent snow and ice. Earth’s Future 5. doi:https://doi.org/10.1002/2016EF000514.
- IDEAM [Instituto de Hidrología, Meteorología y Estudios Ambientales]. 2012. Glaciares de Colombia, más que montañas con hielo. Bogotá, DC. 344. http://documentacion.ideam.gov.co/openbiblio/bvirtual/022428/Glaciares_web.pdf.
- IDEAM [Instituto de Hidrología, Meteorología y Estudios Ambientales]. 2017. Informe del Estado de los Glaciares Colombianos. Bogotá: IDEAM.
- IDEAM [Instituto de Hidrología, Meteorología y Estudios Ambientales]. 2019. Informe del Estado de los Glaciares Colombianos. Bogotá: IDEAM.
- INPARQUES [Instituto Nacional de Parques]. 2018. Providencia para la Protección del Glaciar del Pico Humboldt. Caracas: Presidencia INPARQUES.
- Jahn, A. 1925. Observaciones glaciológicas en los Andes venezolanos. Cultura Venezolana 64:265–80.
- Jomelli, V., V. Favier, A. Rabatel, D. Brunstein, G. Hoffmann, and B. Francou. 2009. Fluctuations of glaciers in the tropical Andes over the last millennium and palaeoclimatic implications: A review. Palaeogeography, Palaeoclimatology, and Palaeoecology 281:269–82. doi:https://doi.org/10.1016/j.palaeo.2008.10.033.
- Jordan, E., L. Ungerechts, B. Caceres, A. Penafiel, and B. Francou. 2005. Estimation by photogrammetry of the glacier recession on the Cotopaxi Volcano (Ecuador) between 1956 and 1997. Hydrological Science Journal 50:949–61.
- Kaenzig, R., M. Rebetez, and G. Serquet. 2016. Climate change adaptation of the tourism sector in the Bolivian Andes. Tourism Geography 18 (2):111–28. doi:https://doi.org/10.1080/14616688.2016.1144642.
- Llambí, L. D., and F. Cuesta. 2014. La diversidad de los páramos andinos en el espacio y en el tiempo. In Avances en Investigación para la Conservación en los Páramos Andinos, ed. F. Cuesta, J. Sevink, L. D. Llambí, B. De Bievre, and J. Posner, 7–40. Quito: CONDESAN.
- Llambí, L. D., and F. Rada. 2019. Ecological research in tropical alpine ecosystems of the Venezuelan páramo: Past, present and future. Plant Ecology and Diversity 12 (6):519–38. doi:https://doi.org/10.1080/17550874.2019.1680762.
- Magrin, G. O., J. A. Marengo, J. P. Boulanger, M. S. Buckeridge, E. Castellanos, G. Poveda, F. R. Scarano, and S. Vicuña. 2014. Central and South America. In Climate change 2014: Impacts, adaptation, and vulnerability. Part B: Regional aspects. Contribution of Working Group II to the fifth assessment report of the intergovernmental panel on climate change, 1499–566. Cambridge, UK and New York, NY: Cambridge University Press.
- Mahaney, W. C., M. W. Milner, K. Sanmugadas, V. Kalm, M. Bezada, and R. G. V. Hancock. 2000. Late Quaternary deglaciation and neoglaciation of the Humboldt Massif, Northern Venezuelan Andes. Zeitschrift fur Geomorphologie, Supplementband 122:209–26.
- Mahaney, W. C., M. W. Milner, V. Kalm, R. W. Dirszowsky, R. G. V. Hancock, and R. P. Beukens. 2008. Evidence for a Younger Dryas glacial advance in the Andes of northwestern Venezuela. Geomorphology 96:199–211. doi:https://doi.org/10.1016/j.geomorph.2007.08.002.
- Mahaney, W. C., V. Kalm, B. Kapran, M. W. Milner, and R. G. V. Hancock. 2009. A soil chronosequence in Late Glacial and Neoglacial moraines, Humboldt Glacier, northwestern Venezuelan Andes. Geomorphology 109:236–45. doi:https://doi.org/10.1016/j.geomorph.2009.03.005.
- Mark, B. G. 2008. Tracing tropical Andean glaciers over space and time: Some lessons and transdisciplinary implications. Global and Planetary Change 60:101–14. doi:https://doi.org/10.1016/j.gloplacha.2006.07.032.
- Mark, B. G., A. French, M. Baraer, M. Carey, J. Bury, K. R. Young, M. H. Polk, O. Wigmore, P. Lagos, and R. Crumley. 2017. Glacier loss and hydrosocial risks in the Peruvian Andes. Global and Planetary Change 159:61–76. doi:https://doi.org/10.1016/j.gloplacha.2017.10.003.
- Marrero, L. 1964. Venezuela y Sus Recursos: Una geografía visualizada. Caracas: Editorial Cultural Venezolana.
- Mizuno, K., and T. Fujita. 2014. Vegetation succession on Mt. Kenya in relation to glacial fluctuation and global warming. Journal of Vegetation Science 25:559–70. doi:https://doi.org/10.1111/jvs.12081.
- Morán-Tejeda, E., J. L. Ceballos, K. Peña, J. Lorenzo-Lacruz, and J. I. López-Moreno. 2018. Recent evolution and associated hydrological dynamics of a vanishing tropical Andean glacier: Glaciar Las Conejeras, Colombia. Hydrology and Earth System Sciences 22:5445–61. doi:https://doi.org/10.5194/hess-22-5445-2018.
- Morris, J., A. Poole, and A. Klein. 2006. Retreat of tropical glaciers in Colombia and Venezuela from 1984 to 2004 as Measured from ASTER and landsat images. Proceedings 63rd Eastern Snow Conference, Newark, Delaware, 181–91.
- Mote, P. W., and G. Kaser. 2007. The shrinking glaciers of Kilimanjaro: Can global warming be blamed? American Scientist 95 (4):318–25. doi:https://doi.org/10.1511/2007.66.318.
- Ommanney, C. S. L., J. Ferrigno, and R. S. Williams. 2002. Satellite image atlas of glaciers of the world. Geological Survey Professional Paper, 199.
- Paul, F., R. G. Barry, J. G. Cogley, H. Frey, W. Haeberli, A. Ohmura, C. S. L. Ommanney, B. Raup, A. Rivera, and M. Zemp. 2009. Recommendations for the compilation of glacier inventory data from digital sources. Annals of Glaciology 50 (53):119–26. doi:https://doi.org/10.3189/172756410790595778.
- Permana, D. S., L. G. Thomson, E. Mosley-Thompson, M. E. Davis, P. N. Ling, J. P. Nicolas, J. F. Bolzan, B. W. Bird, V. N. Mikhalenko, et al. 2019. Disappearance of the last tropical glaciers in the Western Pacific Warm Pool (Papua, Indonesia) appears imminent. Proceedings of the Natural Academy of Science. doi:https://doi.org/10.1073/pnas.1822037116/-/DCSupplemental.
- Polissar, P. J., M. B. Abott, A. P. Wolfe, M. Bezada, V. Rull, and R. S. Bradley. 2006. Solar modulation of Little Ice Age climate in the tropical Andes. Proceedings of the Natural Academy of Science 103 (24):8937–42. doi:https://doi.org/10.1073/pnas.0603118103.
- Polk, M. H., K. R. Young, M. Baraer, B. G. Mark, J. M. McKenzie, J. Bury, and M. Carey. 2017. Exploring hydrologic connections between tropical mountain wetlands and glacier recession in Peru’s Cordillera Blanca. Applied Geography 78:94–103. doi:https://doi.org/10.1016/j.apgeog.2016.11.004.
- Poveda, G., and K. Pineda. 2009. Reassessment of Colombia’s tropical glaciers retreat rates: Are they bound to disappear during the 2010–2020 decade? Advances in Geoscience 22:107–16. doi:https://doi.org/10.5194/adgeo-22-107-2009.
- Rabatel, A., B. Francou, A. Soruco, J. Gomez, B. Caceres, J. L. Ceballos, R. Basantes, M. Vuille, J.-E. Sicart, C. Huggel, et al. 2013. Current state of glaciers in the tropical Andes: A multi-century perspective on glacier evolution and climate change. The Cryosphere 7:81–102. doi:https://doi.org/10.5194/tc-7-81-2013.
- Rabatel, A., B. Francou, A. Soruco, J. Gomez, J. L. Ceballos, R. Basantes, M. Vuille, J. E. Sicart, and C. Huggel. 2017. Current state of glaciers in the tropical Andes: A multi-century perspective on glacier evolution and climate change. The Cryosphere 7:81–102. doi:https://doi.org/10.5194/tc-7-81-2013.
- Rabatel, A., J. L. Ceballos, N. Micheletti, E. Jordan, M. Braitmeier, J. González, N. Mölg, M. Ménégoz, C. Huggel, and M. Zempe. 2017. Toward an imminent extinction of Colombian glaciers? Geografiska Annaler: Series A, Physical Geography. doi:https://doi.org/10.1080/04353676.2017.1383015.
- Rekowsky, I. C. 2016. Variações De Área Das Geleiras Da Colômbia E Da Venezuela Entre 1985 E 2015, Com Dados De Sensoriamento Remoto. Master thesis, Federal University of Rio Grande do Sul, Porto Alegre.
- Rhoades, R., X. Zapata Rios, and J. Aragundy Ochoa. 2008. Mama Cotacachi: History, local perceptions, and social impacts of climate change and glacier retreat in the Ecuadorian Andes. In Darkening peaks. Glacier retreat, science, and society, ed. B. Orlove, E. Wiegandt, and B. Luckman, 216–25. Berkeley: University of California Press.
- Rodríguez-Morales, M., D. Acevedo, D. Machado, M. Ablan, W. Dugarte, and F. Dávila. 2019. Ecohydrology of the Venezuelan Páramo: Water balance of a high Andean watershed. Plant Ecology and Diversity 12 (6):573–91. doi:https://doi.org/10.1080/17550874.2019.1673494.
- Rondón, J., W. Gómez, M. M. Ball, A. Melfo, M. Rengifo, W. Balcázar, D. Dávila-Vera, A. Balza-Quintero, R. V. Mendoza-Briceño, and L. A. Yarzábal. 2016. Diversity of culturable bacteria recovered from Pico Bolívar’s glacial and subglacial environments, at 4950 m, in Venezuelan tropical Andes. Canadian Journal of Microbiology 62:1–14. doi:https://doi.org/10.1139/cjm-2016-0172.
- Rull, V. 1996. Late Pleistocene and Holocene climates of Venezuela. Quaternary International 31:85–94. doi:https://doi.org/10.1016/1040-6182(95)00024-D.
- Rull, V., M. L. Salgado-Labouriau, C. Schubert, and S. Valastro Jr. 1987. Late Holocene temperature depression in the Venezuelan Andes: Palynological evidence. Palaeogeography, Palaeoclimatology, and Palaeoecology 60:109–21. doi:https://doi.org/10.1016/0031-0182(87)90027-7.
- Rull, V. and Schubert, C. 1989. The Little Ice Age in the Tropical Venezuelan Andes. Acta Científica Venezolana 40:71–73.
- Salgado-Labouriau, M. L. 1989. Late Quaternary climatic oscillations in the Venezuelan Andes. Biology International 18:12–14.
- Sarmiento, G. 1986. Ecologically crucial features of climate in high tropical mountains. In High altitude tropical biogeography, ed. F. Vuilleumier and M. Monasterio, 11–45. Oxford: Oxford University Press.
- Schauwecker, S., M. Rohrer, C. Huggel, J. Endries, N. Montoya, R. Neukom, B. Perry, N. Salzmann, M. Schwarb, and W. Suarez. 2017. The freezing level in the tropical Andes, Peru: An indicator for present and future glacier extents. Journql of Geophysical Research-Atmospheres 122:5172–89. doi:https://doi.org/10.1002/2016JD025943.
- Schoolmeester, T., M. Saravia, M. Andresen, J. Postigo, A. Valverde, M. Jurek, B. Alfthan, and S. Giada. 2016. Outlook on climate change adaptation in the tropical Andes mountains. Mountain adaptation outlook series. Programa de Naciones Unidas para el Medio Ambiente, GRIDArendal y CONDESAN. Nairobi, Arendal, Vienna, Lima.
- Schubert, C. 1970. Glaciation of the Sierra de Santo Domingo,Venezuelan Andes. Quaternaria 13:225–46.
- Schubert, C. 1974. Late Pleistocene Mérida glaciation, Venezuelan Andes. Boreas 3:147–52. doi:https://doi.org/10.1111/j.1502-3885.1974.tb00673.x.
- Schubert, C. 1992. The Glaciers of the Sierra Nevada De Merida (Venezuela): A Photographic Comparison of Recent Deglaciation. Erdkunde 46 (1):58–64.
- Schubert, C. 1998. Glaciers of Venezuela. In Satellite image atlas of glaciers of the world – South America. USGS professional paper 1386-I, ed. R. S. Williams Jr. and J. G. Ferrigno, 1–10. Washington, DC: United States Government Printing Office.
- Schubert, C., and C. M. Clapperton. 1990. Quaternary Glaciations in the northern Andes (Venezuela, Colombia and Ecuador). Quaternary Science Reviews 9:123–35. doi:https://doi.org/10.1016/0277-3791(90)90014-2.
- Schubert, C., and L. Vivas. 1993. El Cuaternario de la Cordillera de Mérida, Andes Venezolanos. Mérida: Talleres Gráficos Universitarios.
- Soruco, A., C. Vincent, B. Francou, and J. F. Gonzalez. 2009. Glacier retreat between 1963 and 2006 in the Cordillera Real, Bolivia. Geophysical Reseaarch Letters 36:L03502. doi:https://doi.org/10.1029/2008GL036238.
- Stansell, N., M. B. Abbott, P. J. Polissar, A. Wolfe, M. Bezada, and V. Rull. 2005. Late Quaternary deglacial history of the Mérida Andes, Venezuela. Journal of Quaternary Science 20 (7–8):801–12. doi:https://doi.org/10.1002/jqs.973.
- Veettil, B. K., S. Wang, S. F. Souza, U. F. Bremer, and J. C. Simoes. 2017. Glacier monitoring and glacier-climate interactions in the tropical Andes: A review. Journal of South American Earth Sciences 77:218e246. doi:https://doi.org/10.1016/j.jsames.2017.04.009.
- Veettil, B. K., and U. Kamp. 2017. Remote sensing of glaciers in the tropical Andes: A review. International Journal of Remote Sensing 38 (23):7101–37. doi:https://doi.org/10.1080/01431161.2017.1371868.
- Veettil, B. K., and U. Kamp. 2019. Global disappearance of tropical mountain glaciers: Observations, causes, and challenges. Geosciences 9:196. doi:https://doi.org/10.3390/geosciences9050196.
- Vuille, M., B. Francou, P. Wagnon, I. Juen, G. Kaser, B. G. Mark, and R. S. Bradley. 2008. Climate change and tropical Andean glaciers: Past, present and future. Earth Science Review 89:79–96. doi:https://doi.org/10.1016/j.earscirev.2008.04.002.
- Vuille, M., M. Carey, C. Huggel, W. Buytaert, A. Rabatel, D. Jacobsen, A. Soruco, M. Villacis, C. Yarleque, O. Elison Timm, et al. 2018. Rapid decline of snow and ice in the tropical Andes—impacts, uncertainties and challenges ahead. Earth Science Review 176:195–213. doi:https://doi.org/10.1016/j.earscirev.2017.09.019.
- Williams, J. H., and S. T. Jackson. 2007. Novel climates, no-analog communities, and ecological surprises. Frontiers in Ecology and the Environment 5:475–82. doi:https://doi.org/10.1890/070037.
- Young, K. R., A. G. Ponette-González, M. H. Polk, and J. K. Lipton. 2017. Snowlines and Treelines in the Tropical Andes. Annals of the American Association of Geographers 107 (2):429–40. doi:https://doi.org/10.1080/24694452.2016.1235479.
- Young, K. R., and J. K. Lipton. 2006. Adaptive governance and climate change in the tropical highlands of western South America. Climatic Change 78:63–102. doi:https://doi.org/10.1007/s10584-006-9091-9.
- Zemp, M., H. Frey, I. Gärtner-Roer, S. U. Nussbaumer, M. Hoelzle, F. Paul, W. Haeberli, F. Denzinger, A. P. Ahlstrøm, B. Anderson, et al. 2015. Historically unprecedented global glacier decline in the early 21st century. Journal of Glaciology 61:745–62. doi:https://doi.org/10.3189/2015JoG15J017.
- Zimmer, A., R. I. Meneses, A. Rabatel, A. Soruco, O. Dangles, and F. Anthelme. 2018. Time lag between glacial retreat and upward migration alters tropical alpine communities. Perspectives in Plant Ecology, Evolution and Systematics 30:89–102. doi:https://doi.org/10.1016/j.ppees.2017.05.003.