
 ?Mathematical formulae have been encoded as MathML and are displayed in this HTML version using MathJax in order to improve their display. Uncheck the box to turn MathJax off. This feature requires Javascript. Click on a formula to zoom.
ABSTRACT
Rising temperatures in the Arctic can result in thaw of permafrost, with widespread implications for ecosystems and infrastructure. We analyzed mean annual air and ground temperatures in the eight northernmost national parks in Alaska using data from thirty-three National Park Service climate monitoring stations and eight National Weather Service stations. Mean annual air temperatures (MAATs) from 2014 to 2019 increased in a stepwise fashion relative to the preceding thirty-year period by at least 1°C at all locations in the study area; the increase was near 2°C in Denali National Park and most of the Arctic Alaska parks and 3°C in the far western coastal areas of the Arctic parks. The increase in mean annual ground temperatures (MAGT) was approximately equal to the increase in MAAT in windswept tundra areas with minimal snow, whereas under deeper taiga and alpine snowpacks the increase in MAGT was about half as large as the increase in MAAT. If the warm temperatures observed during 2014 to 2019 persist, there will be widespread degradation of permafrost in portions of these national parks and in similar environments across Alaska.
Introduction
High latitudes and mountain environments are currently undergoing rapid change (Box et al. Citation2019; Richter-Menge, Druckenmiller, and Jeffries Citation2019), with Alaska experiencing unprecedented increases in temperatures (Bieniek et al. Citation2014; Lader et al. Citation2017; Walsh et al. Citation2017; Markon et al. Citation2018; Overland, Hanna et al. Citation2019). The largest temperature increases have occurred during the cold season (Bieniek et al. Citation2014) and are attributed to both global climatic warming and regional changes in atmospheric circulation (Walsh and Brettschneider Citation2019). The Arctic and central Alaskan national parks are at the forefront of these changes. Gonzalez et al. (Citation2018) described the disproportionate impacts of climate change on the country’s national parks and found that the highest mean annual temperature increases for the period 1901 to 2009 were in Alaska.
Temperature changes in Alaska have been nonmonotonic, with several warm and cool phases associated with atmospheric and oceanic circulation patterns, most notably the El Nino–Southern Oscillation and the Pacific Decadal Oscillation (Papineau Citation2001; Bieniek et al. Citation2014; Wendler, Moore, and Galloway Citation2014; Markon et al. Citation2018). A marked shift to warmer temperatures occurred in the mid-1970s due to a change in the Pacific Decadal Oscillation (Trenberth and Hurrell Citation1994; Mantua et al. Citation1997; Papineau Citation2001; Hartmann and Wendler Citation2005). Subsequently, much of interior Alaska displayed a generally flat or even slight cooling trend for several decades after 1980 (Hartmann and Wendler Citation2005; Wendler, Chen, and Moore Citation2012). This local cool phase came to an end with a series of record warm years beginning in 2014 (Overland, Dunlea et al. Citation2019). The four warmest years to date in Alaska all occurred in the period 2014 to 2019 (NOAA National Centers for Environmental Information [NCEI] Citation2020). This unprecedented warm spell was linked to anomalously warm sea surface temperatures, low sea ice extent, and a long ice-free season in the surrounding ocean (Walsh et al. Citation2018; Thoman et al. Citation2020). Climate models suggest that conditions as warm as those observed in recent years could become the norm by the 2050s (Walsh et al. Citation2017).
Warming of permafrost and thaw-related landform changes have been widely reported in Alaska in recent decades, with the most dramatic effects in the Arctic region north of the Brooks Range (Jorgenson et al. Citation2001; Osterkamp Citation2005, Citation2007; Jorgenson, Shur, and Pullman Citation2006; Osterkamp et al. Citation2009; Belshe, Schuur, and Grosse Citation2013; Frost et al. Citation2015; Liljedahl et al. Citation2016). Permafrost is widespread in the national parks of central and northern Alaska (Jorgenson et al. Citation2008b; Panda, Marchenko, and Romanovsky Citation2014a, Citation2014b, 2016). Where permafrost is present, it has a strong influence on ecosystems and human infrastructure (Chapin et al. Citation2006; Schuur et al. Citation2015; Harris, Brouchkov, and Guodong Citation2017). Thus, the National Park Service (NPS) monitors permafrost landforms and ground temperatures as a part of its long-term monitoring program (Swanson Citation2017a, Citation2017b; Loso Citation2018). Shallow (1 m depth or less) ground temperatures are measured at the network of climate monitoring stations maintained by the NPS (Sousanes and Hill Citation2017; Sousanes Citation2018). These climate monitoring stations were installed in remote mountainous areas of the national parks, a historically underrepresented area of weather and climate observations for Alaska. The NPS measurements began in 2005 for most stations in the central Alaskan NPS units and 2012 in the Arctic Alaskan NPS units and continue to the present ().
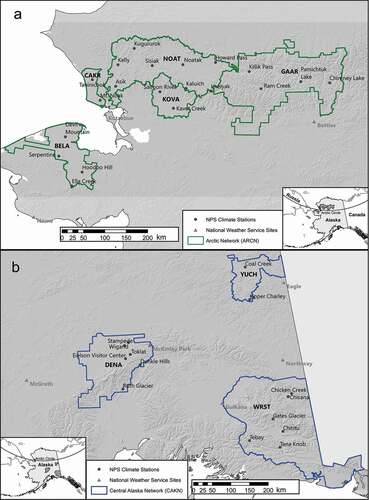
Figure 1. (a) Locations of the climate monitoring stations and park units in the NPS Arctic Inventory and Monitoring Network (ARCN): Bering Land Bridge National Preserve (BELA), Cape Krusenstern National Monument (CAKR), Gates of the Arctic National Park and Preserve (GAAR), Kobuk Valley National Park (KOVA), and the Noatak National Preserve (NOAT). (b) Stations in the NPS Central Alaska Inventory and Monitoring Network (CAKN): Denali National Park and Preserve (DENA), Wrangell–St. Elias National Park and Preserve (WRST), and Yukon–Charley Rivers National Preserve (YUCH).
Temperature measurements in permafrost provide direct evidence for permafrost stability or thaw (Osterkamp Citation2003). However, temperature measurements from deep boreholes in permafrost are much sparser than measurements of atmospheric climate, and they are entirely lacking on NPS-administered lands in Alaska. Fortunately, permafrost temperatures are closely related to mean annual air temperatures (MAAT) and shallow mean annual ground temperatures (MAGT), which are much more easily and widely measured (Brown Citation1973).
The amplitude of ground temperature variations declines with distance below the surface, converging at depth on a value close to the mean annual temperatures of the air and ground above (Brown Citation1973). Thus, the MAATs of the air and the ground near the surface can be used to estimate deep ground temperatures and thus the stability of permafrost. However, the match between permafrost temperatures and mean annual air or shallow ground temperatures is not exact, and the difference between them may be understood as the sum of two “offsets”: the “surface offset” and “thermal offset” (Smith and Riseborough Citation2002). The sum of these two offsets can vary over short distances as a result of soil and site conditions, resulting in local variations in permafrost temperatures and local presence vs. absence of permafrost, even under a generally uniform macroclimate (Brown Citation1973). The mean annual temperature at the ground surface in cold regions is usually warmer than the MAAT (as measured about 2 m above the ground surface), mainly as a result of the insulating effect of snow during the cold seasons (the surface offset). The MAGT at the surface is usually warmer than the MAGT at the top of the permafrost as a result of the different thermal conductivities of the active layer when frozen vs. thawed (the thermal offset). The thermal offset (TO) is greatest in wet materials (i.e., lowland peat or fine-grained mineral soils) and negligible in dry materials (gravelly soils or bedrock; Goodrich Citation1978; Burn and Smith Citation1988). As a result of TO, it is not unusual in wet soils to have an MAGT at the permafrost table about 1°C colder than at the surface (Burn and Smith Citation1988). If a TO is present, the MAGT typically declines from the surface before leveling off at some depth within, or at the bottom of, the active layer (Romanovsky and Osterkamp Citation1995). For this reason, MAGTs in wet soils from within the active layer—for example, at 50 cm depth as in our study—may slightly overestimate the permafrost temperatures below.
The surface offset is often quantified by the use of “n-factors” (Lunardini Citation1978): the freezing n-factor (nf) is the ratio between the annual sum of negative degree days at the ground surface to the annual sum of negative degree days in the air (the latter is also known as the air freezing index, Ifa). The thawing n-factor (nt) is a similar ratio for the annual sum of positive degree days at the surface and in the air (the latter is known as the air thawing index, Ita). The nf for many natural surfaces in cold climates is 0.5 or less due to the effect of snow, whereas the value of nt is often close to one (Lunardini Citation1978; Way and Lewkowicz Citation2016). The mean annual temperature at the top of the permafrost Tp can be modeled from air temperature data, n-factors, and the thermal offset (To) as follows (Romanovsky and Osterkamp Citation1995; Way and Lewkowicz Citation2016; Garibaldi, Bonnaventure, and Lamoureux Citation2020):
It can be shown algebraically that if the air freezing or thawing indices change while the n-factors and thermal offset remain constant, the change in MAAT (ΔTa) and change in mean annual temperatures at the top of the permafrost (ΔTp) are related by the simple relationship
where is the mean of the freezing and thawing n-factors, weighted by the proportion of the change in the sum of air annual degree days that is due to the change in If and It, respectively. Thus, in a deep-snow environment where nf is less than 0.2 (e.g., Way and Lewkowicz Citation2016), we can expect 1°C of warming in MAATs to result in considerably less than 1°C of warming in the MAGT, whereas in a windswept, nearly snow-free environment both nf and nt should be close to one and the rise in MAGTs is expected to track the rise in MAATs in a nearly 1:1 fashion.
Modeling of ground temperatures by Panda, Marchenko, and Romanovsky (Citation2014a, Citation2014b, Citation2016) suggests that substantial areas of Alaska’s national parks have permafrost that is within a few degrees of thawing (, ). Warming of the magnitude predicted by global circulation models in the current century would result in large areas of permafrost becoming thermally unstable and thawing from the surface downward (Panda, Marchenko, and Romanovsky Citation2014a, Citation2014b, Citation2016). These maps of current permafrost temperatures also provide a baseline from which to judge the areas of permafrost thaw that would be expected from any ground warming measured at observing stations within these parks. For example, with a widespread increase in ground temperatures of 0.5°C, the permafrost in Denali National Park (DENA) that has mean annual temperatures of 0.5°C or warmer (red areas in ) would be expected to begin thawing; these areas cover 19 percent of the park ().
Figure 2. Mean annual ground temperatures (MAGT) at the top of the permafrost, from modeling by Panda, Marchenko, and Romanovsky (Citation2014a, Citation2014b, Citation2016). (a) The Arctic parks (see for the park acronyms). (b) Denali National Park and Preserve. (c) Wrangell–St. Elias National Park and Preserve.
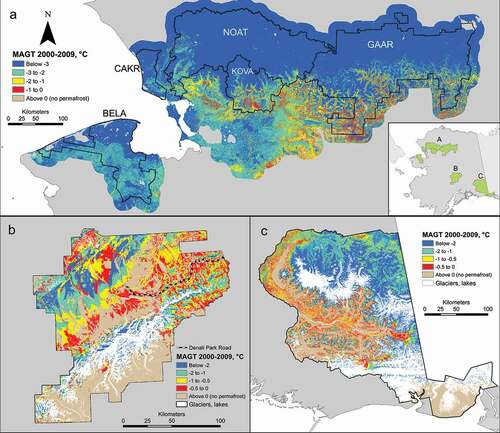
Table 1. Summary of permafrost temperatures in Alaska’s national parks.a
In the present study we investigate the effects of recent warming on air and shallow ground temperatures in the national parks of central and northern Alaska, and we interpret these data in terms of permafrost stability. We summarize the magnitude of recent MAAT increases at NPS climate monitoring stations and at nearby National Weather Service (NWS) stations with long-term records. We summarize MAGT trends at NPS monitoring stations for the available period of record and their relationship to changes in MAAT. Finally, we compare the observed increases in MAGT to maps of modeled permafrost temperature in the study area to locate areas where destabilized permafrost is likely to be present.
Study area
The study area includes eight national parks in northern and central Alaska, where NPS maintains thirty-three long-term climate monitoring stations (, Supplementary Table S1). This vast region includes approximately half of the lands managed by NPS in the United States. The northern five NPS units of the Arctic Inventory and Monitoring Network (ARCN) are in a region of mostly arctic tundra, with boreal forest present in the southern portions of all parks except Bering Land Bridge National Preserve (BELA). Permafrost in ARCN is continuous, except in the southernmost portions of Kobuk Valley National Park (KOVA) and Gates of the Arctic National Park and Preserve (GAAR), where it is discontinuous (Jorgenson et al. Citation2008b). Taliks (permafrost-free areas) in the discontinuous permafrost zone of ARCN are mainly on active river floodplains and coarse-grained slope deposits with south aspects below 500 m elevation (Panda, Marchenko, and Romanovsky Citation2016).
The three national parks in the Central Alaska Inventory and Monitoring Network (CAKN) have boreal forest vegetation at low elevations and alpine tundra above about 800 to 900 m elevation (Roland et al. Citation2019). Permafrost in CAKN is discontinuous (Jorgenson et al. Citation2008b). It is typically present at elevations above about 1,500 m; at lower elevations permafrost is present on slopes with north aspects and in lowlands where fine-grained or peat soils are present and persistent winter temperature inversions result in low mean annual temperatures (Ping et al. Citation2005; S; Panda, Marchenko, and Romanovsky Citation2014a, Citation2014b; PRISM Climate Group Citation2020).
Tundra vegetation in the study area includes a broad range of wet lowland herbaceous communities (Carex, Eriophorum), wet and dry shrublands (Alnus, Betula, Salix, Dryas, ericaceous shrubs), and sparsely vegetated barrens. Boreal forest vegetation consists of mostly open spruce (Picea mariana and P. glauca) and birch (Betula neoalaskana) forests and local forests of aspen (Populus tremuloides) and poplar (Populus balsamifera; Jorgenson et al. Citation2008a; Jorgenson et al. Citation2009). Permafrost occurs under most tundra and open wetland vegetation types (it is absent in some tundra and wetland areas of CAKN), under most P. mariana forests, and locally under the other forest species (Clark and Duffy Citation2006; Jorgenson et al. Citation2008a; Jorgenson et al. Citation2009).
The climate monitoring stations were preferentially placed in mountainous areas of the parks on local topographic high points to complement the existing NWS stations that are typically found in lowlands. Thus, many of the stations have coarse-grained soils, thick active layers, and thin (wind-scoured) snowpacks (Supplementary Table S2). Our data set also contains a variety of sites with other soil and snow conditions, including sites with fine-grained and organic soils and sites with deep snowpacks. We have twenty stations in the Arctic parks, with ground temperature monitoring at nineteen, and permafrost present at all except one (Kavet Creek). At Kavet Creek a deep thawed zone is present after a fire more than fifty years ago, and permafrost conditions at depth are unknown. All of the Arctic stations are in areas of tundra vegetation, except for Kavet Creek with shrubs and regenerating forest; elevations range from 72 to 1,326 m. Most of the Arctic sites (eighteen of twenty) had relatively thin and dense “tundra” snowpacks by the classification system of Sturm, Holmgren, and Liston (Citation1995; Supplementary Table S2). Locations with “tundra” snowpacks where snow depth measurements were noisy or missing due to lack of snow or the median maximum snow depth was less than 0.2 m are labeled as “tundra-scoured” (n = 9) in Supplementary Table S2. The remaining three Arctic stations had “taiga” or “alpine” snowpacks. Taiga snowpacks are lower in density than tundra and are usually deeper (30–120 cm; Sturm, Holmgren, and Liston Citation1995). Alpine snowpacks are deeper still (75–250 cm), with layers of varying density and warmer temperatures at the ground surface.
At the central Alaska sites, permafrost was known or inferred to be present at five stations, absent at six stations, and unknown at the two stations without ground temperature data (Supplementary Table S2). Seven of the thirteen CAKN stations were above elevational treeline. Elevations ranged from 278 to 1,598 m. The CAKN stations had tundra-scoured (n = 1), tundra (n = 4), taiga (n = 3), or alpine (n = 5) snowpacks. Estimated active layers range widely, from about 0.5 m to nearly 4 m (Supplementary Table S2).
Methods
Climate monitoring
Each climate monitoring station consists of a sensor mast, datalogger, satellite transmitter, and power system. Stations have redundant research-grade air temperature sensors including YSI thermistors (accuracy ±0.2°C), FTS humidity and temperature sensors (accuracy ±0.1°C), and Campbell Scientific Inc. (CSI) 109 probes (accuracy ±0.2°C). Sensors are mounted 2.0 m above the ground surface and installed within a naturally aspirated gill radiation shield. The sensors are designed to measure temperatures from −50°C to +50°C. Ground temperature is measured with CSI 107 temperature probes, which have a measurement range of −35°C to 50°C and accuracy of ±0.2°C. Ground probes were installed with a slide hammer in individual holes at 10-, 20-, and 50-cm depths, with additional sensors at 75 cm or 100 cm at selected stations.
Temperatures are sampled every 60 s and then averaged once per hour. Snow depth is sampled once per hour with a CSI SR50 ultrasonic depth sensor from a crossarm mounted 2.0 to 2.5 m above the ground surface. Hourly values for all climate parameters are stored onsite on a CSI CR1000 datalogger and downloaded annually. These data are also available in near real time by telemetry, but the more complete downloaded data record was used for this analysis. All hourly time series are quality controlled by a combination of automated flagging of threshold exceedances and manual data plots. Additional information on data collection and quality control is available in the standard operating procedures for the Arctic and Central Alaska monitoring networks (Sousanes and Hill Citation2017; Sousanes Citation2018. The Hoodoo Hill, Kavet Creek, Kelly, and Noatak stations (Supplementary Table S1) are maintained following similar standards under the National Wildfire Coordinating Group (Citation2019).
Computation of mean annual temperatures and n-factors
Our analysis is based on annual mean temperatures computed for water years, which run from October to September and are named by the later of the two calendar years covered. We chose water years rather than calendar years for several reasons: we had better quality downloaded data (as opposed to data obtained from telemetry) through the summer of 2019 for NPS stations (i.e. most of water year 2019); the climate shift of interest here appears to have occurred in October 2013, coinciding with a new water year; and water years conveniently do not split winters, which tend to show continuity in ground temperatures due to the accumulating seasonal snowpack.
We obtained monthly mean air temperatures for NWS Cooperative Observer Program (COOP) weather stations from the xmACIS data set and summary tools (NOAA Regional Climate Centers Citation2020). We used the default maximum of five days of missing data allowed in a month to compute the mean. In a few cases where individual months of COOP data were missing during our time period of interest, we computed the annual means by replacing the missing month with means from a nearby station. Just 7 months were missing out of 2,520 months of data: Kotzebue months 2019–06, 2019–07, and 2019–08 (replaced with data from the NPS Mt. Noak (MNOA) station, 33 km north–northwest and 255 m higher in elevation); Eagle months 1985–08, 1985–09, and 2006–07 (replaced by Dawson, Yukon Territory data, 115 km east and 20 m higher in elevation), and Northway month 1985–05 (replaced by Tok, Alaska data, 66 m west and 24 m lower in elevation). At NPS stations we calculated daily means for all days with at least 80 percent of hourly values and monthly means for all months with at least 80 percent of daily values.
We computed annual mean ground and air temperatures from monthly means, weighted by the month length. Inspection of the data suggested a stepwise change in the MAAT in 2014. We used the Mann-Kendall trend test (R package “Kendall”; McLoed Citation2011) to determine whether indeed there was no long-term trend in the thirty years prior to 2014. We tested for the significance of the possible stepwise change between annual means before and after 2014 using a Welch’s t-test, which accounts for unequal variances between the samples (R Core Team Citation2017). We also estimated annual sums of thawing degree days and freezing degree days from monthly mean temperatures (Braithwaite Citation1984).
We computed n-factors using the monthly mean air temperatures and ground temperatures at 10 cm depth. The freezing n-factor is the ratio of the annual sum of negative thawing degree days at the surface to the sum in the air; likewise, the thawing n-factor is the ratio of the annual sum of positive thawing degree days at the surface to the corresponding sum in the air.
Computation of change in mean annual temperatures
We also computed multiyear means for the period before and after the observed 2014 temperature shift. Some of the NPS climate stations had short pre-2014 records (Supplementary Table S1) and sporadic missing months of data due to wildlife damage to the sensors and other issues. To allow us to make use of all available months of data (i.e., even months where the full year was incomplete) when computing multiyear means, we first computed monthly means for the multiyear period (e.g., 2014–2019) using all available months and then computed the overall multiyear mean from these (weighted by month length as before). Confidence intervals for the multiyear monthly means were computed using the t-test critical value multiplied by the standard error. The confidence intervals for annual means derived from the monthly means were computed by adding the monthly uncertainties in quadrature (the square root of the squared sums of each monthly uncertainty).
To estimate the change in MAGT associated with the 2014 temperature shift, we used the MAGTs from sensors at 50-cm depth (MAGT50). This was the deepest sensor that was available across all sites. We assume that the change in MAGT50 (from pre- to post-2014) was similar to the change in MAGT at the top of the permafrost. This assumption would only be violated where there was a significant change in thermal offset below 50 cm between the pre- and post-2014 periods. We compared the means at all available depths to determine which sites were potentially affected by such a change in thermal offset. At sites where the 50-cm depth sensor had less than one year of data or many more missing values than the 20-cm depth sensor, we used the 20-cm depth sensor data to compare the pre- and post-2014 means (stations WRST_TANA, DENA_DKLA, CAKR_MNOA, and CAKR_TAHA; see Supplementary Table S1 for station abbreviations).
Results
The 2014 increase in mean annual air temperatures
MAATs increased abruptly beginning in water year 2014 at each of the eight NWS long-term weather stations near the NPS units studied (). shows Bettles as an example station; plots for all eight NWS stations are provided in Supplementary Figures S1 and S2. A comparison of the mean temperatures for the thirty years prior to 2014 (1984–2013) to those for 2014 to 2019 shows that the magnitude of this stepwise increase was 2.2°C to 3.4°C at the westernmost stations (Kotzebue, Nome, McGrath) and 1.1°C to 1.7°C at the remaining stations. The mean air temperatures at these eight stations for 2006 to 2013, the period of record available for the NPS climate monitoring data, were similar to but slightly colder (by 0.1°C–0.6°C) than the means for the thirty-year period ending in 2013. Thus, the magnitude of the 2014 increase shown by the NPS station data is probably close to or slightly larger than what would have been produced by comparison with a long-term (thirty-year) record. That the increase was stepwise, rather than a gradual upward trend, is indicated by the lack of temperature trends for the thirty-year period prior to 2014: Mann-Kendall trend tests for 1984 to 2013 were not significant at any NWS station ().
Figure 3. Mean annual air temperatures at Bettles, Alaska. Multiyear means are shown for 1984 to 2013 (brown), 2006 to 2013 (blue), and 2014 to 2019 (red).
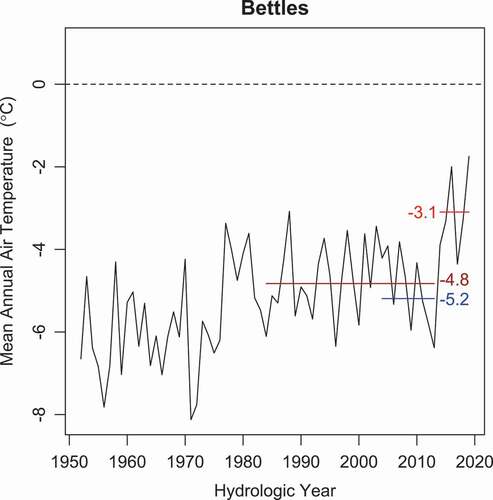
Table 2. Change in mean annual temperatures in 2014 at National weather service COOP stations and selected NPS stations.a
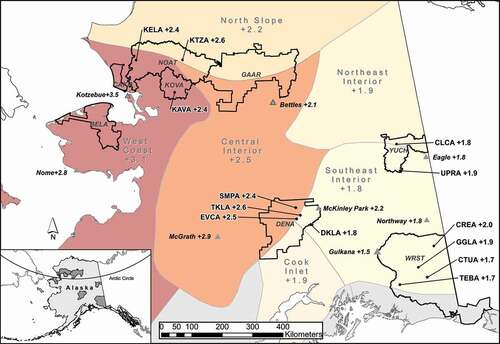
The regionwide jump in air temperatures in 2014 was apparent at all of the NPS climate monitoring stations that have data across this transition (, ). The magnitude of the change (+1.6°C to +2.6°C) was similar to that observed at the nearest NWS stations and the values modeled for the associated regions of Alaska by NCEI (Citation2020; ). Warming at stations above 1,000 m elevation was slightly greater (up to 0.3°C) than increases at the nearest stations below 1,000 m, but by far the strongest geographic trend in the amount of warming of air temperatures was an increase from east to west across central Alaska. Based on the data in and , the 2014 increase in air temperature relative to the preceding thirty-year period was probably at least 1°C at all locations, close to 2°C in DENA and most of the Arctic parks, 3°C or more in the far western coastal areas of ARCN.
Figure 4. Change in mean air temperature between 2006–2013 and 2014–2019 at the NPS climate stations in ARCN and CAKN parks. Includes all remote monitoring stations in Arctic (ARCN) and Central Alaska (CAKN) NPS units that have no more than fourteen months of missing data in each of the indicated intervals (2006–2013 and 2014–2019). Temperature changes were also calculated for the Alaska climate divisions (Bieniek et al. Citation2012) for the same time periods (by water year) from regional data by NCEI (Citation2020). Darker shading indicates a larger temperature increase post-2013 and highlights the greater amount of warming in the west.
The warming affected all seasons but was concentrated in the winter. Both the annual sum of thawing degree days and the annual sum of freezing degree days show that 2014 to 2019 was warmer than 1984 to 2013 at the eight NWS stations, but the change in freezing degree days (i.e., winter) was more than double the change in thawing degree days at all stations except Gulkana ().
Figure 5. Average annual sum of freeze and thawing degree days at NWS stations surrounding the study area, during the periods 1984 to 2013 and 2014 to 2019.
Relationship between mean annual air and ground temperatures
The 2014 warming resulted in clear increases in MAGT50 at most locations. Air and ground mean temperatures before and after the 2014 shift are summarized for all stations in (Arctic parks) and (central Alaska parks). Some example stations are presented in detail with annual means in Supplementary Figures S3 and S4.
Figure 6. Summary of air and ground temperatures in the Arctic parks before and after the 2014 temperature shift. Error bars give the t-test 95 percent confidence interval for the mean. Where error bars are missing there was less than two years of data. “Air PRISM” is the modeled mean air temperature for 1981 to 2010 by PRISM Climate Group (Citation2020). Station abbreviations (Supplementary Table S1) are arrayed along the bottom. The blue bar above the station identifier indicates permafrost was present (observed or inferred from temperatures).
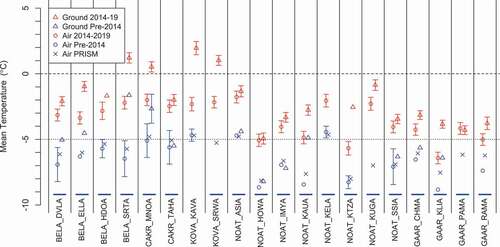
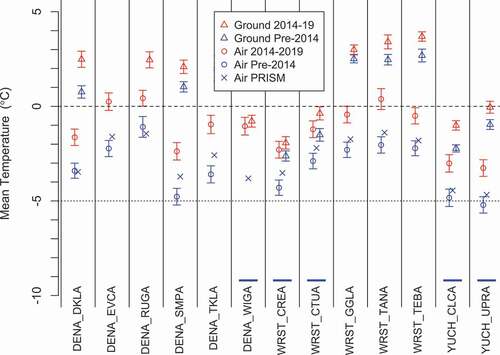
Figure 7. Summary of air and ground temperatures in the Central Alaska parks before and after the 2014 temperature shift. Error bars give the t-test 95 percent confidence interval for the mean. Where error bars are missing there was less than two years of data. “Air PRISM” is the modeled mean air temperature for 1981 to 2010 by PRISM Climate Group (Citation2020). Station abbreviations (Supplementary Table S1) are arrayed along the bottom. The blue bar above the station identifier indicates permafrost was present (observed or inferred from temperatures).
In the Arctic parks (, Supplementary Figure S3), pre-2014 MAATs were −4°C to −9°C, a range that would be expected for locations near the warm limit of the continuous permafrost zone (Jorgenson et al. Citation2008b). All stations had permafrost except for Kavet Creek (KOVA_KAVA). The latter station had young spruce trees growing in dense tall shrubs and cryoturbated horizons in the soil profile, suggesting that there was probably a talik zone over permafrost due to a wildfire (Swanson Citation1996); the fire was more than fifty years ago and prior to modern records. MAGT50 data prior to 2014 are limited in ARCN, but all were colder than −4°C except BELA_SRTA (which is probably affected by geothermal heating as evidenced by the hot springs located about 400 m from the site; Nordstrom et al. Citation2015). In the period 2014 to 2019, MAATs had all risen to be −2°C to −5°C (which is typical of the discontinuous permafrost zone) except for NOAT_KTZA (−5.7°C) and GAAR_KLIA (−6.4°C). Warming from 2014 to 2019 raised the six-year MAGT50 at two of the stations with permafrost above 0°C (BELA_SRTA and KOVA_SRWA), and CAKR_MNOA rose to be very near 0°C. MAGT50 was above 0°C in individual years during 2014 to 2019 at six of the twenty stations in the Arctic parks with permafrost. At the coldest stations in NOAT and GAAR, post-2014 MAGT50 remained near or below −2°C.
In the central Alaskan parks (, Supplementary Figure S4), pre-2014 MAATs were −1°C to −5°C, which is typical of the discontinuous permafrost zone. Permafrost was present at five of the stations (indicated by the blue bars above the station names in ). MAGT50 where permafrost was present was −1.0°C to −2.6°C prior to 2014. From 2014 to 2019, MAATs rose to be slightly above 0°C at three stations, and the coldest stations (in YUCH) rose to near −3°C (). In the period 2014 to 2019 the six-year mean ground temperatures at all of the stations with permafrost had risen to be between 0°C and −2°C. Three of the five stations on permafrost (DENA_WIGA, WRST_CTUA, and YUCH_UPRA) registered MAGT50 above 0°C in individual years, whereas MAGT50 at the other two stations (WRST_CREA, YUCH_CCLA) rose after 2014 but remained just below freezing. At the three stations in WRST that lack permafrost and have deep snow covers (GGLA, TANA, TEBA), the MAGT50 rose less in 2014 than the MAATs. The median maximum snow depths at GGLA, TANA, and TEBA were 1.59 m, 1.72 m, and 1.44 m respectively, as measured by the snow depth sensors at the site (Supplementary Table S2). At these three stations, ground temperatures remained near freezing all winter under the deep snow and they did not react strongly to the warmer winters that have occurred since 2014.
Estimates of the typical amount of change in ground temperatures that occurred between the long-term pre-2014 period and 2014 to 2019 are of interest because they help us predict the temperature range of permafrost that would have been destabilized by recent warming. For example, if there were a widespread and permanent 1°C increase in ground temperatures, most permafrost with prior temperatures of −1°C to 0°C would be destabilized. We summarized the observed amount of change from pre-2014 to 2014 to 2019 in multiyear average air temperatures and ground temperatures (). is based on the same data as , using stations where mean air and ground temperature data from both time periods were available. The data for the central Alaska parks cluster near a change in MAAT (ΔMAAT) of +2°C (range 1.5°C–2.6°C) and change in MAGT (ΔMAGT50) of +1°C (range +0.5°C to +1.7°C). For only stations on permafrost in central Alaska, the ranges are +1.7°C to +2.0°C for air temperature change and +0.7°C to +1.2°C for ground temperature change. In the Arctic parks, the data cluster near +3°C change in air temperature (range 2.3°C–4.3°C) and +3°C change in ground temperature (range +2.1°C to +3.6°C).
Figure 8. Plot of the change (from pre-2014 to 2014–2019) in mean air temperature vs. change in mean ground temperature at NPS climate monitoring stations. Circles (pf+) indicate stations where permafrost was present and triangles (pf−) indicate stations where permafrost was absent. Snowpack types are based on Sturm, Holmgren, and Liston (Citation1995). The sites from the Arctic (ARCN) and Central Alaska (CAKN) parks are enclosed with circles. The solid diagonal line marks equal change in air and ground temperatures (y = x), and the dashed line indicates where the change ground temperatures was half of the change in air temperatures (y = 0.5x).
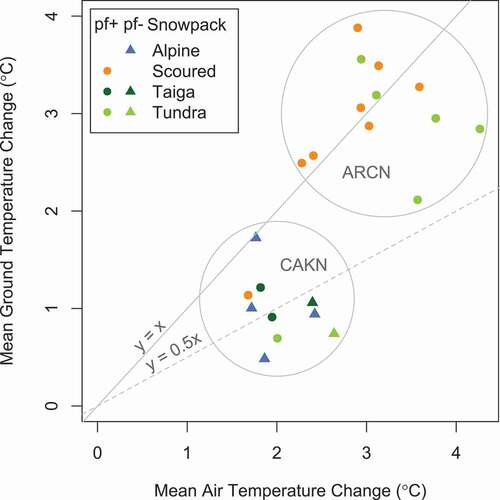
The stations with tundra-scoured snowpacks (snow mostly removed by wind; Supplementary Table S2) showed positive ΔMAGT50 roughly similar to ΔMAAT (i.e., near the “y = x” line in ). Stations with slightly deeper tundra snowpacks (median maximum snow depths of 0.2 to 0.5 m) showed a range of ΔMAGT50 from nearly equal to ΔMAAT to less than half ΔMAAT (below the “y = 0.5x” line in ). The deeper taiga and alpine snowpack types all had ΔMAGT50 smaller than ΔMAAT. Note that the ecosystems of each station generally match their snow type names (Supplementary Table S2), with the exception of DENA_TKLA (the sole CAKN tundra station lacking permafrost; open light green circle in ). This station is on a windswept floodplain just below treeline.
n-Factors and thermal offset effects
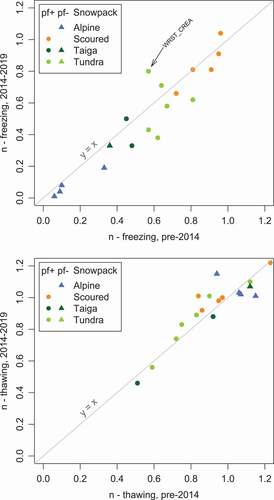
Freezing n-factors were strongly related to snowpack type (, Supplementary Table S3). The highest freezing n-factors were associated with tundra-scoured snowplack types, followed by tundra, taiga, and alpine. This is the inverse order of the depth and insulation value of the snowpack types (Sturm, Holmgren, and Liston Citation1995). The highest freezing n-factors under tundra-scoured snowpacks were near 1, whereas the lowest n-factors under alpine snowpacks were below 0.1. The freezing n-factors in 2014 to 2019 were similar to or lower than the pre-2014 values, except at station WRST_CREA where the n-factor increased. Thawing n-factors were mostly above 0.75 and weakly related to the environment (). The two exceptions with thawing n-factors near 0.6 were stations with organic surface soils and active layers less than 1 m thick. We used data from our shallowest sensor at 10-cm depth as the surface temperature to compute n-factors; at these two stations there was probably some damping of summer warming at 10 cm.
Figure 9. Plots of freezing n-factors (upper) and thawing n-factors (lower). The x-axes are n-factors for pre-2014 and the y-axes are n-factors for 2014 to 2019. The diagonal line marks equal n-factors pre- and post-2014.
Average thermal offsets of MAGT50 (TO50) relative to near-surface (10 cm) MAGT10 were within the range of sensor accuracy (±0.2°C) at the majority of stations (Supplementary Table S3). Thus, at these stations TO was minimal and MAGT50 cm is probably close to the MAGT in the upper permafrost. Eight of the stations on permafrost had negative TO50 of more than −0.2°C. Of these eight stations, four had deeper sensors (at 75 or 100 cm) that registered the same TO as the 50-cm sensor, indicating that additional TO below 50 cm was probably negligible, and one had TO50 similar to the TO at 20 cm depth, suggesting little additional TO below 20 cm. The three remaining are BELA_DVLA (TO50 = −0.4°C), GAAR_PAMA (TO50 = −0.3°C), and DENA_WIGA (TO50 = −1.0°C). An additional decline in MAGT of a few tenths of a degree is possible down to the bottom of the active layer at these three sites. Our data are insufficient to test whether the TO50 changed pre- to post-2014 at these three stations.
Discussion
The 2014 temperature increase
All of our monitoring stations showed an abrupt increase in MAAT in 2014 that resulted in an increase in ground temperatures. The amount of increase in MAAT varied regionally, with the greatest increases (up to 3.5°C) in the parks of coastal northwest Alaska and the smallest increases (1°C–2°C) in the parks of southeast Interior Alaska. The 2014 climatic shift in MAATs and MAGTs that we observed affected all of central and northern Alaska: The 2014 shift in MAATs that we observed is also evident in the aggregated time series data for the corresponding Alaska climate divisions (Bieniek et al. Citation2012; ) and in the NWS station data. The climate attributes responsible for the 2014 shift are a combination of global climatic warming, regional changes in the atmospheric circulation patterns, and a decline in sea ice (Walsh et al. Citation2017; Walsh and Brettschneider Citation2019; Thoman et al. Citation2020).
Evidence for elevation-dependent warming is weak in our data set, which ranges from near sea level to about 1,600 m elevation. Enhanced warming at high elevations has been noted adjacent to WRST in the St. Elias Range in Yukon, Canada (Williamson et al. Citation2020), but only at elevations well above the range of our data (over 3,000 m). Any elevation-dependent warming in our data is overwhelmed by the stronger trend of enhanced warming from east to west across Alaska.
The sudden, stepwise nature of our air and ground temperature increases across all sites occurred in the absence of substantial local vegetation change, showing that the phenomenon is regional in scope. Vegetation change in the Arctic, notably the increase in tall shrubs, is well documented and has been shown to increase snow depths and winter ground temperatures (Sturm et al. Citation2001; Tape, Sturm, and Racine Citation2006). However, in our study area vegetation changes have affected a relatively small proportion of the land area to date (Swanson Citation2013, Citation2015; Brodie et al. Citation2019). Annual photographs of our climate monitoring sites reveal very stable vegetation since the stations were installed. Over the course of the study we observed little shrub increase and only minor tree growth around two sites where trees had been killed prior to installation by disturbance (at KOVA_KAVA after fire and WRST_TEBA after beetle kill). The consistency of n-factors before and after the 2014 temperature shift () also indicates relatively stable local site conditions.
Change in MAGT vs. change in MAAT
The amount of increase in MAGT50 per unit increase in MAAT showed the expected relationship with n-factors described in the Introduction: The ratio between ΔMAGT50 and ΔMAAT was intermediate between the freezing and thawing n-factors at the site. The n-factors, in turn, were closely tied to vegetation and snowpack types, a fact well established from previous research (Lunardini Citation1978; Jorgenson et al. Citation2010; Lewkowicz et al. Citation2012; Way and Lewkowicz Citation2016). Thus, the stations in sparsely vegetated, windswept tundra areas with very thin tundra-scoured snowpacks had high n-factors (greater than 0.7) in both summer and winter and an approximately 1:1 ratio of ΔMAGT50 to ΔMAAT. In other words, without the thermal dampening effect of winter snow, ΔMAGT50 tracked ΔMAAT quite closely. The stations with deeper tundra snowpack types (20- to 50-cm median maximum snow depth; Supplementary Table S2) had lower freezing n-factors (down to about 0.5) and a wider range of ΔMAGT50 to ΔMAAT ratios down to about 0.5. The most anomalous permafrost tundra site was WRST_CREA (filled light green circle in ) with ΔMAGT50 of less than 1°C. This was the station with a positive change in freezing n-factor with post-2014 warming (see the labeled point on ), presumably due to thinner snowpacks: The four deepest maximum snow depths at WRST_CREA were all pre-2014. An increase in freezing n-factor implies relatively more surface chilling post-2014 than would have occurred with a constant n-factor, resulting in less ground warming than would otherwise have occurred at this station. The stations with highly insulative taiga and alpine snowpack types had low freezing n-factors (0.5 or less; ) and correspondingly low (less than 1) ratios of ΔMAGT50 to ΔMAAT (). Thus, where the snow cover dampens the effect of changing winter temperatures, the response of ΔMAGT50 to ΔMAAT is reduced. The majority of the stations with ratios of ΔMAGT50 to ΔMAAT of less than 0.5 lacked permafrost as a result of both the low freezing n-factors and milder climates overall at these locations.
The central Alaskan stations generally had smaller ΔMAAT from pre- to post-2014 than the Arctic parks, due to the smaller climate shift observed in eastern interior Alaska discussed previously. The central Alaskan stations also generally showed a smaller response of MAGT50 to the change (i.e., the ratio of ΔMAGT50 to ΔMAAT was near 0.5:1 in CAKN vs. near 1:1 in ARCN). The more muted response of the CAKN stations to the temperature shift is probably due to the predominance in our CAKN data set of stations with taiga and alpine snowpack types vs. tundra-scoured and tundra types in ARCN. Thus, it is possible that some windswept tundra areas in the central Alaskan parks could behave like the Arctic parks and show a greater response to increasing MAAT (e.g., 1°C of rise in MAGT per degree of rise in MAAT). In the Arctic parks a weaker response to warming of MAAT (i.e., just 0.5°C rise in MAGT per degree of MAAT) is possible in two environments where we lack direct observations in ARCN: (1) under deep tundra snow drifts, which are present across most of the parks and could have conditions approaching those of “alpine” snowpacks, and (2) in the forested lowlands in the southern parts of KOVA and GAAR, where taiga snowpack types are expected (Sturm, Holmgren, and Liston Citation1995).
As a result of TO below 50 cm depth, MAGT50 is not necessarily equal to MAGT at the top of the permafrost. However, as long as the TO below 50 cm changed little with the 2014 temperature shift, our observed ΔMAGT50 should be very close to the change in mean annual temperature at the top of the permafrost. Our results suggested little TO below 50 cm depth at all except three stations. In addition, TO depends on soil composition and wetness (Burn and Smith Citation1988); the former generally does not change, and the latter is largely controlled by the setting. However, changing TOs are possible at least locally in the future—for example, as a result of thermokarst inundation or drying due to thickening of the active layer—and these could cause local deviations from the simple relationships of ΔMAGT50 and temperature at the top of the permafrost to ΔMAAT described here.
Implications for permafrost
Given the magnitude of the stepwise MAAT increase that occurred in 2014 relative to the preceding thirty years (at least 1°C at all locations, probably closer to 2°C in DENA and the ARCN parks, and potentially 3°C or more in the far western coastal areas of ARCN) and the MAAT–MAGT50 relationships discussed above, we conservatively estimate that the 2014 temperature shift raised MAGT50 throughout the central Alaskan parks by 0.5°C, with 1°C possible in DENA. Likewise, the 2014 temperature shift should have raised MAGT50 by about 2°C across most of the Arctic parks, with 3°C or more possible in some areas, particularly in the coastal west, and as little as 1°C possible in the taiga of southern KOVA and GAAR.
The implication of this temperature shift for the central Alaskan parks is that permafrost in most areas with MAGT at the top of the permafrost of −0.5°C or warmer prior to 2014 should have begun thawing during the past six years, and many areas that had permafrost in the −0.5°C to −1°C range may have also begun to thaw. The area covered by permafrost warmer than −1°C prior to 2014 was estimated to be 34 percent of DENA and 19 percent of WRST (). Maps derived from Panda, Marchenko, and Romanovsky (Citation2014a, Citation2014b) data show that the probable thawing permafrost in DENA is located in the Alaska Range foothills and on the plains north of the Alaska Range (), and in WRST the probable thawing permafrost is located in the valley bottoms and lower slopes of the Copper and Chitina River valleys ().
In the Arctic parks, nearly all areas that had permafrost warmer than −1°C prior to 2014 should have begun to thaw during 2014 to 2019, along with most areas with permafrost above −2°C and some areas with temperatures around −3°C, especially in the west. Panda, Marchenko, and Romanovsky’s (Citation2016) model shows that in ARCN the probable thawing permafrost (previously warmer than −1°C or −2°C) is concentrated in the lowlands and valleys of southern KOVA and GAAR. With +3°C of ground warming, large areas of gently sloping tundra in the western Arctic parks would be vulnerable to thaw (). The area covered by permafrost warmer than −3.0°C is estimated to be 33 percent of BELA and 40 percent of KOVA (). The stations where 2014 to 2019 mean ground temperatures were observed to rise to near 0°C (CAKR_MNOA) or above (BELA_SRTA, KOVA_SRWA) had modeled 2000 to 2009 ground temperatures in of −3°C to −4°C, suggesting that the areas with modeled prior permafrost temperatures of −3°C are indeed vulnerable to thaw.
Thus, the warming-related thaw of permafrost in Alaska predicted by Osterkamp and Lachenbruch (Citation1990) has apparently arrived, after a delay due to flat temperature trends over much of Alaska for several decades following the mid-1970s’ stepwise temperature increase. The relationship between the change in air temperatures and change in ground temperatures developed in our study will be useful for understanding the state of permafrost in response to future warming.
Effects and rate of permafrost thaw
The effects of a sudden increase in surface temperatures on underlying permafrost are well known from research on the effects of fire (Dyrness Citation1982; Burn Citation1998; Yoshikawa et al. Citation2002; Viereck et al. Citation2008; Jafarov et al. Citation2013; Nossov et al. Citation2013) and mechanical vegetation removal and surface disturbance (Péwé Citation1954; Linell Citation1973). These disturbance events result in a sudden ground surface temperature increase, followed by an increase in the thaw depth within a year. If the magnitude of warming is sufficient to raise the MAGT at the base of the seasonally freezing layer above 0°C, a continuously thawed layer (talik) will develop. If thaw encounters ice-rich material, then a variety of dramatic effects may result, including subsidence and formation of pits or troughs and mass movements on slopes (e.g., Péwé Citation1954; Jorgenson et al. Citation2001; Lewkowicz and Harris Citation2005; Jorgenson, Shur, and Pullman Citation2006; Liljedahl et al. Citation2016). Even in the absence of massive ice, permafrost thaw alters groundwater hydrology by increasing shallow sediment water storage capacity and opening new potential water flow paths (Yoshikawa and Hinzman Citation2003; Hinzman et al. Citation2006). Surface disturbance by wildfire combined with climatic warming may enhance the effects of either driver alone (Jafarov et al. Citation2013). Where warming causes permafrost temperatures to rise but remain slightly below freezing, permafrost that formed under colder climates in the past may persist as “ecosystem-protected” (Shur and Jorgenson Citation2007, p. 10) but will be unable to re-form after any kind of disturbance.
Rapid thaw of permafrost occurs where erosion by flowing water or slope failure removes the thawed material or where ponding of water reduces winter freeze-back. Elsewhere the rate of thaw slows as the newly thawed layer increases in thickness, and the long-term rate of thaw can be quite slow. In a detailed case study by Burn (Citation1998), a fire in spruce forest near Whitehorse, Yukon Territory, Canada, in 1958 produced a sudden increase in MAGT at 50-cm depth from about −0.6°C to 2.3°C (based on a comparison with neighboring unburned areas). This resulted in the degradation of permafrost from a depth of 1.4 m (the estimated bottom of the original active layer) to 3.75 m by 1996 (thirty-eight years post-fire), though the entire thawed layer was still freezing back entirely in 1996. Burn estimated that over a thousand years would be required to thaw the entire 14-m-thick layer of ice-rich permafrost at the site. More rapid permafrost degradation occurred in an agricultural field in Fairbanks, Alaska (Nicolsky and Romanovsky Citation2018; Permafrost Laboratory Citation2020; where a 12.5-m-thick talik zone had formed by 2016 after clearing of the field in the 1930s. Borehole temperatures suggest that the original permafrost temperature was about −0.2°C and clearing increased MAGTs below the depth of thermal offset to about +1°C. These two case studies illustrate the range in possible talik development that could result if our observed stepwise temperature shift persists.
Conclusions
Observations at a network of climate monitoring stations in the national parks of central and northern Alaska and at nearby long-term weather stations show that a stepwise increase in MAAT and MAGT occurred in 2014. MAATs for the period 2014 to 2019 were 1°C to 3.5°C higher than in the preceding thirty-year period, with the greatest increases in coastal northwestern parks. The associated increases in MAGT from the 2014 temperature shift were similar in magnitude to the increases in MAAT in areas with thin, wind-scoured snowpacks and high freezing n-factors (near 1.0). In permafrost environments with deeper snow and associated lower freezing n-factors (near 0.5), the magnitude of MAGT temperature increase was lower, roughly half the change in MAAT. Thus, the resulting increase in permafrost temperatures for the period 2014 to 2019 relative to the preceding thirty-year period probably ranged from 0.5°C to about 3.0°C, with the greatest changes in the western Arctic parks. Our study area has extensive regions of permafrost warmer than −3.0°C that are likely to have begun to thawing as a result of warming.
Whether conditions as warm as 2014 to 2019 will persist in the near future is unknown, though climate models suggest that conditions as warm as those observed in recent years could become the norm by the 2050s (Walsh et al. Citation2017). If MAGTs in lands with permafrost rise above freezing as we observed and stay there, an ever-thickening thawed surface layer will develop and a centuries-long process of transition to a very different landscape without permafrost will have begun. This transition would have widespread implications for natural resources and infrastructure in America’s northernmost national parks and neighboring lands.
Supplemental Material
Download Zip (694.7 KB)Data availability statement
The data analyzed in this report are openly available in the National Park Service Data Store at:
Disclosure statement
No potential conflict of interest was reported by the authors.
Supplementary material
Supplemental material for this article can be accessed on the publisher’s website.
Additional information
Funding
References
- Belshe, E. F., E. A. G. Schuur, and G. Grosse. 2013. Quantification of upland thermokarst features with high resolution remote sensing. Environmental Research Letters 8 (3):035016. doi:https://doi.org/10.1088/1748-9326/8/3/035016.
- Bieniek, P. A., J. E. Walsh, R. L. Thoman, and U. S. Bhatt. 2014. Using climate divisions to analyze variations and trends in Alaska temperature and precipitation. Journal of Climate 27 (8):2800–18. doi:https://doi.org/10.1175/JCLI-D-13-00342.1.
- Bieniek, P. A., U. S. Bhatt, R. L. Thoman, H. Angeloff, J. Partain, J. Papineau, F. Fritsch, E. Holloway, J. E. Walsh, C. Daly, et al. 2012. Climate divisions for Alaska based on objective methods. Journal of Applied Meteorology and Climatology 51 (7):1276–89. doi:https://doi.org/10.1175/JAMC-D-11-0168.1.
- Box, J. E., W. T. Colgan, T. R. Christensen, N. M. Schmidt, M. Lund, F.-J. W. Parmentier, R. Brown, U. S. Bhatt, E. S. Euskirchen, V. E. Romanovsky, et al. 2019. Key indicators of arctic climate change: 1971–2017. Environmental Research Letters 14 (4):045010. doi:https://doi.org/10.1088/1748-9326/aafc1b.
- Braithwaite, R. J. 1984. Calculation of degree-days for glacier-climate research. Zeitschrift Für Gletscherkunde Und Glazialgeologie 20 (1984):1–8.
- Brodie, J. F., C. A. Roland, S. E. Stehn, and E. Smirnova. 2019. Variability in the expansion of trees and shrubs in Boreal Alaska. Ecology 100 (5):e02660. doi:https://doi.org/10.1002/ecy.2660.
- Brown, R. J. E. 1973. Influence of climatic and terrain factors on ground temperatures at three locations in the permafrost region of Canada. Proceedings of the Second International Conference on Permafrost, Yakutsk, USSR, North American Contribution. National Academy of Science, 27–34, Washington, DC.
- Burn, C. R. 1998. The response (1958–1997) of permafrost and near-surface ground temperatures to forest fire, Takhini River Valley, Southern Yukon Territory. Canadian Journal of Earth Sciences 35 (2):184–99.
- Burn, C. R., and C. A. S. Smith. 1988. Observations of the “thermal offset” in near-surface mean annual ground temperatures at several sites near Mayo, Yukon Territory, Canada. Arctic 41 (2):99–104. doi:https://doi.org/10.14430/arctic1700.
- Chapin, F. S., M. W. Oswood, K. Van Cleve, L. A. Viereck, and D. L. Verbyla. 2006. Alaska’s changing boreal forest. New York, NY: Oxford University Press.
- Clark, M. H., and M. S. Duffy. 2006. Soil survey of Denali National Park area. Palmer, Alaska: United States Department of Agriculture, Natural Resources Conservation Service. https://www.nrcs.usda.gov/Internet/FSE_MANUSCRIPTS/alaska/AK651/0/DenaliPark.pdf.
- Dyrness, C. T. 1982. Control of depth to permafrost and soil temperature by the forest floor in black spruce/feathermoss communities. Research Note PNW-396. Portland, Oregon: US Dept. of Agriculture, Forest Service, Pacific Northwest Forest and Range Experiment Station.
- Frost, G., M. J. Macander, A. K. Liljedahl, and D. A. Walker. 2015. Regional patterns of ice-wedge degradation across Northern Alaska: What does asynchronous timing of onset tell us regarding triggering mechanisms, thresholds, and impacts?. 2015 AGU Fall Meeting, C21C-0750. San Francisco, California: American Geophysical Union. https://agu.confex.com/agu/fm15/webprogram/Paper61659.html.
- Garibaldi, M. C., P. P. Bonnaventure, and S. F. Lamoureux. 2020. Utilizing the TTOP model to understand spatial permafrost temperature variability in a High Arctic landscape, Cape Bounty, Nunavut, Canada. Permafrost and Periglacial Processes.
- Gonzalez, P., F. Wang, M. Notaro, D. J. Vimont, and J. W. Williams. 2018. Disproportionate magnitude of climate change in United States National Parks. Environmental Research Letters 13 (10):104001. doi:https://doi.org/10.1088/1748-9326/aade09.
- Goodrich, L. E. 1978. Some results of a numerical study of ground thermal regimes. Third International Conference on Permafrost, vol. 1, 29–34. Edmonton, Alberta, Canada: National Research Council of Canada.
- Harris, S. A., A. Brouchkov, and C. Guodong. 2017. Geocryology: Characteristics and use of frozen ground and permafrost landforms. Boca Raton, Florida: CRC press.
- Hartmann, B., and G. Wendler. 2005. The significance of the 1976 Pacific climate shift in the climatology of Alaska. Journal of Climate 18 (22):4824–39. doi:https://doi.org/10.1175/JCLI3532.1.
- Hinzman, L. D., W. Robert Bolton, K. C. Petrone, J. B. Jones, and P. C. Adams. 2006. Watershed hydrology and chemistry in the Alaskan Boreal forest the central role of permafrost. In Alaska’s changing boreal forest, ed. F. S. Chapin III, M. W. Oswood, K. Van Cleve, L. A. Viereck, and D. L. Verbyla, 269–84. New York, NY: Oxford University Press.
- Jafarov, E. E., V. E. Romanovsky, H. Genet, A. D. McGuire, and S. S. Marchenko. 2013. The effects of fire on the thermal stability of permafrost in lowland and upland black spruce forests of interior Alaska in a changing climate. Environmental Research Letters 8 (3):035030. doi:https://doi.org/10.1088/1748-9326/8/3/035030.
- Jorgenson, M. T., C. H. Racine, J. C. Walters, and T. E. Osterkamp. 2001. Permafrost degradation and ecological changes associated with a warming climate in central Alaska. Climatic Change 48 (4):551–79. doi:https://doi.org/10.1023/A:1005667424292.
- Jorgenson, M. T., J. E. Roth, P. F. Loomis, E. R. Pullman, T. C. Cater, M. S. Duffy, A. F. Davis, and M. J. Macander. 2008a. An ecological land survey and landcover map of Wrangell-St. Elias National Park and Preserve. Natural Resource Technical Report ARCN/NRTR-2008/094. Fort Collins (CO): National Park Service. https://irma.nps.gov/DataStore/Reference/Profile/653862.
- Jorgenson, M. T., J. E. Roth, P. F. Miller, M. J. Macander, M. S. Duffy, A. F. Wells, G. V. Frost, and E. R. Pullman. 2009. An ecological land survey and landcover map of the arctic network. Natural Resource Technical Report ARCN/NRTR-2009/270. Fort Collins (CO): National Park Service. https://irma.nps.gov/App/Reference/Profile/663934.
- Jorgenson, M. T., K. Yoshikawa, M. Kanevskiy, Y. Shur, V. Romanovsky, S. Marchenko, G. Grosse, J. Brown, and B. Jones. 2008b. Permafrost characteristics of Alaska. Fairbanks: Institute of Northern Engineering, University of Alaska Fairbanks. http://www.cryosphericconnection.org/resources/alaska_permafrost_map_dec2008.pdf.
- Jorgenson, M. T., V. Romanovsky, J. Harden, Y. Shur, J. O’Donnell, E. A. G. Schuur, M. Kanevskiy, and S. Marchenko. 2010. Resilience and vulnerability of permafrost to climate change. Canadian Journal of Forest Research 40 (7):1219–36. doi:https://doi.org/10.1139/X10-060.
- Jorgenson, M. T., Y. L. Shur, and E. R. Pullman. 2006. Abrupt Increase in permafrost degradation in Arctic Alaska. Geophysical Research Letters 33 (2). http://onlinelibrary.wiley.com/doi/ https://doi.org/10.1029/2005GL024960/pdf.
- Lader, R., J. E. Walsh, U. S. Bhatt, and P. A. Bieniek. 2017. Projections of twenty-first-century climate extremes for Alaska via dynamical downscaling and quantile mapping. Journal of Applied Meteorology and Climatology 56 (9):2393–409. doi:https://doi.org/10.1175/JAMC-D-16-0415.1.
- Lewkowicz, A. G., and C. Harris. 2005. Frequency and magnitude of active-layer detachment failures in discontinuous and continuous permafrost, Northern Canada. Permafrost and Periglacial Processes 16 (1):115–30. doi:https://doi.org/10.1002/ppp.522.
- Lewkowicz, A. G., P. P. Bonnaventure, S. L. Smith, and Z. Kuntz. 2012. Spatial and thermal characteristics of mountain permafrost, Northwest Canada. Geografiska Annaler: Series A, Physical Geography 94 (2):195–213. doi:https://doi.org/10.1111/j.1468-0459.2012.00462.x.
- Liljedahl, A. K., J. Boike, R. P. Daanen, A. N. Fedorov, G. V. Frost, G. Grosse, L. D. Hinzman, Y. Iijma, J. C. Jorgenson, N. Matveyeva, et al. 2016. Pan-Arctic ice-wedge degradation in warming permafrost and its influence on tundra hydrology. Nature Geoscience 9:312–18. doi:https://doi.org/10.1038/NGEO2674.
- Linell, K. A. 1973. Long-term effects of vegetative cover on permafrost stability in an area of discontinuous permafrost. Permafrost: North American Contribution to the Second International Conference, 1973, 688–93. Yakutsk, USSR: National Academy of Sciences.
- Loso, M. G. 2018. Permafrost monitoring in the central Alaska network: Protocol narrative. Natural Resource Report NPS/CAKN/NRR—2018/1760. Fort Collins, Colorado: National Park Service. https://irma.nps.gov/Datastore/Reference/Profile/2256598.
- Lunardini, V. J. 1978. Theory of N-factors and correlation of data. Proceedings of the Third International Conference on Permafrost, vol. 1, 40–46. Edmonton, Alberta, Canada: National Research Council of Canada Ottawa.
- Mantua, N. J., S. R. Hare, Y. Zhang, J. M. Wallace, and R. C. Francis. 1997. A Pacific interdecadal climate oscillation with impacts on salmon production. Bulletin of the American Meteorological Society 78 (6):1069–80. doi:https://doi.org/10.1175/1520-0477(1997)078<1069:APICOW>2.0.CO;2.
- Markon, C., S. Gray, M. Berman, L. Eerkes-Medrano, T. Hennessy, H. P. Huntington, J. S. Littell, M. McCammon, R. Thoman, and S. Trainor. 2018. Alaska. In Impacts, risks, and adaptation in the United States: Fourth national climate assessment, vol. II, 1185–241. Washington, D.C.: U.S. Global Change Research Program. doi:https://doi.org/10.7930/NCA4.2018.CH26.
- McLoed, A. I. 2011. Kendall: Kendall rank correlation and mann-kendall trend test (version R package version 2.2). http://CRAN.R-project.org/package=Kendall.
- National Wildfire Coordinating Group (NWCG). 2019. National Wildfire Coordinating Group Standards for Fire Weather Stations. PMS 426-3. National Wildfire Coordinating Group (NWCG). https://www.nwcg.gov/publications/426-3.
- Nicolsky, D. J., and V. E. Romanovsky. 2018. Modeling long-term permafrost degradation. Journal of Geophysical Research: Earth Surface 123 (8):1756–71.
- NOAA National Centers for Environmental Information, (NCEI). 2020. Climate at a glance. https://www.ncdc.noaa.gov/cag/.
- NOAA Regional Climate Centers. 2020. XmACIS2. http://xmacis.rcc-acis.org/.
- Nordstrom, D. K., L. Hasselbach, S. E. Ingebritsen, D. Skorupa, R. B. McCleskey, and T. R. McDermott. 2015. An environmental survey of serpentine hot springs: Geology, hydrology, geochemistry, and microbiology. Natural Resource Report NPS/BELA/NRR—2015/1019. Fort Collins, Colorado. https://irma.nps.gov/DataStore/Reference/Profile/2224027.
- Nossov, D. R., M. Torre Jorgenson, K. Kielland, and M. Z. Kanevskiy. 2013. Edaphic and microclimatic controls over permafrost response to fire in interior Alaska. Environmental Research Letters 8 (3):035013. doi:https://doi.org/10.1088/1748-9326/8/3/035013.
- Osterkamp, T. E. 2003. Establishing long-term permafrost observatories for active-layer and permafrost investigations in Alaska: 1977–2002. Permafrost and Periglacial Processes 14 (4):331–42. doi:https://doi.org/10.1002/ppp.464.
- Osterkamp, T. E. 2005. The recent warming of permafrost in Alaska. Global and Planetary Change 49 (3):187–202.
- Osterkamp, T. E. 2007. Characteristics of the recent warming of permafrost in Alaska. Journal of Geophysical Research: Earth Surface (2003–2012) 112 (F2):F02S02. doi:https://doi.org/10.1029/2006JF000578.
- Osterkamp, T. E., and A. H. Lachenbruch. 1990. Thermal regime of permafrost in Alaska and predicted global warming. Journal of Cold Regions Engineering 4 (1):38–42. doi:https://doi.org/10.1061/(ASCE)0887-381X(1990)4:1(38).
- Osterkamp, T. E., M. T. Jorgenson, E. A. G. Schuur, Y. L. Shur, M. Z. Kanevskiy, J. G. Vogel, and V. E. Tumskoy. 2009. Physical and ecological changes associated with warming permafrost and thermokarst in interior Alaska. Permafrost and Periglacial Processes 20 (3):235–56. doi:https://doi.org/10.1002/ppp.656.
- Overland, J., E. Dunlea, J. E. Box, R. Corell, M. Forsius, V. Kattsov, M. S. Olsen, J. Pawlak, L.-O. Reiersen, and M. Wang. 2019a. The urgency of Arctic change. Polar Science 21:6–13.
- Overland, J. E., E. Hanna, I. Hanssen-Bauer, S.-J. Kim, J. E. Walsh, M. Wang, U. S. Bhatt, R. L. Thoman, and T. J. Ballinger. 2019b. Arctic report card: Update for 2019 - surface air temperature. Surface Air Temperature. https://arctic.noaa.gov/Report-Card/Report-Card-2019/ArtMID/7916/ArticleID/835/Surface-Air-Temperature.
- Panda, S. K., S. S. Marchenko, and V. E. Romanovsky. 2014a. High-resolution permafrost modeling in Denali National Park and Preserve. Natural Resource Report NPS/CAKN/NRTR—2014/858. Fort Collins, Colorado: National Park Service. https://irma.nps.gov/App/Reference/Profile/2208990.
- Panda, S. K., S. S. Marchenko, and V. E. Romanovsky. 2014b. High-resolution permafrost modeling in Wrangell-St. Elias National Park and Preserve. Natural Resource Report NPS/CAKN/NRTR—2014/861. Fort Collins, Colorado: National Park Service. https://irma.nps.gov/App/Reference/Profile/2209250.
- Panda, S. K., S. S. Marchenko, and V. E. Romanovsky. 2016. High-resolution permafrost modeling in the arctic network of national parks, preserves and monuments. Natural Resource Report NPS/ARCN/NRR-2016/1366. Fort Collins, Colorado: National Park Service. https://irma.nps.gov/DataStore/Reference/Profile/2237720.
- Papineau, J. M. 2001. Wintertime temperature anomalies in Alaska correlated with ENSO and PDO. International Journal of Climatology: A Journal of the Royal Meteorological Society 21 (13):1577–92. doi:https://doi.org/10.1002/joc.686.
- Permafrost Laboratory, University of Alaska Fairbanks Geophysical Institute. 2020. UAF Farm | Permafrost Laboratory. http://permafrost.gi.alaska.edu/site/uf1
- Péwé, T. L. 1954. Effect of permafrost on cultivated fields, Fairbanks Area, Alaska. Geological Survey Bulletin 989-F. US Government Printing Office.
- Ping, C. L., G. J. Michaelson, E. C. Packee, C. A. Stiles, D. K. Swanson, and K. Yoshikawa. 2005. Soil catena sequences and fire ecology in the boreal forest of Alaska. Soil Science Society of America Journal 69 (6):1761–72.
- PRISM Climate Group. 2020. Alaska. Oregon State University. http://prism.oregonstate.edu/projects/alaska.php.
- R Core Team. 2017. R: A Language and Environment for Statistical Computing (version 3.4.1). Vienna, Austria: R Foundation for Statistical Computing. http://www.R-project.org.
- Richter-Menge, J., M. L. Druckenmiller, and M. Jeffries. 2019. Arctic report card 2019. Surface air temperature. https://arctic.noaa.gov/Report-Card/Report-Card-2019.
- Roland, C. A., J. H. Schmidt, S. G. Winder, S. E. Stehn, and E. Fleur Nicklen. 2019. Regional variation in interior Alaskan boreal forests is driven by fire disturbance, topography, and climate. Ecological Monographs 89 (3):e01369. doi:https://doi.org/10.1002/ecm.1369.
- Romanovsky, V. E., and T. E. Osterkamp. 1995. Interannual variations of the thermal regime of the active layer and near-surface permafrost in Northern Alaska. Permafrost and Periglacial Processes 6 (4):313–35.
- Schuur, E. A. G., A. David McGuire, C. Schädel, G. Grosse, J. W. Harden, D. J. Hayes, G. Hugelius, C. D. Koven, P. Kuhry, D. M. Lawrence, et al. 2015. Climate change and the permafrost carbon feedback. Nature 520 (7546):171–79. doi:https://doi.org/10.1038/nature14338.
- Shulski, M., and G. Wendler. 2007. The climate of Alaska. Fairbanks: University of Alaska Press.
- Shur, Y. L., and M. T. Jorgenson. 2007. Patterns of permafrost formation and degradation in relation to climate and ecosystems. Permafrost and Periglacial Processes 18 (1):7–19. doi:https://doi.org/10.1002/ppp.582.
- Smith, M. W., and D. W. Riseborough. 2002. Climate and the limits of permafrost: A zonal analysis. Permafrost and Periglacial Processes 13 (1):1–15.
- Sousanes, P. J. 2018. Climate monitoring protocol for the Central Alaska network: Denali National Park and Preserve, Wrangell-St. Elias national park and preserve, and Yukon-Charley National Park and Preserve, version 1.01. Natural Resource Report NPS/ARCN/NRR—2018/1599. Fort Collins, Colorado: National Park Service. https://irma.nps.gov/DataStore/Reference/Profile/2251883.
- Sousanes, P. J. 2020. CAKN weather and climate complete protocol package WC-2020 used beginning April 2020 (WC_A). https://irma.nps.gov/DataStore/Reference/Profile/2271667.
- Sousanes, P. J., and K. Hill. 2017. Protocol implementation plan for monitoring weather and climate in the Arctic network. Natural Resource Report NPS/ARCN/NRR—2017/1537. Fort Collins, Colorado: National Park Service. https://irma.nps.gov/DataStore/Reference/Profile/2245839.
- Sturm, M., J. Holmgren, and G. E. Liston. 1995. A seasonal snow cover classification system for local to global applications. Journal of Climate 8 (5):1261–83.
- Sturm, M., J. H. J. P. McFadden, G. E. Liston, F. S. Chapin, and C. H. Racine. 2001. Snow–shrub interactions in Arctic tundra: A hypothesis with climatic implications. Journal of Climate 14 (3):336–44. doi:https://doi.org/10.1175/1520-0442(2001)014<0336:SSIIAT>2.0.CO;2.
- Swanson, D. K. 1996. Susceptibility of permafrost soils to deep thaw after forest fires in interior Alaska, USA, and some ecologic implications. Arctic and Alpine Research 28 (2):217–27.
- Swanson, D. K. 2013. Three decades of landscape change in Alaska’s Arctic national parks: Analysis of aerial photographs, c. 1980–2010. Natural Resource Technical Report NPS/ARCN/NRTR—2013/668. Fort Collins (CO): National Park Service. https://irma.nps.gov/App/Reference/Profile/2192701.
- Swanson, D. K. 2015. Environmental limits of tall shrubs in Alaska’s Arctic National Parks. PloS ONE 10 (9):e0138387. doi:https://doi.org/10.1371/journal.pone.0138387.
- Swanson, D. K. 2017a. Permafrost monitoring protocol for the Arctic Network: Narrative. Natural Resource Report NPS/ARCN/NRR-2017/1396. Fort Collins, Colorado: National Park Service. https://irma.nps.gov/DataStore/Reference/Profile/2238783.
- Swanson, D. K. 2017b. Permafrost monitoring protocol for the Arctic Network: Standard operating procedures. Natural Resource Report NPS/ARCN/NRR-2017/1397. Fort Collins, Colorado: National Park Service. https://irma.nps.gov/DataStore/Reference/Profile/2238788.
- Tape, K., M. Sturm, and C. Racine. 2006. The evidence for shrub expansion in Northern Alaska and the Pan-Arctic. Global Change Biology 12 (4):686–702. doi:https://doi.org/10.1111/j.1365-2486.2006.01128.x.
- Thoman, R. L., U. S. Bhatt, P. A. Bieniek, B. R. Brettschneider, M. Brubaker, S. L. Danielson, Z. Labe, R. Lader, W. N. Meier, G. Sheffield, et al. 2020. The record low bering sea ice extent in 2018: Context, impacts, and an assessment of the role of anthropogenic climate change. Bulletin of the American Meteorological Society 101 (1):S53–S58. doi:https://doi.org/10.1175/BAMS-D-19-0175.1.
- Trenberth, K. E., and J. W. Hurrell. 1994. Decadal atmosphere-ocean variations in the Pacific. Climate Dynamics 9 (6):303–19.
- Viereck, L. A., N. R. Werdin-Pfisterer, P. C. Adams, and K. Yoshikawa. 2008. Effect of wildfire and fireline construction on the annual depth of thaw in a black spruce permafrost forest in interior Alaska: A 36-year record of recovery. In Proceedings of the Ninth International Conference on Permafrost, eds., D. L. Kane and K. M. Hinkel, 1845–50, Fairbanks, AK, June 29–July 3. https://www.fs.usda.gov/treesearch/pubs/all/32468.
- Walsh, J. E., and B. Brettschneider. 2019. Attribution of recent warming in Alaska. Polar Science 21:101–09.
- Walsh, J. E., P. A. Bieniek, B. Brettschneider, E. S. Euskirchen, R. Lader, and R. L. Thoman. 2017. The exceptionally warm winter of 2015/16 in Alaska. Journal of Climate 30 (6):2069–88. doi:https://doi.org/10.1175/JCLI-D-16-0473.1.
- Walsh, J. E., R. L. Thoman, U. S. Bhatt, P. A. Bieniek, B. Brettschneider, M. Brubaker, S. Danielson, R. Lader, F. Fetterer, K. Holderied, et al. 2018. The high latitude marine heat wave of 2016 and its impacts on Alaska. Bulletin of the American Meteorological Society 99 (1):S39–S43. doi:https://doi.org/10.1175/BAMS-D-17-0105.1.
- Way, R. G., and A. G. Lewkowicz. 2016. Modelling the spatial distribution of permafrost in Labrador–Ungava using the temperature at the top of permafrost. Canadian Journal of Earth Sciences 53 (10):1010–28. doi:https://doi.org/10.1139/cjes-2016-0034.
- Wendler, G., B. Moore, and K. Galloway. 2014. Strong temperature increase and shrinking sea ice in Arctic Alaska. The Open Atmospheric Science Journal 8:1.
- Wendler, G., L. Chen, and B. Moore. 2012. The first decade of the new century: A cooling trend for most of Alaska. Open Atmospheric Science Journal 6:111–16. doi:https://doi.org/10.2174/1874282301206010111.
- Williamson, S. N., C. Zdanowicz, F. S. Anslow, G. K. C. Clarke, L. Copland, R. K. Danby, G. E. Flowers, G. Holdsworth, A. H. Jarosch, and D. S. Hik. 2020. Evidence for elevation-dependent warming in the St. Elias Mountains, Yukon, Canada. Journal of Climate 33 (8):3253–69. doi:https://doi.org/10.1175/JCLI-D-19-0405.1.
- Yoshikawa, K., and L. D. Hinzman. 2003. Shrinking thermokarst ponds and groundwater dynamics in discontinuous permafrost near Council, Alaska. Permafrost and Periglacial Processes 14 (2):151–60. doi:https://doi.org/10.1002/ppp.451.
- Yoshikawa, K., W. R. Bolton, V. E. Romanovsky, M. Fukuda, and L. D. Hinzman. 2002. Impacts of wildfire on the permafrost in the boreal forests of interior Alaska. Journal of Geophysical Research: Atmospheres 107 (D1):FFR–4.