
 ?Mathematical formulae have been encoded as MathML and are displayed in this HTML version using MathJax in order to improve their display. Uncheck the box to turn MathJax off. This feature requires Javascript. Click on a formula to zoom.
ABSTRACT
The Andean páramo is notable for high soil carbon storage and its contribution to ecosystem services. However, the páramo’s ability to maintain high soil carbon levels is threatened by land use change from tussock grassland and shrublands to agricultural uses. A chronosequence study was conducted in the páramo around Quito, Ecuador, to determine the rate of soil carbon loss from traditional fallow agriculture. In parallel, a land use and land cover classification of Landsat images was used to measure the change in agricultural areas between 1991 and 2017. There was a significant negative relationship between the time since initial cultivation of a field and soil C: Older agricultural sites had significantly less C compared to natural ecosystems due to an average loss of 0.045 percent soil C per year. Undisturbed sites had significantly more soil C than cultivated sites but not pastures or fallow fields, indicating that cultivation is the most detrimental stage of the fallow agricultural cycle for soil C storage. There was an 838 percent increase in cultivated land between 1991 and 2017 but a 10 percent decrease in pastures, indicating a trend away from traditional regenerative agriculture toward land use types that lead to substantial losses in soil carbon.
Introduction
Páramo ecosystems, a diverse set of high elevation vegetation types from the Northern Andes, offer a striking example of the disproportionate role that mountain ecosystems have in the provision of ecosystem services (Lazo et al. Citation2019). Páramo ecosystems account for less than 1 percent of the total land in Venezuela, Colombia, Peru, and Ecuador, yet millions of people from these countries depend on páramo ecosystems for the provision of water for human consumption and sanitation, and large portions of their economy rely on that same water supply for irrigation and generation of energy (International Union for Conservation of Nature Citation2002). However, though freshwater is arguably one of the most important benefits from the páramo, the ecosystem’s ability to provide such a service stems from its cool climate and the unique characteristic of its soils.
Páramo soils, which are known for their high C storage capacity, are generally classified into Andosols, Entisols, Inceptisols, and Histosols (Batjes Citation1996). The cool climate in this environment slows decomposition, leading to the accumulation of large amounts of soil organic matter. High carbon storage capacity is also partly due to the high Al concentrations that form stable Al complexes with soil organic matter and also offer protection from microbial activity stemming from Al toxicity and low pH (Tonneijck et al. Citation2010). As a result, reported soil C concentrations range between 239 MgC·ha−1 in well-drained upland soils and 2,100 MgC·ha−1 in páramo peatlands, making them some of the highest levels measured in mountain ecosystems (Hofstede, Segarra, and Mena Citation2003; Hribljan et al. Citation2015; Hribljan, Suarez, Heckman et al. Citation2016). These large concentrations of C in páramo soils explain the high levels of moisture (Farley, Kelly, and Hofstede Citation2004), high water retention capacity, and high hydraulic conductivity (Buytaert et al. Citation2006) that make them so important in the regulation and provisioning of water. Carbon storage is also clearly important in terms of climate change abatement because three times more C is stored in the soil than aboveground biomass and is a relatively stable carbon sink, especially in the deeper profile (Fontaine et al. Citation2007; Masciandaro et al. Citation2018).
Nevertheless, though soil integrity is vital for the maintenance of the health of páramo ecosystems and their ability to provide ecosystem services, it is threatened by land use change, especially by agriculture, which has been increasing across the region (Ross, Fildes, and Millington Citation2017). Agriculture has been shown to have negative effects on páramo soil by irreversibly changing soil properties and decreasing soil C stocks (Podwojewski et al. Citation2002; Farley et al. Citation2013), but the rate at which soil C is lost is poorly known. Traditional agricultural practices vary throughout the Andes, but farmers often follow a similar fallow-based system (Sarmiento, Monasterio, and Montilla Citation1993; Pestalozzi Citation2000). Fields are cultivated for several years, left fallow briefly, and then become pasture for livestock for nine to eleven years in order to restore soil fertility (Sarmiento, Monasterio, and Montilla Citation1993; Pestalozzi Citation2000; Sarmiento, Smith, and Monasterio Citation2002; Sarmiento et al. Citation2003). Each stage of the fallow agriculture system hosts different plant species and is subjected to very different management practices, so each stage can have varying effects on soil properties and should be considered separately when studying the effects of land use change.
Tillage during the cultivation stage, for example, has been shown to increase erosion and decrease infiltration rates in the páramo, which has negative effects on water regulation (Poulenard et al. Citation2001). Agriculture threatens the innate high C content, porous structure, and high hydraulic conductivity that prevent surface runoff and help direct water to subsurface catchments (Buytaert et al. Citation2006). Fallow periods after cultivation have a disproportionate share of water runoff and soil erosion from rainfall compared to other land uses, likely due to the lower soil organic matter (SOM) content found in these fields, which is important in moisture retention (Harden Citation1991, Citation1996). As for the effects of pastures, in puna ecosystems (dry grasslands similar to the páramo in central and southern South America) several studies have found little to no difference in soil organic carbon (SOC) stocks between pastures and natural sites (Zimmermann et al. Citation2010; Sylvester et al. Citation2017). However, Podwojewski et al. (Citation2002) found that pasture usage in páramo ecosystems decreases water provisioning services because of losses of soil macrostructure, the development of a water-repellent microstructure, and decreases in soil C. Thus, understanding the effects of each stage of the traditional agriculture system is important in order to determine the overall effects on soil functioning because one taken by itself may offer an incomplete picture.
Despite the potential importance of agricultural practices on C storage and dynamics, there is still little information about soil C storage in the region (Scharlemann et al. Citation2014) and the changes that this reservoir might be experiencing under current patterns of land use change. In this context, we studied the páramo landscape surrounding the city of Quito, Ecuador, as a case study to understand the patterns of land use change in the high Northern Andes and their impact on soil C storage. Specifically, in order to assess the current state of C storage under different land use regimes, we employed a chronosequence of agricultural sites to determine rates of soil C change. This was coupled with land use change modeling to ascertain how much natural páramo land has been converted over the last thirty years and what that implies in terms of soil C storage. We hypothesized that agricultural practices would lead to C losses and that we would see a small but steady loss of C over time. Furthermore, we hypothesized that land use conversion from natural to agricultural uses has increased over the last few decades translating to large soil C losses from the Ecuadorian páramo.
Materials and methods
Study area
Soils were sampled near Quito, Ecuador, between the regions of Antisana Ecological Reserve and Cayambe–Coca National Park (, Supplementary Materials 1). This study area is dominated by a matrix of tussock grasslands dominated by Calamagrostis intermedia and Festuca spp., interspersed with a layer of shrubs and forbs (e.g., Pentacalia, Diplostephium, Hypericum), and occasional patches of high-elevation forests (Polylepis spp. and Gynoxis spp.). Because most of our study area lies within a national park and ecological reserve, most of the páramo in and around our study area has been protected as it is the main source of water for Quito. Mean annual temperature in this area is 8.2°C with little seasonal variation, and mean precipitation recorded at 4,100 m reached 1,375 mm. Soils in this area are typical Andosols developed on volcanic ashes and with high contents of organic matter (Fehse et al., Citation2002).
Figure 1. Study area near Quito, Ecuador. White lines delineate areas above 3,500 m used in land use and land cover classification and subsequent C stock calculations. Black rectangles show sites of soil sampling. Rectangle S represents sampling site Sincholagua, A is sampling site Antisana, and P is sampling site Piedras Blancas. Map projection is WGS 1984/UTM 17 N.
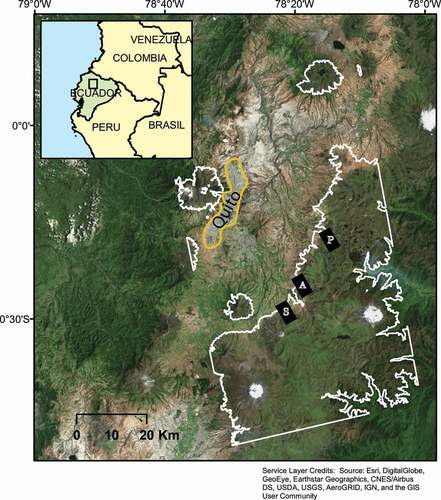
Agriculture in the area occurs mainly between 3,500 and 4,000 m a.s.l., so our sampling was limited to this lower range of the paramo, which extends from 3,500 to 5,000 m.a.s.l. We had 3 sampling areas with 9 to 12 plots at each area, for a total of 33 plots (, Supplementary Materials 2). A plot was defined as a single land unit uniformly and unequivocally covered by one of the land cover types defined for the study; either agriculture (i.e., crop), pasture, fallow, or natural vegetation (i.e., tussock grassland or tussock shrubland). Crop, pasture, and fallow sites are all considered agricultural uses because they are all part of the agricultural cycle practiced in this region. Natural vegetation categories represent the end points of a gradient from tussock grasslands clearly dominated by Calamagrostis intermedia to tussock shrublands in which the tussock grassland exhibits a prominent layer of shrubs. In the end, we only had two tussock grassland sites and seven tussock shrubland sites, so we decided to combine the two categories into one, hereby referred to as natural vegetation, because we did not expect significant differences between the types. For the purpose of this study, “natural” vegetation was defined as characteristic páramo vegetation that showed no sign of recent human intervention. Some of these areas, however, may have experienced burning and grazing or other management in the past. Farmers and landowners were asked about agricultural practices in the region and length of land use on the plots via informal interviews (Supplementary Materials 2). For recent human intervention estimates in the “natural,” nonmanaged sites, we relied on information from landowners who know about the history of the nearby natural sites as well as expert knowledge of the area and landscapes. We realize that in the past these sites may have been burned, grazed, or managed in some way, but by visually inspecting the plant communities in the site we determined that it had not happened recently.
Agricultural sites were all within 1 km of sites of natural vegetation used as controls to assure that there were no major differences in soil types or land structure. To control for possible differences in soil characteristics, paired sites (agricultural and natural) were selected within three distinct regions that are homogenous in their geologic origin had similar soil types throughout. The potential soil differences between regions were controlled for in later statistical analyses.
Informal discussions with landowners and workers from four different haciendas gave insight into agricultural cycles utilized in northeastern Ecuador. All haciendas maintained a crop–fallow–pasture rotation, with slight variations in the length of time of each period. Crops, almost exclusively varieties of potato (Solanum tuberosum) and fava beans (Vicia faba), are cultivated for two to three years before the area is harvested for the final time and then left fallow. The fallow field is left for a few months or up to a year. In the fallow period the field is often colonized by invasive species such as Rumex acetosella and Anthoxanthum odoratum and early successional species like Lachemilla orbiculata. After this, the field is planted with grasses, such as Lolium multiflorum and Poa annua, and continues to be enriched with species like Trifolium repens to create an improved pasture for livestock, often cows and sheep. The pasture is left for six to nine years to aid in soil fertility recovery before the cycle begins again. Owing to the almost exclusively steep slopes in the region, large machinery is not very common and much of the planting and harvesting is done with smaller machinery or by hand. Though the terrain is steep and subject to constant rain, terrace cropping is not practiced, soil erosion was evident in some sites.
Soil sampling
One deep soil core (0–5, 5–10, 10–20, 30–40, and 40–50 cm) was taken at the center of each plot with a 6.35-cm-diameter open-faced gouge auger for both carbon stocks and bulk density measurements. Páramo soils have a shallow O horizons (<5 cm), but this varies widely between sites, so this organic layer was removed before soil sampling to allow for a more equal comparison of soils between sites. Additionally, five shallow samples (0–5, 5–10 cm) were also taken with 5-cm-radius steel rings at the center of the plot and the four corners (10 m away from the center). Soil depth was measured at three to four locations on each plot and an average soil depth was calculated to calculate total C storage for the entire soil profile. Soil depth was measured using thin steel probe extensions that were hammered into the ground until the bedrock was hit.
Carbon analysis
Soil samples were dried in an oven at 60°C for four days and weighed for dry bulk density calculations (g·cm−3). Dried soils were then homogenized with a mortar and pestle until passed through a 2-mm sieve. Total soil C was determined via loss on ignition (LOI), which has been previously established to be as effective as measuring total C with an elemental analyzer because these soils have no carbonates (Tonneijck et al. Citation2010). Additionally, Hribljan, Suarez, Bourgeau-Chavez et al. (Citation2016) found a strong correlation (R2 = 0.989, p < 0.001) between LOI C content and total C measured with an elemental analyzer, indicating a similar relationship. This equation was developed by analyzing over 400 samples from our study region for total C with an elemental analyzer as well as estimating total C with LOI. We used the equation from Hribljan, Suarez, Heckman, et al. (Citation2016) to estimate soil C in our samples because it was specifically calibrated from soils from our study site.
Samples were ashed in muffler oven for 4 hours at 500°C to determine C lost on ignition. C stocks per area (MgC·ha−1) was calculated with the following equation:
where b is the sample bulk density, d is the depth of the sample, and C is the sample %C. Total C storage to the bedrock (MgC·ha−1) was calculated through a partial coring approach as suggested by Chimner et al. (Citation2014). First, we calculated the C storage for all soil depths individually. We then used the 30 to 50 cm means to estimate storage C for the layer between 20 cm and the mean soil depth for each site, which was, on average, 2.5 m. Based on previous work in the páramo in our study area, we have found that most changes in soil C in páramo soils are primarily restricted to the shallower depths (<20 cm), with little change in the deeper depths. We decided to average the deeper layers (20–50 cm) and extrapolate to the soil depth for that reason because we had fewer data points from the deeper depths. Finally, we added these four C storage values (0–5-, 5–10-, 10–20-, and 20-cm mean soil depth) to estimate total soil carbon storage for each core. Several sites only had soil samples taken from 0 to 10 cm rather than 0 to 5 and 5 to 10 cm, so these samples were excluded from the bulk density and C stock analysis because they were not comparable.
Because soils in the region are very dense, sampling with the open-face auger could alter bulk density, thus affecting C calculations. In order to assess this possibility, we compared bulk density values obtained with the auger and with steel rings in the same plots and across different land uses and found no differences (paired t test, t = −0.558, df = 92, p = 0.578) between the two bulk density methods (ring versus soil auger).
Statistical analysis
We determined the rate of C loss due to agriculture with linear regression comparing site %C to the total time of land use. Differences in %C, C stocks, and bulk density between land use types and soil depth were analyzed using linear mixed effect models with the packages “lme4” and “lmerTest” in R (version 3.5.1, R Core Team Citation2020). Land use and depth were set as fixed effects and region and elevation as random effects to account for spatial heterogeneity within the study area. Further analyses of differences were measured with Tukey’s post hoc tests. All data were analyzed using R statistical software.
Land use and land cover change analysis
Landsat TM (Thematic Mapper), ETM+ (Enhanced Thematic Mapper), and OLI (Operational Land Imager) images were used as data source for land use and land cover (LULC) analysis. Images from 1991, 2002, and 2017 (path 10, row 60) were selected because they were mostly cloud free and showed decadal changes in agricultural use (Supplementary Materials 4). Previously atmospherically corrected images were downloaded from the United States Geological Survey (USGS) Earth Explorer.
Maximum likelihood supervised classification was performed on all images to determine land cover of tussock shrubland, tussock grassland, bare soil, ice, developed/urban, crops, and pasture. Fallow sites were not classified because they are very heterogeneous and could easily be misclassified as bare soil or pasture. Approximately thirty training areas, with a minimum of 50 to 100 pixels each, were created per land cover type based on ground control points and expert image analysis. Masks combining any clouds in the region as well as areas lower than 3,500 m were used to clip unwanted pixels from the analysis. Peatlands are also an important ecosystem in the páramo but are only mappable with radar data (Hribljan, Suarez, Bourgeau-Chavez et al. Citation2016), so we excluded them from our classification. Instead, because peatland areas expand on a very slow scale and we would expect little change within twenty-six years, previously mapped peatlands (Hribljan, Suarez, Bourgeau-Chavez et al. Citation2016) were merged onto our classifications in order to provide a final, more accurate ecosystem map.
Accuracy of the classifications was carried out with a confusion matrix. Approximately fifty randomly selected accuracy points per class were used to determine classification accuracy. Points were validated for accuracy based on ground truthing and expert image analysis of high-resolution images. All classification and accuracy assessments were carried out using ENVI software version 4.4 (Citation2018).
Classifications were imported into ArcGIS v.10.4 (ESRI Citation2002) for analysis. Areas with clouds were occasionally misclassified as urban areas due to a similar reflectance and hence were reclassified. We computed total area per land cover use with and without the area covered by clouds. Additionally, we created a transition pathway matrix in order to determine the quantity of natural tussock grassland or shrubland that had been converted into a modified land use.
Results
Carbon analysis
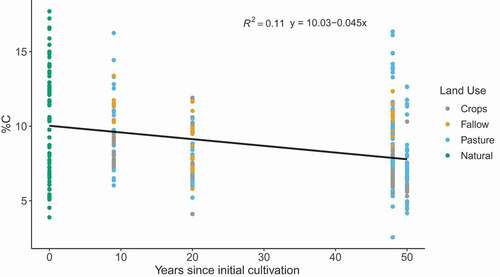
Total C storage for the full soil profile varied between 239 and 2,778 MgC·ha−1 (Supplementary Materials 2) with a mean of 1,418 MgC·ha−1 averaged across all land uses. As expected, %C significantly decreased with soil profile depth (F = 44.81, df = 4, p < 0.0001; ). There were also significant differences in %C between land use types (F = 4.67, df = 3, p = 0.008; ). Natural plots had the highest %C (12.71 ± 0.68 percent), but only between 0 and 10 cm. Beyond this depth, the %C was similar among land use types. Cultivated plots had lower %C than all other land covers (p = 0.002; Supplementary Materials 3). There was a significant negative relationship between time since initial cultivation of a plot and %C across all depths (R2 = 0.11, p < 0.001; ). This indicates an absolute loss of 0.045 percent C per year due to agricultural use or a 28 percent decrease in soil C over fifty years. There was a significant negative relationship between soil C and site use age in both the 0 to 5 and 5 to 10 cm depths (R2 = 0.1, p < 0.001, y = 11.3 − 0.056x and R2 = 0.23, p < 0.001, y = 9.97 − 0.049x, respectively), whereas there was no significant patterns in the lower depths: 10 to 20 cm (p = 0.26, Supplementary Materials 3), 30 to 40 cm (p = 0.80), and 40 to 50 cm (p = 0.38).
Figure 2. Average soil C content for each land use type and soil profile depth. Error bars represent ±1 SE.
Figure 3. Relationship between time since initial cultivation and soil %C for all land use types.
Bulk density significantly increased with soil depth (F = 45.14, df = 4, p < 0.001), but the extent to which it increased varied among land uses (F = 4.18, df = 3, p = 0.01; ). Overall, natural sites had lower bulk density than the other land uses, including crops (p = 0.03, Supplementary Materials 3) and fallow (p = 0.02) but not pasture sites (p = 0.21). Carbon stocks (MgC·ha−1) were significantly affected by depth (F = 189.49, df = 4, p < 0.001; ); however, there were also significant differences between land uses (F = 12.04, df = 3, p < 0.001). Crop sites had lower C stocks than fallow (p = 0.001, Supplementary Materials 3), pasture (p = 0.005), and natural (p = 0.03) sites, but C stocks were equal between natural and fallow (p = 0.07) and natural and pasture (p = 0.99) sites.
Figure 4. Average bulk density and C stocks for each land use type and soil profile depth. Error bars represent ±1 SE.
Land use and land cover change analysis
The land use classification was approximately 84 percent accurate with a kappa value of 0.81 () and covered 271,545 ha. For all years, natural páramo comprised the majority of the study area, with tussock grasslands being the primary land cover (, ). As for modified land, crops or pasture were generally more common than developed land given that urban developments are rare at such elevations. Bare soil was categorized into a natural land cover because it is mainly due to lava flows around volcano tops. Bare soil increased sharply in 2002, but this was determined to be the result of a large fire in the region rather than changes in land use (Argüello Citation2014).
Table 1. Confusion matrix of land use classification accuracy assessment
Table 2. Percentage of study area in each LULC category in 1991, 2002, and 2017
Figure 5. Land cover and land use classification of páramo surrounding Quito, Ecuador, in 1991, 2002, and 2017.
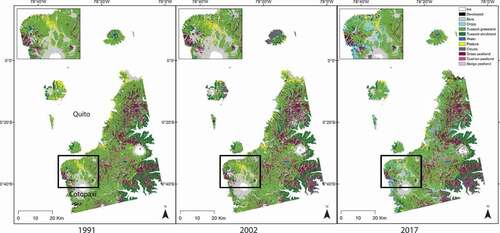
Between 1991 and 2017, agricultural areas (pastures and cultivated fields) increased from 4.45 percent of the study area in 1991 to 11.32 percent in 2017, especially around the areas closest to Quito as well as to the west of the Cotopaxi volcano. Land used for cultivation increased from approximately 0.86 percent of the total study area to 8.09 percent of the total study area around Quito. This equates to an increase in agricultural land use of 838 percent over twenty-six years. However, we found an overall 10 percent decrease in pastures. The land use transition analysis () indicated that between 1991 and 2017, 12.58 percent of originally tussock grassland was converted to agricultural use, as was 5.8 percent of tussock shrublands, signifying a 19,978-ha loss of natural páramo landscape. The conversion of areas to pastures was similarly paced across time periods, whereas land for crops was converted slowly between 1991 and 2002 but increased quickly between 2002 and 2017.
Table 3. Transition pathways from natural vegetation types to agricultural uses
Discussion
Total C storage was high with an average of 561 MgC·ha−1 up to 1 m depths. This is high compared to other mountainous ecosystems such as the Spanish Pyrenees (59–299 MgC·ha−1), the Rocky Mountains (40–220 MgC·ha−1), or the Scottish Highlands (115–498 MgC·ha−1; Ward et al. Citation2014). Other, non-peatland, páramos in Ecuador have similar C stocks; Tonneijck et al. (Citation2010) reported 530 MgC·ha−1 in northern Ecuador. In Colombian páramos, reported C levels vary from 239 to 479 MgC·ha−1 and up to 530 in Venezuelan páramos (Hofstede, Segarra, and Mena Citation2003), indicating that the soils in our study sites have extremely high C holding capabilities. Our study also demonstrates that Andean agriculture in northern Ecuador is leading to steady losses of soil C, thus affecting dependent ecosystem services including global climate regulation (Masciandaro et al. Citation2018), water regulation (Farley, Kelly, and Hofstede Citation2004; Buytaert et al. Citation2006), nutrient regulation (Milne et al. Citation2015), food provisioning (Lal Citation2004), and erosion regulation (Pinheiro, Pereira, and Anjos Citation2004).
Carbon losses over time
By utilizing a chronosequence study with sites of different ages, we determined that a transition from the natural páramo vegetation to the crop–fallow–pasture agricultural system led to an average absolute decrease of 0.045 percent in soil C per year. Though there are no other studies in the páramo estimating rates of C loss, others have measured significant decreases in soil C from Andean agriculture. Farley et al. (Citation2013) found the lowest soil C levels in sites previously used for agriculture rather than pastures or pine plantations. Podwojewski et al. (Citation2002) found that overgrazing severely decreased soil C stocks of natural páramo. However, findings from studies looking at soil carbon responses to traditional Andean agriculture have been mixed. Both Abreu, Llambí, and Sarmiento (Citation2009) and Henry et al. (Citation2013) did not find noticeable carbon losses due to cultivation, but it was suspected that significant C was lost due to erosion. Such varied findings could be due to the fact that páramo soils are very heterogenous, and even significant losses of soil C might be masked by the extremely large pool of carbon stored in deep páramo soils and could be difficult to detect without extensive sampling (Abreu, Llambí, and Sarmiento Citation2009). Nevertheless, soil heterogeneity is difficult to overcome even with extensive sampling, as shown by the low, yet significant, R2 value of the relationship between time since initial cultivation and soil C found in this study.
We found little difference in soil C between pasture and natural páramo sites. Natural sites had a higher %C content in the 0 to 10 cm depth, but in terms of C stocks, natural and pasture sites were similar. This was attributed to the higher bulk density in pastures due to soil compaction from livestock. Pastures have also been found to be relatively good at retaining soil C in comparison to potato fields because the extensive plant cover in pastures prevents soil erosion compared to cultivated fields (Otero et al. Citation2011). One study found that pastures may have SOC stocks similar to those of natural sites because of higher levels of soil weathering in pastures, which helps form organo-mineral complexes that stabilize high SOM levels even though pastures have lower plant cover than natural páramos (Heitkamp et al. Citation2014). Nevertheless, though C stocks may be similar between natural sites and pastures, other ESS, like water regulation, may still be negatively impacted by changes in soil structure and soil water retention found after extensive grazing (Podwojewski et al. Citation2002).
Fallow sites were similar to cultivated sites in terms of bulk density but had higher C levels indicating soil restoration during these agricultural rest periods. Fallow–pasture periods in highland Bolivia have been shown to completely recover soil fertility (in terms of C, N, and P) within nine to twenty-one years of fallow age (Pestalozzi Citation2000; Sarmiento and Bottner Citation2002) and others have found little to no difference in soil C content between grazed and natural puna grasslands (Gibbon et al. Citation2010; Zimmermann et al. Citation2010; Heitkamp et al. Citation2014). This indicates that longer fallow periods as practiced in traditional Andean agriculture may help counter some C loss caused by cultivation and should be retained as a good conservation practice. In comparison, fallow–pasture periods at our sites averaged six to nine years in length, several years shorter than the traditional cycle length. This more intensive system is likely driving the long-term decrease in soil C. Nevertheless, soil C loss seems to be primarily constrained to the upper layers of soil (0–20 cm) and the carbon deeper in the profile appears to be well protected, which may provide resilience to the páramo’s ability to store soil C.
Land use and land cover change
With our LULC analysis of the region, we were able to determine the extent of agricultural expansion around the Quito metropolitan area and its effects on C storage over the last twenty-six years. The classification had an overall 84 percent accuracy, with tussock shrublands and grasslands being the land cover classes predicted less accurately by the classification, in terms of producer’s accuracy. Though dominated by shrubs and scattered trees, tussock shrublands are also covered in tussock grasses, indicating that the reflective signature is heterogeneous between the two and will require more sampling in the future for more accurate mapping. Areas used for cultivation increased by 838 percent, or 18,511 ha, over twenty-six years, especially in the areas already close to developed zones. This expansion is not surprising because 75 percent of Ecuadorian tussock grasslands have already been converted to other land uses (Hofstede et al. Citation2002).
We found cropland expansion primarily in the páramo to the southeast of Quito and to the west of the Cotopaxi volcano. Growth in these areas is likely due to the proximity of already established urban areas and infrastructure as deforestation and land cover change is often associated with roads (Chomitz and Gray Citation1996; Nelson and Hellerstein Citation1997). A large highway, part of the Pan-American highway, already exists in this area and passes through the buffer zone of Cotopaxi National Park, making encroachment in the region easier. New urban development since 2003 has moved east of Quito and almost all land designated suitable for further development in Quito belongs to the eastern side as well (United Nations Environment Programme [UNEP] Citation2011), indicating that agricultural expansion is likely trailing urban expansion.
Pastures, in comparison to cultivated fields, experienced a 10 percent decrease in area in twenty-six years. This was unexpected given the traditionally tightly linked cycle between crops, pastures, and fallow period. Pasture usage is not increasing at the same rate as crop land, which may reflect changing agricultural practices in the region. Crissman, Antle, and Capalbo (Citation1998) found that intensive input use in the páramo of northern Ecuador shortened the length of time required to restore soil fertility and thus the number of years that land must be left as pasture. Ecuador’s agricultural policies may also explain the decreasing pasture land. The land reform of 1954 reallocated unused arable land to people who promised to develop or cultivate it (Ross, Fildes, and Millington Citation2017). The average reallocated plots size was only 4.8 ha, whereas livestock require very large tracts of land (Ross, Fildes, and Millington Citation2017). Thus, this reallocation was found to decrease pasture size and in general promote cultivation of crops over livestock (Gondard Citation1988).
Future agricultural expansion is likely because Quito is growing rapidly. Between 1950 and 2010 the population increased sevenfold and it is expected to continue increasing (UNEP Citation2011). Agriculture is also an important job sector for the country (Egáz Yerovi Citation2014), signifying a possible increase in agriculture-related jobs. We found a much higher rate of agriculture expansion between 2002 and 2017 than between 1991 and 2002, suggesting that high rates of encroachment could continue into the future as well. This effect of a growing population on the páramo may also be exacerbated by climate change because a warming climate means that alpine ecosystems are moving upwards (Pauli, Gottfried, and Grabherr Citation1996, Citation2003; Kelly and Goulden Citation2008). It was predicted that temperatures in the páramo will rise and precipitation levels will fall (Ruiz, Martinson, and Vergara Citation2012), making land that was previously inhospitable now available for development. In conjunction, climate change also threatens C storage because elevated temperatures will lead to a stimulation of soil microbes (Heimann and Reichstein Citation2008), leading to a net decrease in SOC (Buytaert, Cuesta-Camacho, and Tobón Citation2011; UNEP Citation2011), which will further exacerbate any climate change effects.
Though we found clear signals of C loss in our study sites, likely due to lower belowground inputs from crops compared to natural vegetation and exposed soil that can lead to warming and SOM decomposition, these results may only provide conservative estimates of C losses because we did not measure C losses due to soil erosion. Soil erosion was very evident at many of our sites, because the highly sloped sites facilitate soil loss when plant cover is low. Whether or not soil erosion is an ultimate C sink or source is highly contested (Jacinthe and Lal Citation2001; Lal Citation2005; Van Oost et al. Citation2007), but we argue that in our system, soil erosion is likely a C source. Crop cultivation leads to large amounts of bare soil in our sites, which, upon exposure to the elements, can lead to soil drying, which irreversibly affects Andosol structure (Buytaert et al. Citation2002). Moreover, there are several heavy rainfall events each season that can wash away bare soil in cultivated or fallow fields on steep slopes, washing the soil to lower elevations. Thus, it is possible that C losses from erosion may be a significant source of C emissions in the páramo, but there is little to no research currently available. Future studies looking at the rates of C loss due to agricultural erosion in the region, from either wind or rainfall, would help provide a more accurate estimate of the changing C budget in the region.
Conclusion
The cultivation of crops has detrimental effects on C stocks in the Ecuadorian páramo. This study has provided the first estimate of C loss due to agricultural practices in the highlands of Ecuador and can be a starting point for more effective páramo conservation efforts in the region by determining the regions at most risk for further land use change. Land use change has increased rapidly in the last decade and is also likely to be accelerated by climate change, indicating even more potential C loss, which will negatively affect both regional and global ecosystem services. However, because agriculture is such an important livelihood for a large part of the Ecuadorian population, local management must consider ecosystem-based adaptation measures to help support communities. Further studies looking at the efficacy of agricultural methods that reduce soil and C loss, such as traditional longer fallow and pasture periods, should be explored as possible alternatives to prevent further soil C loss.
Supplemental Material
Download Zip (4.9 MB)Acknowledgments
Publication made possible in part by support from the Berkeley Research Impact Initiative (BRII) sponsored by the UC Berkeley Library. We thank the Freshwater Ecology lab at USFQ for the field and laboratory space and equipment. We also thank Shahar Amitay and Valerie Dong for their help in the field and laboratory and Timothy Bowles for helpful comments. We also extend our gratitude to the U.S. Forest Service and Sustainable Wetlands Adaptation and Mitigation Program for use of the peatland data and maps. Finally, we are thankful for the anonymous reviewers for their comments on the article.
Disclosure statement
No potential conflict of interest was reported by the authors.
Supplementary material
Supplemental material for this article can be accessed on the publisher’s website.
Additional information
Funding
References
- Abreu, Z., L. D. Llambí, and L. Sarmiento. 2009. Sensitivity of soil restoration indicators during páramo succession in the high tropical Andes: Chronosequence and permanent plot approaches. Restoration Ecology 17 (5):619–27. doi:https://doi.org/10.1111/j.1526-100X.2008.00406.x.
- ArcGIS. 2002. Computer software. Redlands, CA: ESRI.
- Argüello, E. 2014. Plan preventido de quemas de pajonales en los paramos de las comunidades beneficiaras del PRRA en la zona de Papallacta. Quito, Ecuador: CARE.
- Batjes, N. H. 1996. Total carbon and nitrogen in the soils of the world. European Journal of Soil Science 47 (2):151–63. doi:https://doi.org/10.1111/j.1365-2389.1996.tb01386.x.
- Buytaert, W., F. Cuesta-Camacho, and C. Tobón. 2011. Potential impacts of climate change on the environmental services of humid tropical alpine regions. Global Ecology and Biogeography 20 (1):19–33. doi:https://doi.org/10.1111/j.1466-8238.2010.00585.x.
- Buytaert, W., J. Deckers, G. Dercon, B. De Bièvre, J. Poesen, and G. Govers. 2002. Impact of land use changes on the hydrological properties of volcanic ash soils in South Ecuador. Soil Use and Management 18:94–100. doi:https://doi.org/10.1111/j.1475-2743.2002.tb00226.x.
- Buytaert, W., R. Célleri, B. De Bièvre, F. Cisneros, G. Wyseure, J. Deckers, and R. Hofstede. 2006. Human impact on the hydrology of the Andean páramos. Earth-Science Reviews 79 (1–2):53–72. doi:https://doi.org/10.1016/j.earscirev.2006.06.002.
- Chimner, R. A., C. A. Ott, C. H. Perry, and R. K. Kolka. 2014. Developing and evaluating rapid field methods to estimate peat carbon. Wetlands 34:1241–46. doi:https://doi.org/10.1007/s13157-014-0574-6.
- Chomitz, K., and D. Gray. 1996. Roads, land use and deforestation: A spatial model applied to Belize. World Bank Economic Review 10 (3):487–512. doi:https://doi.org/10.1093/wber/10.3.487.
- Crissman, C. C., J. M. Antle, and S. M. Capalbo. 1998. Economic, environmental, and health tradeoffs in agriculture: Pesticides and the sustainability of Andean potato production. Norwell, MA: International Potato Center.
- Egáz Yerovi, J. J. 2014. Addressing pro-poor agricultural policies in Ecuador: Case study of smallholders in the provinces of Imbabura and Carchi. Master’s thesis, Universiteit Gent, Universiteitsbibliotheek Gent.
- ENVI. 2018. Computer software. Boulder, CO: Harris Geospatial Solutions.
- Farley, K. A., E. F. Kelly, and R. G. M. Hofstede. 2004. Soil organic carbon and water retention after conversion of grasslands to pine plantations in the Ecuadorian Andes. Ecosystems 7 (7):729–39. doi:https://doi.org/10.1007/s10021-004-0047-5.
- Farley, K. A., L. L. Bremer, C. P. Harden, and J. Hartsig. 2013. Changes in carbon storage under alternative land uses in biodiverse Andean grasslands: Implications for payment for ecosystem services. Conservation Letters 6 (1):21–27. doi:https://doi.org/10.1111/j.1755-263X.2012.00267.x.
- Fehse, J., R. Hofstede, N. Aguirre, C. Paladines, A. Kooijman, and J. Sevink. 2002. High altitude tropical secondary forests: a competitive carbon sink? Forest Ecology and Management 163 (1–3):9–25. doi:https://doi.org/10.1016/S0378-1127(01)00535-7.
- Fontaine, S., S. Barot, P. Barré, N. Bdioui, B. Mary, and C. Rumpel. 2007. Stability of organic carbon in deep soil layers controlled by fresh carbon supply. Nature 450 (7167):277–80. doi:https://doi.org/10.1038/nature06275.
- Gibbon, A., M. R. Silman, Y. Malhi, J. B. Fisher, P. Meir, M. Zimmermann, G. C. Dargie, et al. 2010. Ecosystem carbon storage across the grassland–forest transition in the high Andes of Manu National Park, Peru. Ecosystems 13 (7):1097–111. doi:https://doi.org/10.1007/s10021-010-9376-8.
- Gondard, P. 1988. Land use in the Andean region of Ecuador: From inventory to analysis. Land Use Policy 5:341–48. doi:https://doi.org/10.1016/0264-8377(88)90040-3.
- Harden, C. P. 1991. Andean soil erosion. Research & Exploration 7 (2):216.
- Harden, C. P. 1996. Interrelationships between land abandonment and land degradation: A case from the Ecuadorian Andes. Mountain Research and Development 16:274–80. doi:https://doi.org/10.2307/3673950.
- Heimann, M., and M. Reichstein. 2008. Terrestrial ecosystem carbon dynamics and climate feedbacks. Nature 451 (7176):289–92. doi:https://doi.org/10.1038/nature06591.
- Heitkamp, F., S. P. Sylvester, M. Kessler, M. D. Sylvester, and H. F. Jungkunst. 2014. Inaccessible Andean sites reveal human-induced weathering in grazed soils. Progress in Physical Geography 38 (5):576–601. doi:https://doi.org/10.1177/0309133314544918.
- Henry, A., L. Mabit, R. E. Jaramillo, Y. Cartagena, and J. P. Lynch. 2013. Land use effects on erosion and carbon storage of the Rio Chimbo watershed, Ecuador. Plant and Soil 367 (1–2):477–91. doi:https://doi.org/10.1007/s11104-012-1478-y.
- Hofstede, R., P. Segarra, and P. Mena. 2003. Los Páramos del Mundo. Quito, Ecuador: Proyecto Atlas Mundial de los Páramos.
- Hofstede, R., R. Coppus, P. Mena Vásconez, P. Segarra, J. Wolf, and J. Sevink. 2002. The conservation status of Tussock Grass Paramo in Ecuador. Ecotropicos 15 (1):3–18.
- Hribljan, J. A., D. J. Cooper, J. Sueltenfuss, E. C. Wolf, K. A. Heckman, E. A. Lilleskov, and R. A. Chimner. 2015. Carbon storage and long-term rate of accumulation in high-altitude Andean peatlands of Bolivia. Mires and Peat 15 (12):1–14.
- Hribljan, J. A., E. Suarez, K. A. Heckman, E. A. Lilleskov, and R. A. Chimner. 2016. Peatland carbon stocks and accumulation rates in the Ecuadorian paramo. Wetlands Ecology and Management 24 (2):113–27. doi:https://doi.org/10.1007/s11273-016-9482-2.
- Hribljan, J. A., E. Suarez, L. Bourgeau-Chavez, S. Endres, E. A. Lilleskov, S. Chimbolema, C. Wayson, et al. 2016. Multi-date, multi-sensor remote sensing reveals high density of carbon-rich mountain peatlands in the páramo of Ecuador. Global Change Biology 23 (12):5412–25. doi:https://doi.org/10.1111/gcb.13807.
- International Union for Conservation of Nature. 2002. High Andean wetlands. Technical report, International Union for Conservation of Nature, Gland, Switzerland.
- Jacinthe, P. A., and R. Lal. 2001. A mass balance approach to assess carbon dioxide evolution during erosional events. Land Degradation & Development 12 (4):329–39. doi:https://doi.org/10.1002/ldr.454.
- Kelly, A. E., and M. L. Goulden. 2008. Rapid shifts in plant distribution with recent climate change. Proceedings of the National Academy of Sciences 105 (33):11823–26. doi:https://doi.org/10.1073/pnas.0802891105.
- Lal, R. 2004. Soil carbon sequestration impacts on global climate change and food security. Science 304 (5677):1623–27. doi:https://doi.org/10.1126/science.1097396.
- Lal, R. 2005. Soil erosion and carbon dynamics. Soil and Tillage Research 81 (2):137–42. doi:https://doi.org/10.1016/j.still.2004.09.002.
- Lazo, P. X., G. M. Mosquera, J. J. McDonnell, and P. Crespo. 2019. The role of vegetation, soils, and precipitation on water storage and hydrological services in Andean Páramo catchments. Journal of Hydrology 572:805–19. doi:https://doi.org/10.1016/j.jhydrol.2019.03.050.
- Masciandaro, G., C. Macci, E. Peruzzi, and S. Doni. 2018. Soil carbon in the world: Ecosystem services linked to soil carbon in forest and agricultural soils. In The future of soil carbon, 1–38. Cambridge, MA: Academic Press.
- Milne, E., S. A. Banwart, E. Noellemeyer, D. J. Abson, C. Ballabio, F. Bampa, A. Bationo, et al. 2015. Soil carbon, multiple benefits. Environmental Development 13:33–38. doi:https://doi.org/10.1016/j.envdev.2014.11.005.
- Nelson, G. C., and D. Hellerstein. 1997. Do roads cause deforestation? Using satellite images in econometric analysis of land use. American Journal of Agricultural Economics 79 (1):80–88. doi:https://doi.org/10.2307/1243944.
- Otero, J. D., A. Figueroa, F. A. Muñoz, and M. R. Peña. 2011. Loss of soil and nutrients by surface runoff in two agro-ecosystems within an Andean paramo area. Ecological Engineering 37 (12):2035–43. doi:https://doi.org/10.1016/j.ecoleng.2011.08.001.
- Pauli, H., M. Gottfried, and G. Grabherr. 1996. Effects of climate change on mountain ecosystems–upward shifting of alpine plants. World Resource Review 8 (3):382–90.
- Pauli, H., M. Gottfried, and G. Grabherr. 2003. Effects of climate change on the alpine and nival vegetation of the Alps. Journal of Mountain Ecology 7:9–12.
- Pestalozzi, H. 2000. Sectoral fallow systems and the management of soil fertility: The rationality of indigenous knowledge in the high Andes of Bolivia. Mountain Research and Development 20 (1):64–71. doi:https://doi.org/10.1659/0276-4741(2000)020[0064:SFSATM]2.0.CO;2.
- Pinheiro, E. F. M., M. G. Pereira, and L. H. C. Anjos. 2004. Aggregate distribution and soil organic matter under different tillage systems for vegetable crops in a Red Latosol from Brazil. Soil and Tillage Research 77 (1):79–84. doi:https://doi.org/10.1016/j.still.2003.11.005.
- Podwojewski, P., J. Poulenard, T. Zambrana, and R. Hofstede. 2002. Overgrazing effects on vegetation cover and properties of volcanic ash soil in the páramo of Llangahua and La Esperanza (Tungurahua, Ecuador). Soil Use and Management 18 (1):45–55. doi:https://doi.org/10.1079/SUM2002100.
- Poulenard, J., P. Podwojewski, J. L. Janeau, and J. Collinet. 2001. Runoff and soil erosion under rainfall simulation of Andisols from the Ecuadorian Páramo: Effect of tillage and burning. Catena 45 (3):185–207. doi:https://doi.org/10.1016/S0341-8162(01)00148-5.
- R Core Team. 2020. R: A language and environment for statistical computing. R Foundation for Statistical Computing, Vienna, Austria. https://www.R-project.org/
- Ross, C., S. Fildes, and A. Millington. 2017. Land‐use and land‐cover change in the Páramo of South‐Central Ecuador, 1979–2014. Land 6 (3):46. doi:https://doi.org/10.3390/land6030046.
- Ruiz, D., D. G. Martinson, and W. Vergara. 2012. Trends, stability and stress in the Colombian Central Andes. Climatic Change 112 (3–4):717–32. doi:https://doi.org/10.1007/s10584-011-0228-0.
- Sarmiento, L., J. K. Smith, and M. Monasterio. 2002. Balancing conservation of biodiversity and economical profit in the high Venezuelan Andes: Is fallow agriculture an alternative? In Mountain biodiversity - A global assessment, ed. C. Korner and E. Spehn, 283–93. London: Taylor & Francis.
- Sarmiento, L., L. Llambí, A. Escalona, and N. Marquez. 2003. Vegetation patterns, regeneration rates and divergence in an old-field succession of the high tropical Andes. Plant Ecology 166 (1):63–74. doi:https://doi.org/10.1023/A:1023262724696.
- Sarmiento, L., M. Monasterio, and M. Montilla. 1993. Ecological bases, sustainability, and current trends in traditional agriculture in the Venezuelan high Andes. Mountain Research and Development 13 (2):167–76. doi:https://doi.org/10.2307/3673634.
- Sarmiento, L., and P. Bottner. 2002. Carbon and nitrogen dynamics in two soils with different fallow times in the high tropical Andes: Indications for fertility restoration. Applied Soil Ecology 19 (1):79–89. doi:https://doi.org/10.1016/S0929-1393(01)00178-0.
- Scharlemann, J. P., E. V. Tanner, R. Hiederer, and V. Kapos. 2014. Global soil carbon: Understanding and managing the largest terrestrial carbon pool. Carbon Management 5 (1):81–91. doi:https://doi.org/10.4155/cmt.13.77.
- Sylvester, S. P., F. Heitkamp, M. D. Sylvester, H. F. Jungkunst, H. J. Sipman, J. M. Toivonen, C. A. Gonzales Inca, et al. 2017. Relict high-Andean ecosystems challenge our concepts of naturalness and human impact. Scientific Reports 7 (1):1–13. doi:https://doi.org/10.1038/s41598-017-03500-7.
- Tonneijck, F. H., B. Jansen, K. G. J. Nierop, J. M. Verstraten, J. Sevink, and L. De Lange. 2010. Towards understanding of carbon stocks and stabilization in volcanic ash soils in natural Andean ecosystems of northern Ecuador. European Journal of Soil Science 61 (3):392–405. doi:https://doi.org/10.1111/j.1365-2389.2010.01241.x.
- United Nations Environment Programme. 2011. Environment Climate Change Outlook, Metropolitan District of Quito. Quito, Ecuador: Metropolitan District of Quito.
- van Oost, K., T. A. Quine, G. Govers, S. De Gryze, J. Six, J. W. Harden, J. C. Ritchie, et al. 2007. The impact of agricultural soil erosion on the global carbon cycle. Science 318 (5850):626–29. doi:https://doi.org/10.1126/science.1145724.
- Ward, A., P. Dargusch, S. Thomas, Y. Liu, and E. A. Fulton. 2014. A global estimate of carbon stored in the world’s mountain grasslands and shrublands, and the implications for climate policy. Global Environmental Change 28:14–24. doi:https://doi.org/10.1016/j.gloenvcha.2014.05.008.
- Zimmermann, M., P. Meir, M. R. Silman, A. Fedders, A. Gibbon, Y. Malhi, D. H. Urrego, et al. 2010. No differences in soil carbon stocks across the tree line in the Peruvian Andes. Ecosystems 13 (1):62–74. doi:https://doi.org/10.1007/s10021-009-9300-2.