
ABSTRACT
Over the last century in the circumpolar north, notable terrestrial ecosystem changes include shrub expansion and an intensifying wildfire regime. Shrub invasion into tundra may be further accelerated by wildfire disturbance, which creates opportunities for establishment where recruitment is otherwise rare. The Seward Peninsula currently experiences more frequent and larger fires than other tundra regions in Alaska. There are areas of overlapping burn scars dating back to the 1950s. Using a chronosequence approach, we examined vegetation and ecosystem dynamics in tussock tundra. Increasing burn severity and fire frequency corresponded with an increase in grass cover and a decrease in shrub basal area. We used multivariate ordination analysis to create a single integrator variable of fire effect that accounted for time after fire, burn severity, and number of times burned. This fire effect was significantly associated with decreases in soil organic layer thickness and overall plant biomass. Unlike previous studies in Arctic Alaska tundra, we found that increases in fire frequency and severity did not increase shrub cover and biomass. Instead, intensifying fire disturbance, and particularly repeat fires, led to grass dominance. Our findings support the hypothesis that intensifying tundra fire regimes initiate alternative post-fire trajectories that are not shrub dominated and that are structurally and functionally quite different from sedge or shrub-dominated tundra.
Introduction
Climate change is affecting disturbance regimes in many regions of the world (Dale et al. Citation2001; Turner Citation2010). In high-latitude systems, a large body of research focuses on climate-induced changes in the fire regime of the boreal forest (e.g., Bergeron and Flannigan Citation1995; Soja et al. Citation2006; Chapin et al. Citation2010). In arctic tundra, however, wildfire has been less frequent or has occurred in remote localities where small short-lived fires or their fire scars were not observed and are therefore not part of the historical record (D. A. Walker and Walker Citation1991). The warming the Arctic has experienced over the last fifty years (Hinzman et al. Citation2005) is significant and coincident with an increase in the frequency and severity of wildfire (French et al. Citation2015; Masrur, Pretrov, and De Groote Citation2018). For example, the recent 2007 Anaktuvuk River fire was the largest and longest-burning wildfire known to occur on the North Slope of Alaska (Jones et al. Citation2015) in recorded history. Not only did the majority of the fire burn with moderate to high severity (Jones et al. Citation2009) but there also was no evidence of fire at this site for at least the previous 5,000 years (Hu et al. Citation2010; Chipman et al. Citation2015). Even when rare, tundra fires play an important role in releasing the carbon stored in tundra vegetation and soils to the atmosphere (Mack et al. Citation2011). Due to large carbon stores in tundra soils and their vulnerability to burning, increasing carbon emissions from tundra fires are predicted to feedback positively to climate warming (Genet et al. Citation2017).
Climate change is likewise expected to increase the extent and frequency of wildfire throughout Alaska (Melvin et al. [Citation2017] and references within). The recent trend toward an increase in tundra fire frequency corresponds to high growing season temperature and low precipitation from 1979 to 2009 (Hu et al. Citation2010; Moritz et al. Citation2012). For example, across Alaska, when mean July temperatures exceed a threshold of 13.4°C and annual moisture availability falls short of 150 mm, there is a greater likelihood of fire occurrence (Young et al. Citation2017). In response to projected increases in temperature, modeling results show an increase in tundra area burning for northwestern and northern Arctic Alaska over the next century (Rupp et al. Citation2016), largely due to the positive effect of lower fuel moisture content on ignition and spread potential.
Over the last century, circumpolar changes in vegetation have included the expansion of shrubs and northward shifts of latitudinal treeline (Lloyd et al. Citation2003; Tape, Sturm, and Racine Citation2006; Myers-Smith, Hik, and Aerts Citation2017). The invasion into tundra by woody plants may be further facilitated by wildfire disturbance, which creates opportunities for establishment where recruitment is otherwise rare (Landhausser and Wein Citation1993; Joly, Chapin, and Klein Citation2010; Hewitt et al. Citation2017). Currently, fires in Arctic Alaska are limited by their ignition source (infrequent lightning) and the availability of favorable burn weather. However, the paleorecord shows that there is a strong historical link between fire regime and tundra vegetation in Alaska. The last time the Earth experienced dramatic climate warming, during the early Holocene (14,000–10,000 BP), wildfire occurrence corresponded with the presence and abundance of highly flammable birch (Betula) shrubs on the landscape (Higuera et al. Citation2008). These historical and contemporary patterns suggest positive feedbacks between increased shrub cover and increased tundra burning (Higuera et al. Citation2011). Changes in summer weather and the composition and abundance of fuels in tundra could contribute to further shifts in the fire regime that will directly impact post-fire successional trajectories. For example, in northwest Alaska, bryophytes, sedges, and graminoids—from both regrowth and seedling recruitment—dominated severely burned tussock–shrub and dwarf shrub tundra along a hillslope during the first decade postrecovery (Racine Citation1981). Then in the second and third decades, vegetation shifted to shrub dominance, mainly Rhododendron tomentosum spp. decumbens and the willow Salix pulchra, such that shrub cover was greater than before the fire (Racine et al. Citation2004). However, long-term post-fire tundra successional trajectories are relatively unknown beyond a few point localities, so it is unclear whether this observed trend is expected to be common or an anomaly (but see Racine, Dennis, and Patterson Citation1985; Racine, Johnson, and Viereck Citation1987). Understanding the consequences of a change in fire regime is complicated by the fact that there are relatively few large recent fires that are road accessible for easy study and monitoring post-fire over time.
Burn severity, or the change in plant biomass and soil organic material due to burning, can influence patterns of post-fire regeneration and reaccumulation of fuels by affecting mortality rates, post-fire seed and bud availability, and physical soil properties that affect plant establishment and growth (Johnstone et al. Citation2010; Hollingsworth et al. Citation2013). The magnitude of duff consumption affects both the availability of seed and bud banks (Schimmel and Granstrom Citation1996) and the physical properties of the post-fire soil (Dyrness and Norum Citation1983) that affect successful germination and establishment. In tundra ecosystems that accumulate thick duff layers (>50 cm), the degree to which these surface moss and organic soil layers are consumed during combustion is likely the most important control on plant regeneration.
Although relatively unstudied in tundra, evidence from the neighboring boreal forest suggests that burn characteristics affect patterns of plant regeneration during this critical establishment period by exerting a strong influence on future vegetation characteristics and plant succession in two major ways. First, large-scale disturbances that expose mineral soil in tundra promote increased recruitment of shrub species (Lantz et al. Citation2009). Second, if post-fire tundra plant communities become dominated by shrubs, this will alter the ecosystem structure and increase the accumulation rate of aboveground fuels and duff and potentially future flammability.
Understanding the post-fire successional trajectories and ecosystem consequences of a changing tundra fire regime is critical to forecasting impacts on regional carbon balance, permafrost degradation, and shifts in species composition. Here we quantified vegetation composition and ecosystem characteristics (i.e., soil carbon [C] and nitrogen [N] stocks, aboveground biomass, shrub density, and foliar C and N) from multiple sites across the Seward Peninsula. Compared to elsewhere in Arctic Alaska, the Seward Peninsula in northwestern Alaska has experienced the greatest number of fires, cumulative area burned, and area reburned (Racine, Johnson, and Viereck Citation1987). In this particular tundra region, a mosaic of overlapping burns has been mapped since the 1950s (Alaska Interagency Coordination Center, unpublished data).
Our specific research questions in this study were as follows: (1) How do time after fire, burn severity, and times burned (collectively called “metrics to characterize fire regime”) affect the composition of species and plant functional types (e.g., sedges, grasses, shrubs)? We hypothesized that an intensifying fire regime—increases in burn severity and a shortened fire return interval—would favor shrub establishment and growth. To evaluate this objective, we described and compared species composition and plant functional types across plots along a gradient in fire history and regime. To better understand the underlying mechanisms driving post-fire successional pathways we asked: (2) How do metrics to characterize fire regime affect ecosystem function? We hypothesized that these metrics—time after fire (fire history), burn severity (fire history and regime), and times burned (fire regime)—would be coupled with an increasing shrub:tussock ratio, indicative of increasing shrub abundance in graminoid-dominated tussock tundra, leading to variation in nutrient cycling and carbon storage. To evaluate this objective, we correlated metrics to characterize fire regime, using a single synthetic fire effect variable, with above- and belowground ecosystem properties (specifically, foliar C and N, shrub:tussock characteristics, vegetation characteristics, soil organic depth, thaw depth, and soil C and N). Collectively, we used a combination of descriptive and correlation multivariate statistical approaches to disentangle the role of fire in shifting successional trajectories and present a conceptual model relying on results from both analyses and the literature to suggest mechanisms associated with variation in successional trajectories in western Alaska arctic tundra.
Methods
Study area
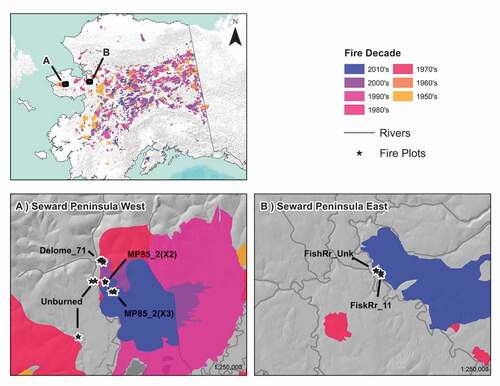
We studied tundra fire scars in two regions on the Seward Peninsula (, ). Our main study region was north of Nome near Quartz Creek and the Kougarok River, at the end of the Kougarok Road (Seward Peninsula West; ). The Kougarok tundra fire field site has burned in five major fires in the decades since 1950 (Alaska Interagency Coordination Center, unpublished data). Lightning ignited four of these fires at the field site and one was human caused. The mosaic of overlapping fire scars allowed for the study of repeat fires. We also surveyed adjacent tundra with no record of burning west and south of the Kougarok tundra fire site. Our secondary study region was south of Kotzebue near the Buckland River (Seward Peninsula East; ). Both regions have similar landscape characteristics and climate conditions (Lloyd et al. Citation2003), though the Kougarok tundra fire site has been more extensively studied due to its proximity to the road system (Liljedahl et al. Citation2007; Narita et al. Citation2015; Iwahana et al. Citation2016; Tsuyuzaki, Iwahana, and Saito Citation2017).
Table 1. Number of plots, fire scars sampled, and the years each plot burned at our two study regions on the Seward Peninsula, Alaska
Figure 1. Map of study sites on the Seward Peninsula, Alaska. Plots and fire scars are shown at (A) the end of the Kougarok road (Seward Peninsula West) and (B) Buckland River (Seward Peninsula East). The Minguk River fire scar (2010s), which burned in 2016 (Seward Peninsula West), is shown on the map, though sites were visited prior to this fire.
The central Seward Peninsula is characterized by continuous permafrost with a thickness of 15 to 30 m and a mean active layer thickness of 56 cm (Hinzman et al. Citation2003). Sloping hills with mixed shrub–tussock tundra and tussock tundra vegetation in the uplands are characteristic of the region. Three micrometeorological towers near the Kougarok field site recorded a mean annual temperature of −2.4°C, mean January temperature of −23.1°C, mean July temperature of +11°C, and mean summer rainfall (June–August) of 94 mm from 2000 to 2006 (Liljedahl et al. Citation2007).
Field methods
Vegetation sampling
To characterize vegetation composition and biomass, we sampled 1 m2 plots within fire scars in both Seward Peninsula study regions and adjacent unburned tundra near the Kougarok tundra fire field site in July 2012. Plots were arranged within each fire complex—area of fires, with multiple fires—so that we sampled vegetation that burned once, twice, or thrice and that had no evidence of recent fire for a total of forty-three vegetation plots (). Our sample size was limited by the difficulty of traversing the tundra landscape by foot, even though one of our study regions is road accessible. At each plot the following eight measurements were made: (1) full vascular and nonvascular species lists and their percentage cover (plant nomenclature follows the Arctic Vegetation Archive’s Pan-Arctic Species List; D. A. Walker et al. Citation2018), (2) height and absolute cover of plant functional types (shrubs [deciduous shrubs and evergreen shrubs], graminoids [grasses and sedges], forbs, bryophytes, and lichens), standing dead and woody debris, litter, bare soil, and standing water; (3) shrub basal diameter for all shrubs with >1 cm basal diameter; (4) aboveground biomass clipped in a 25-cm subplot for all vascular <1 cm basal diameter and nonvascular plants; (5) number of tussocks and their diameter for Eriophorum vaginatum, the sedge that is the foundation of the sampled tundra communities. Tussock diameters were measured twice in perpendicular directions across each tussock and then averaged; (6) foliar C and N content from two common upland shrubs (Salix spp., either S. pulchra or S. glauca if S. pulchra was not present and Betula nana); and the tussock forming sedge E. vaginatum; (7) abiotic factors including latitude and longitude coordinates, topographic position, elevation, parent material, slope (%) measured with an inclinometer, and scalar site moisture (Johnstone, Hollingsworth, and Chapin Citation2008); and (8) mid-season synchronous thaw depth, soil organic layer (SOL) depth, and mineral soil pH at the four corners of each 1 m2 plot (see below).
Soil sampling
Thaw depth was measured by inserting a metal rod into the soil until it hit ice, marking the surface of the green moss on the rod, removing it, and measuring the distance from the tip to the mark with a meter stick. In some cases rock was encountered above the permafrost table, preventing an accurate measurement of thaw depth and this was recorded. SOL depth was measured by slicing a square pit with a serrated knife, removing a monolith of organic soil, exposing the surface of the mineral soil, and measuring the distance from the surface of the green moss to the mineral soil on two sides of the pit (averaged to yield one SOL depth measurement/point). If ice was encountered before mineral soil, this was reflected to account for incomplete measurements of SOL depth. Mineral soil pH was measured in situ with an Oakton waterproof pHTestr 30, and a soil sample was collected for determination of bulk density and C and N concentrations.
At one randomly selected corner in each plot, we harvested a second 10 × 10 cm monolith of organic soil from the exposed side of the pit. The monolith extended from the surface of the green moss to the surface of the mineral soil (roughly 5–30 cm, depending on location). We clipped aboveground vegetation from the surface of the monolith, measured its dimensions, wrapped it in multiple layers of tinfoil to preserve structure, placed it in a cooler with blue ice, and returned it to the lab at the University of Alaska Fairbanks, where these samples were frozen and shipped to the University of Florida for additional soil analyses (C and N). We also collected a 10 cm deep × 5.5 cm diameter mineral soil core from the pit for analyses of soil pH to compare with in situ measurements of soil pH.
Metrics used to characterize fire regime
We surveyed various burn metrics in the field for each plot. Substrate and vegetation burn severity composite scores for each plot were collected using the Alaska Interagency Fire Effects Task Group protocol (Alaska Interagency Fire Effects Task Group Citation2007), optimized for the tundra region. Composite scores vary from low to moderate to high, using a suite of measurements and indicators in the field (Supplementary ). This is a relative scalar that depends on time after fire, so we use it to interpret evidence of fire. For example, the post-fire appearance of tussocks indicates a burn severity of “low” if tussocks have moderate quantities of senesced leaf litter and less than 20 percent of the basal area consumed and a severity of “high” if tussocks have no leaf litter remaining and greater than 60 percent of their basal area consumed. This protocol, however, makes it difficult to interpret burn severity with increasing time after fire.
Fire history reflects the fire regime, and we often derive metrics from fire histories for the purpose of characterizing fire regime. For our analyses, we later grouped plots according to quantitative, categorical, and scalar metrics to characterize fire regime: (1) time after fire (fire history characteristic): number of years since a given plot burned (or <30 years [N = 23] and ≥31 years classes [N = 20]); (2) times burned (fire frequency or a fire regime characteristic): number of times a given plot burned (none [N = 8], once [N = 25], or more than once [twice and thrice; N = 9]); and (3) burn severity (both a fire history and fire regime characteristic): composite score developed for this study from 0 to 8 for a given plot, related to both the substrate (mineral soil exposed and charred layer in soil) and vegetation burn severity (abundance of charred stems or culms) and whether there was sign of past fire on shrubs or tussock (low [0–1, N = 10], moderate [2–4; N = 17], or high [5–8; N = 16]. Putatively unburned plots (burn severity = 0) were grouped with those with the lowest burn severity (burn severity = 1), because there were only two burned plots classified as low severity; both occurred at the 1971 Delome fire scar, having burned once. There are no plots in our study that are both thirty-one years or more after fire and showing high burn severity, due to the methodological issue of decreasing ability to detect severity with time after fire.
Laboratory methods
Species composition
Voucher species for all vascular and nonvascular species were verified in the laboratory. All vascular species were verified at the University of Alaska Fairbanks Museum of the North Herbarium. Lichen and bryophyte specimens were sent to the Komarov Botanical Institute at the Russian Academy of Sciences and verified by Misha Zhurbenko and Olga Afonina, respectively.
Biomass estimates
All clipped aboveground biomass samples were dried at 25°C for 48 hours and weighed (dry [fresh] weight; hereafter called plot biomass). We created allometric equations (Berner et al. Citation2015) to estimate shrub biomass for shrubs >1 cm2 in basal diameter by collecting multiple shrubs of various species and basal diameters outside of plots and weighing them (hereafter called shrub biomass). We used a published allometric equation to estimate tussock biomass (Mack et al. Citation2011), using measurements of tussock diameters.
Soil analyses
A soil monolith was collected at each plot, comprised of 5- to 10-cm increment soil samples. In the lab, each monolith was thawed and sliced into 5-cm depth intervals with a serrated electric carving knife, with the last sample of variable depth depending on the location of the organic/mineral interface. Samples were homogenized by hand, and coarse organic materials (>2.5-cm twigs and roots) and rocks were removed. Coarse and fine organic fractions were weighed wet, dried at 70°C for 48 hours to determine dry matter content, and then ground on a Wiley mill with a 40-mm sieve. Carbon and N content were measured on a Costech Elemental Analyzer (EA, Costech Analytical, Los Angeles, CA), calibrated with the standard NIST peach leaves (SRM 1547, National Institute of Standards and Technology, Gaithersburg, MD). Rocks were weighed and the volume was measured by displacement in water. The volume of each monolith layer was calculated as depth multiplied by area minus the volume of rocks. Bulk density and C and N pools were calculated for both fine and coarse organic fractions. Pools were calculated for each depth increment by multiplying bulk density by concentration and depth and extrapolating to 1 m2. Soil pH was measured on dried soil samples. Distilled deionized water was added to create a slurry and pH was measured using an Oakton pH 2700. Soil pH was calculated on a mean profile basis by multiplying the log-transformed pH in each depth increment by the proportional soil mass of that increment, summing the products, and back-transforming the sum.
Foliar C and N
Vegetation samples from E. vaginatum, B. nana, and Salix spp. (S. pulchra or S. glauca) from each plot were pooled and dried at 25°C for 48 hours and ground to a fine powder. Foliar C and N were measured on a Costech EA, as described above.
Statistical methods
All statistical analyses were performed using the R statistical package 3.3.2 (R Core Team Citation2016) unless otherwise specified.
Effect of fire on species composition and plant functional types
We evaluated diversity at three scales: alpha diversity (the average species richness per plot), beta diversity (species turnover, ratio of the total number of species across all sites to the average number of species per plot), and gamma diversity (regional diversity, or the total number of species across all plots; McCune and Grace Citation2002). We used analysis of variance (ANOVA) with Tukey’s post hoc tests to test for significant differences in alpha diversity between burn severity classes (defined in Metrics Used to Characterize Fire Regime) and an independent t-test to test for significant differences in time after fire classes (defined in Metrics Used to Characterize Fire Regime). Assumptions of ANOVA were met, including normality (normal probability plot) and homogeneity of variance (Levene’s test).
To examine the abundance of plant functional types in relationship to metrics used to characterize fire regime, we related the mean plot absolute cover by time after fire, burn severity, and times burned classes. Due to overlapping canopy layers, the sum of absolute cover can exceed >100 percent. We did not include rushes (Juncaceae) in the graminoid class or seedless vascular plants (horsetails and lycopods) in the resulting figures, because there were few taxa of these functional types within the sampled plots. We discarded one quadrat from all analyses because it was a multivariate outlier (Mahalanobis distance; McCune and Grace Citation2002). The discarded quadrat was composed of >70 percent forb (Petasites frigidus) cover, unlike any other sampled plot, because the maximum cover by this species elsewhere was <20 percent.
To quantify the differences in species composition between plots and correlate overall species composition to metrics to characterize fire regime and the local environment, we used nonmetric multidimensional scaling (NMDS; Mather Citation1976; Kruskal and Wish Citation1978), complemented with Kendall correlation coefficients (τ; PC-ORD v7.0; McCune and Mefford Citation2017). NMDS is an ordination technique that is well suited for species compositional data because it does not assume linear or orthogonal relationships between the axes (McCune and Grace Citation2002). Singletons were removed from the species composition data (i.e., species that only occurred at one plot). A preliminary analysis, using a Monte Carlo test of significance for a six-dimensional solution stepping down to a one-dimensional solution, was used to determine the appropriate dimensionality (number of axes) for ordination. The preliminary run included 500 iterations with fifty runs of real data, fifty runs of randomized data, and an instability criterion of 0.000001. Based on preliminary results, we chose a three-dimensional solution for the final analysis. All analyses used the Sorenson distance measure and random starting configurations. High Kendall correlations (r2 > 0.25) between our main matrix (species vs. plot) and an environmental matrix (environmental variables vs. plot) were displayed using biplot overlays that indicate the strength and direction of the correlations with the environment. Finally, we calculated a post hoc proportion of variance represented by each axis (the coefficient of determination or r2) by calculating the Sorenson distance measure between pairwise distances of objects in ordination spaces and distances in the original matrix (McCune and Grace Citation2002).
To better visualize changes in vegetation in response to metrics to characterize fire regime in our ordinations, we post hoc grouped our vegetation plots into four distinct plant communities that primarily differ in percentage cover of graminoids vs. shrubs following the classification of Viereck et al. (Citation1992). Plots with at least 25 percent cover of erect shrubs were classified as either shrub tundra (>75 percent shrub cover; N = 9) or mixed shrub–tussock tundra (N = 11). The remaining plots are all mesic graminoid herbaceous and classified as either tussock tundra (N = 14) or graminoid–forb tundra (N = 8). Graminoid–forb tundra, however, is not a vegetation type identified by Viereck et al. (Citation1992) but is most similar to their bluejoint meadow, which is dominated by Calamagrostis canadensis and is described as often being pure stands or having other grasses and forbs present but not codominant. Bluejoint meadows are most common south of latitudinal treeline where their development is generally initiated by disturbance such as fire and land clearing. Bluejoint communities on the Seward Peninsula have been reported and described as small and largely restricted to disturbed sites such as villages and recently drained lake basins (Racine and Anderson Citation1979). We chose to designate these plots as graminoid–forb tundra because they differ in being codominant by three different grasses (Calamagrostis lapponica, Calamagrostis neglecta, and Arctagrostis latifolia), none of which are the dominant species of Viereck et al.’s (Citation1992) bluejoint meadow. This vegetation type is likely a northwestern variant of the bluejoint meadow, but because we did not sample with the intent to classify plant communities we instead refer to this vegetation type as a less descriptive graminoid–forb tundra that warrants further description and research.
Effect of fire on ecosystem properties
Our multivariate descriptive ordination analyses revealed a complex and often correlated relationship between our metrics used to characterize fire regime (time after fire, burn severity, and times burned) and vegetation. Metrics to characterize fire regime were highly correlated with one another (Spearman’s ρ = −0.60 times burned and time after fire, Spearman’s ρ = 0.80 times burned and burn severity score, and Spearman’s ρ = −0.81 time after fire and burn severity score). Conceptually, burn severity represents the amount of biomass (particularly duff) consumed in the last fire and times burned (i.e., fire frequency) represents cumulative biomass consumed over multiple fires. However, due to the chronosequence approach of our study (as opposed to studying plots over time that have burned multiple times) the effect is similar. Times burned creates site conditions that mimic a more severe fire. Alternatively, time after fire allows biomass to reaccumulate, thus creating site conditions that mimic a low-severity fire.
We see these differences in site and vegetation characteristics that are tied to their recent fire histories as reflective of an intensifying fire regime (more severe and frequent fires) and therefore integrated these three variables into a synthetic index that represents an overall effect of fire through the use of principal component analysis (PCA) hereafter referred to as “fire effect.” PCA is a method that can distill a suite of correlated variables into one or a few variables and address issues of multicollinearity among variables (e.g., Hamann et al. Citation1998; Graham Citation2003). By synthesizing fire effect, we could more explicitly quantify correlations between our metrics used to characterize fire regime and specific ecosystem properties than in our initial descriptive ordination analysis (San-Miguel et al. Citation2020). This analysis did not incorporate species composition; instead, the analysis examined the relationship among our metrics used to characterize fire regime as a single fire effect variable and ecosystem properties. These data met the assumptions of normality. We ran a distance-based PCA (PC-ORD v7; McCune and Mefford Citation2017), and our cross-product matrix contained correlation coefficients between our three variables.
To test the effect of fire on above- and belowground ecosystem properties, we used linear mixed effects models in the nlme package (Pinheiro et al. Citation2017). Because we tested multiple response variables with the same experimental units in relation to fire effect, we corrected p values by controlling for false discovery rates with the Benjamini-Hochberg procedure (Benjamini and Hochberg Citation1995). We exported the first PCA axis and used it as our comprehensive fire effect variable. With separate models, we tested whether the fixed factor fire effect (PCA axis 1, the independent variable) was important in explaining the variability in belowground ecosystem properties (SOL depth, thaw depth, profile weighted C:N, C concentration, N concentration, C pool, N pool, fine pool, coarse woody debris pool, and surface soil C:N, the dependent variables) with quadrat nested in burn scar as a random factor to account for variability in observations based on environmental heterogeneity. When testing the relationship between fire and SOL depth, we excluded sites (n = 5) where we hit ice before reaching the bottom of the organic horizon (n = 38 vs. n = 43 plots).
We used the same model structure with fire effect as a fixed factor and quadrat nested in site as a random factor when testing fire effects on aboveground ecosystem properties, specifically related to a shift in the shrub:tussock ratio. We tested relationships between our synthetic fire effect variable and total species richness, bryophyte and deciduous shrub richness, shrub basal area and density, plot biomass, foliar C:N, % N, and % C of E. vaginatum, B. nana, and Salix spp. We excluded variables that did not meet the assumption of homoscedasticity (i.e., grass richness, shrub richness, and metrics of tussock abundance) and variables that were highly correlated with other aboveground variables.
Results
Effect of fire on species composition and plant functional types
Across all forty-three plots, alpha diversity (average number of species/plot ± SE) was 16.95 ± 0.75, beta diversity was 6.01 (total number of species/alpha diversity), and gamma diversity was 102 (total number of species across all plots). Species richness varied significantly among burn severity classes (ANOVA F = 6.97, p = .003), with richness generally declining as burn severity increased. Moderate-severity plots had the greatest species richness per plot (19.53 ± 1.09), significantly greater than that of high-severity plots (13.94 ± 1.07; Tukey’s post hoc p = .002). There was no significant difference, however, between species richness in high-severity and low-severity plots (17.40 ± 1.28; Tukey’s post hoc p = .129) or between moderate-severity and low-severity plots (Tukey’s post hoc p = .439).
The NMDS ordination had a final stress of 12.96, indicating that the ordination was a satisfactory representation of species composition patterns (McCune and Grace Citation2002). Three axes captured approximately 86 percent of the variance in species composition across all plots, and the final ordination solution was highly stable with an instability of 0.00001 after seventy-eight iterations (). Axis 1 represented 35 percent of the variation in community composition and was not directly correlated with metrics to characterize fire regime. Instead, this axis was directly correlated with variables related to a gradient in composition from tussocks to shrubs (positively correlated with shrub basal area:tussock basal area and negatively correlated with tussock basal area and sedge percentage cover; Supplemental Table 2). The shift in tussock to shrub abundance is further demonstrated by the vegetation classes plots are grouped in the ordination (). Although there is strong overlap in species composition along Axis 1 between the tussock tundra vegetation plots and the mixed shrub–tussock tundra vegetation plots, there is little overlap in species composition between tussock tundra plots and shrub tundra plots ().
Figure 2. NMDS ordination of all sites. Three axes captured approximately 86 percent of the variance in species composition across all plots. Ordinations were correlated with environmental and vegetation characteristics and grouped by vegetation class. Strong Kendall correlations (r2 > 0.25) with the ordination axes are indicated by biplot vectors where plots are grouped by vegetation class showing (a) Axis 1 vs. Axis 2 and (b) Axis 2 vs. Axis 3.
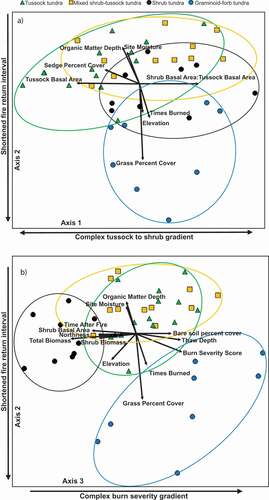
The relationship between metrics to characterize fire regime is complex; therefore, we evaluated Axis 2 and Axis 3 together. Axis 2 represented 32 percent of the variation in species composition and was most directly linked to the effect of repeat burning (positively correlated with organic matter depth and site moisture and negatively correlated with grass cover, times burned, and elevation). Axis 3 represented 19 percent of the variation in species composition and was the axis most directly linked to a burn severity gradient (positively correlated with burn severity score, bare soil cover, and thaw depth and negatively correlated with time after fire, shrub basal area, and shrub/total biomass; ). These two axes together contribute to the distinct graminoid–forb tundra vegetation plots in ordination space (). Axis 2, however, also had strong correlations with variables generally indicative of shortened fire return interval, namely, times a plot burned and SOL depth. Axis 2 more accurately represented both a complex environmental and fire regime gradient, likely driven by the coupling of landscape position with site moisture, and likelihood of repeat burning and loss of SOL (, Supplemental Table 2).
We were interested in evaluating whether there were noticeable shifts in plant functional types and, in particular, shrubs related to metrics used to characterize fire regime (). Our results indicate that total shrub cover was aproximately 15 percent to 20 percent greater in moderate-severity (56.8 percent) or low-severity (57.9%) plots than in high-severity plots (40.0%). We found that total graminoid cover was greater (~15 percent) in high-severity plots (48.2 percent) compared to low-severity (34.6 percent) or moderate-severity plots (33.2 percent). Because percentage cover of sedges did not vary among severity classes (~30 percent for all severities), this difference in graminoids can be accounted for by shifts in the percentage cover of grasses. The most notable shift in plant functional types related to metrics to characterize fire regime was observed for graminoid cover, predominantly for the grasses Arctagrostis latifolia and Calamagrostis lapponica (). The older burn scars had <1 percent grass cover, and the moderate and low burn (including unburned) severity tundra plots showed only 2 percent and 1 percent cover, respectively. In contrast, the younger burn scars and those with high burn severity had a mean grass cover of >15 percent. We also observed a trend toward lower bryophyte and lichen cover in high-severity plots.
Figure 3. Mean absolute cover of plant functional type, with plots grouped by time after fire, burn severity, and times burned classes.
The most notable shift in plant functional types related to metrics to characterize fire regime was observed for graminoid cover, predominantly for the grasses Arctagrostis latifolia and Calamagrostis lapponica (). The older burn scars and sites that had not burned had <1 percent grass cover, and moderate and low burn (including unburned) severity tundra plots and once burned plots showed only 2 percent, 1 percent, and 3 percent cover, respectively. In contrast, the younger burn scars and those with high burn severity had a mean grass cover of >15 percent. Moreover, we observed nearly 30 percent grass cover in fire scars where repeat burning occurred. We also observed a trend toward lower bryophyte and lichen cover in high-severity plots.
Effect of fire on ecosystem properties
Quantifying fire effect
Axis 1 of the PCA described approximately 84 percent of the variability and is highly significant (p = .009). The eigenvalue rankings on Axis 1 include burn severity score = 0.96552, time after fire = −0.91067, and times burned = 0.88776.
Belowground ecosystem properties
With increasing fire effect, SOL depth was significantly reduced (χ2 = 14.35, p < .001), concurrent with an increase in thaw depth (χ2 = 21.07, p < .001; , Supplementary Table 3a). The C pool was also reduced with increasing fire effect (χ2 = 5.22, p = .04), and the N pool showed a marginal reduction (χ2 = 3.47, p = .06; , Supplementary Table 3a). The profile-weighted soil C:N was not sensitive to variation in fire effect, but the surface soil C:N increased with greater fire effect (χ2 = 4.12, p = .04; , Supplementary Table 3a). The fine fuels pool was reduced with increasing fire effect (χ2 = 5.44, p = .02), whereas the coarse woody debris fuels pool was not responsive to fire (, Supplementary Table 3a).
Figure 4. The response of belowground ecosystem characteristics to increased fire effects. Fire effect is a composite variable based on time after fire, number of times burned, and burn severity. Solid lines indicate significant relationships (p < .05), and dashed lines indicate marginally significant relationships (0.1 > p > .05). (c), (d), (f) represent profile-weighted pools. Surf = surficial (upper 5 cm of soil).
Aboveground ecosystem properties
Plot-level biomass marginally declined with a stronger fire effect (χ2 = 4.69, p = .06; Supplementary Table 3b), whereas grass cover increased (χ2 = 8.10, p = .03; , Supplementary Table 3b). Foliar C:N of Salix sp. was positively related to fire effect (χ2 = 9.27, p = .03), apparently due to an increase in %C (χ2 = 9.70, p = .03), concurrent with an increase in foliar %C for E. vaginatum (χ2 = 13.78, p = .03) and a decrease in %N (χ2 = 8.01, p = .03; , Supplementary Table 3b). Although there was not a shift in the foliar C:N of Betula nana (Supplementary Table 3b), we did see a decline in %N with increased fire effect (χ2 = 13.68, p = .03; ). We did not observe an effect of fire on metrics representing shrub cover, basal area, or biomass (Supplementary Table 3b); however, total plot biomass likely reflects some shifts in shrub biomass due to the large percentage of shrub biomass in total biomass. These results show that the shrub plant functional type is less responsive to fire effects than anticipated. We could not conduct analyses on tussock metrics versus fire effect due to heteroscedasticity.
Figure 5. Response of aboveground vegetation characteristics to increased fire effects. Fire effect is a composite variable based on time after fire, burn severity, and times burned. Solid lines indicate significant relationships (p < .05).
Discussion
Post-fire successional trajectories and ecosystem properties are driven by the complex fire regime of the Seward Peninsula. In this region, not only is fire frequency increasing and burn severity intensifying (Racine, Johnson, and Viereck Citation1987; Rupp, Starfield, and Chapin Citation2000; Hu et al. Citation2015) but in the last fifty years reburning of tundra is a more common phenomenon (Liljedahl et al. Citation2007). The strong historical link between fire regime and tundra vegetation (Higuera et al. Citation2011), coupled with the observed climate-related increases in shrub dominance in Arctic Alaska—particularly in recently burned areas (Racine et al. Citation2004; Tape, Sturm, and Racine Citation2006; Lantz, Gergel, and Henry Citation2010; Myers-Smith et al. Citation2011)—led us to hypothesize that changes in metrics to characterize fire regime in northwestern Arctic Alaska would be tied to shifts from graminoid tussock tundra to a mixed shrub–tussock tundra or shrub tundra. We predicted that burned areas would show an increase in shrub abundance and a decrease in tussock abundance relative to unburned tundra and that as more fire-related shrub recruitment occurred, more biomass would accumulate.
Our ordination results suggest a strong correlation among our metrics used to characterize fire regime, though a large amount of the variation in sampled communities was attributed to a complex tussock to shrub gradient. Nevertheless, this is not a causal analysis, and we cannot conclude that tussock density and abundance are not related to fire regime. Tussocks dominate both fire-disturbed and undisturbed tundra sites and occur in all stages of succession, regardless of time after fire (Jandt and Meyers Citation2000); however, E. vaginatum cover, biomass, and density on burned sites was found to exceed that of unburned tundra even twenty-five years post-fire (Fetcher et al. Citation1984; Racine, Johnson, and Viereck Citation1987; Jandt and Meyers Citation2000). Despite the strong correlations we observed in overall plot species composition and variation in the tussock-to-shrub ratio (i.e., tussock basal area, shrub basal area:tussock basal area), these variables were not directly correlated with metrics to characterize fire regime in the descriptive ordination analysis. However, we saw significant negative correlations between fire effect and plot biomass in our quantitative mixed model analysis, which is likely a reflection of a decrease in shrub biomass, given the strong correlation between these two variables. Our results suggest a potential sensitivity of shrub abundance to fire and a potential resilience of E. vaginatum to fire, but these results in no way support the positive relationship between fire and increases in shrub abundance found in other tundra ecosystems (e.g., Lantz, Gergel, and Henry Citation2010).
Shrub and graminoid (attributed to grasses) plant functional types showed the greatest response to differences in burn severity. Regardless of time after fire, total shrub cover was highest in moderate- and low-severity plots, where shrubs survive belowground and resprout post-fire, and graminoid cover was greatest in high-severity plots, where shrubs have greater mortality. We expected high-severity fires that expose mineral soil in the tundra to promote increased shrub recruitment and, hence, cover of shrub species over time (Lantz, Gergel, and Henry Citation2010). In contrast, we found that high-severity fires promoted recruitment and perpetuation of grasses. This was also evident from our mixed model analysis that showed a positive relationship between fire effect and grass cover, whereas we observed no fire effect on our various shrub metrics. This finding is particularly of interest because we observed a shift from a complete absence of grasses in unburned tundra to a range of 7 percent to 79 percent cover following fire, most notably in areas where high-severity and repeat fires occurred. This graminoid–forb vegetation type was completely distinct in species composition.
Similar to the tallgrass prairie in central North America (Ratajczak, Nippert, and Ocheltree Citation2014), for graminoid–forb tundra to remain grass-dominated requires periodic disruption by wildfire to prevent shrub and tussock dominance. The observed “grassification” of tussock tundra has been described as a short-lived, early successional post-fire phenomenon on the Seward Peninsula and North Slope (Raynolds, Walker, and Maier Citation2005; Racine et al. Citation2010; Jones et al. Citation2013). This is a distinct variant of tussock tundra (Eriophorum vaginatum–Sphagnum spp. subtype Chamerion angustifolium) that Raynolds, Walker, and Maier (Citation2005) reported includes the grasses Arctagrostis latifolia and Calamagrostis canadensis as indicator species. Our study did not document Calamagrostis canadensis but rather two other Calamagrostis species, Calamagrostis lapponica and C. neglecta, and for now we are describing a less descriptive graminoid–forb tundra that is more stable than an early successional variant of tussock tundra post-fire. Seeding by rhizomatous grasses is a locally important revegetation mechanism following a disturbance in the tundra (Forbes, Ebersole, and Strandberg Citation2001), including wildfire (Bliss and Wein Citation1972; Racine et al. Citation2004, Citation2010). However, we observed grasses in burn scars that were up to forty-six years old and therefore report for the first time a post-fire graminoid–forb-rich tundra plant community with the potential to persist and be self-perpetuating. At the time of our field study, the Kougarok fire complex experienced three major wildfires (; 1971, 1997, 2002). Since then, two more wildfires occurred within the study area, in 2015 (shown in ) and in 2019 (not shown).
In other tundra regions, post-fire tundra succession and vegetation development is strongly linked to active layer thickness (Fetcher et al. Citation1984; Bret-Harte et al. Citation2013). At the Kougarok fire complex, the 2002 fire was reported as moderate to severe with 50 percent of the 14-cm organic layer consumed by fire. Removal of the SOL precipitated a subsequent increase in soil temperature, earlier freezing, and deeper thaw that persisted five years post-fire (Liljedahl et al. Citation2007), as well as the development of thermokarst subsidence (Iwahana et al. Citation2016). These belowground shifts in ecosystem properties were strongly linked to vegetation structure, where deep thaw corresponded to graminoid-rich areas and shallower thaw corresponded to shrub-rich areas (Narita et al. Citation2015). Our results indicate that fire effect was positively correlated with thaw depth and negatively correlated with SOL (as anticipated), and these trends also corresponded to a decrease in overall plot biomass and an increase in grass cover. The increased grass dominance associated with increased thaw depth has been observed in other tundra ecosystems (e.g., Natali, Schuur, and Rubin Citation2012), where grasses have faster turnover and are better able to access nutrients released by thawing. In addition, arctic grasses are observed to generally be more deeply rooted than deciduous shrubs (Iversen et al. Citation2015).
An increased fire effect resulted in foliar traits and soil characteristics that suggest plant-available N limitations with increasing fire severity. With an increase in fire effect, we found a significant increase in foliar C:N of Salix species, concurrent with marginal increases in C concentration and a decline in N concentration for E. vaginatum. Betula nana foliage also showed a negative relationship between fire effect and N concentration. At the same time, we saw a marginal decline in the total soil N pool, and surface soil (top 5 cm) C:N increased as fire effect increased. Together, these patterns could indicate reduced plant N availability with increased fire effect. Fire is a “pulse” disturbance, where surface organic N is rapidly volatilized (Alexander and Mack Citation2016), with a potentially long time to reaccumulation (Mack et al. Citation2011).
Our results also suggest a relationship between increased fire effect and reduced forage quality and quantity of S. pulchra and S. glauca, which are browse species for caribou, moose, and ptarmigan (Christie et al. Citation2014). An increase in shrubs across the Arctic has resulted in changes to the quality and quantity of forage for northern ungulates (Tape, Sturm, and Racine Citation2006); 45 percent to 50 percent of spring and summer forage for caribou in Alaska consists of deciduous shrubs, including willow and birch species (Thompson and Barboza Citation2014). Our observations of species-level variation in foliar C:N in response to fire suggest that, regardless of shifts in abundance, fire is uniquely affecting shrub foliar traits that could have cascading effects on habitat (Mekonnen, Riley, and Grant Citation2018).
The climate and local flora of the Seward Peninsula are linked to the North Slope tundra, where underlying parent material and cold temperatures contribute to the lack of trees (D. A. Walker et al. Citation2018). However, the complex fire regime of the Seward Peninsula and the lasting effect this has on vegetation communities are more similar to the boreal forest, where fire is an integral component of the landscape (Chapin et al. Citation2010). For example, the strong negative relationship we found between fire effect and SOL depth is much more similar to the patterns of burn severity and SOL in the boreal forest (Boby et al. Citation2010) than other arctic tundra regions where post-fire SOL has been measured (e.g., Mack et al. Citation2011). It is likely that, due to the repeat burning that we observed, there was less variability in pre-fire SOL depths and therefore residual or post-fire SOL is a better proxy for burn severity than in other less fire-prone tundra ecosystems. In boreal forest systems, successional trajectory is strongly linked to burn severity (Johnstone, Hollingsworth, and Chapin Citation2008; Hollingsworth et al. Citation2013), where low-severity fires promote relay succession and a quick return to pre-fire vegetation and soil conditions, whereas high-severity fires can trigger a shift in successional trajectory and the recruitment of novel species, both native (Johnstone et al. Citation2010) and invasive (X. J. Walker et al. Citation2017). The effect of burn severity on vegetation and recruitment in Alaska tundra is documented but limited (Bret-Harte et al. Citation2013; Hewitt et al. Citation2016). However, our study area experienced repeat burning, thus shortening the time after fire, which can be analogous to a shortened fire return interval and undoubtedly exacerbates fire effects on vegetation succession. There is evidence that at the northern limit of black spruce distribution in the boreal forest of the Yukon Territory, repeat burning and short (fifteen-year) fire return intervals limited tree germination due to the buildup of grass litter (Brown and Johnstone Citation2012). Although our research area contained no trees, we also observed an increase in grass and subsequent litter as well as a decrease in tussocks, mosses, and lichens, with an increase in burn severity and decrease in time after fire. Together, those two observations likely limit the germination of shrubs, as has been observed in tundra systems that burned at high severity (Barrett et al. Citation2012). Our results suggest that repeat fires or shortened fire return intervals, as well as an increase in burn severity, shift tussock tundra toward a more grass–forb-dominated tundra with significantly fewer mosses and lichens.
Tundra post-fire succession is not yet fully understood, and the few long-term studies published document a quick return to pre-fire tussock tundra (Bret-Harte et al. Citation2013) or transition to shrub tundra (Racine Citation1981; Barrett et al. Citation2012; Jones et al. Citation2013).
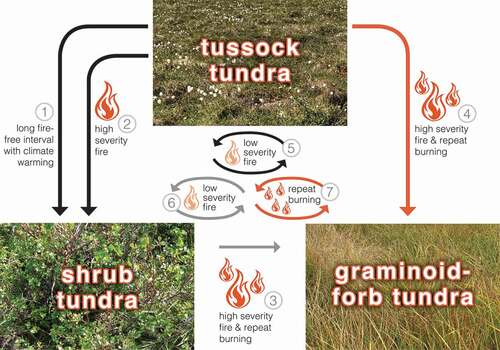
However, based on our observations, we put forth an alternative post-fire successional trajectory, in which grass dominance persists and is self-perpetuating post-fire, with repeat burning (). In tussock tundra, high moss accrual results in deep soil organic layers, fostering shallow active layers and low microbial decomposition due to cold soil temperatures (Hobbie et al. Citation2000). These conditions in turn favor low-severity fires that return tussock tundra to its pre-fire state, similar to the return to a pre-fire black spruce state in the cold, wet sites of boreal Alaska (Johnstone et al. Citation2010). Under the historical tundra fire regime, this internal feedback has likely been a source of ecosystem resilience due to cool, moist soils that are poorly drained and underlain by permafrost. However, changes in vegetation via the direct effects of climate change, coupled with shifts in tundra fire regimes, have the potential to result in alternative successional trajectories. As shrub cover increases in tussock tundra as a direct result of changes in climate (Myers-Smith et al. Citation2011), there is a shift in biomass and fuels. In the historic past, this shift from graminoids to shrubs is linked to changes in fire regime (Higuera et al. Citation2008). After high-severity fires that burn deeply into the SOL, we hypothesized that shrub species establishment is favored and leads to a switch to an alternative plant successional trajectory dominated or codominated by shrubs. However, changing fire regimes—with shifts toward shorter fire return intervals, increases in the area burned and reburned, and higher severity fires—may in fact have the opposite effect: decreased woody plant recovery and development of novel, grass-dominated graminoid–forb-rich tundra. Because our study did not include older (more than thirty-one years) high burn severity plots, our observation of a potential alternative graminoid–forb-rich tundra successional trajectory warrants further study.
Figure 6. Post-fire successional trajectories in Alaska arctic tundra. Arrows 1–4 depict trajectories among vegetation types and arrows 5–7 depict fire regimes that maintain existing vegetation. Colors represent observed (black), hypothesized (gray), and novel (orange) pathways. The trajectories among vegetation types include (1) tussock tundra to shrub tundra with a long fire-free interval and climate warming through a shift in dominance of existing shrubs and subsequent shading, accumulation of deciduous leaf litter, and loss of the understory (Epstein et al. Citation2004); (2) tussock tundra to shrub tundra after high-severity fire through combustion of vegetation and soil organic layers, thereby exposing mineral soil and facilitating shrub recruitment (e.g., Landhausser and Wein Citation1993; Racine et al. Citation2004; Jones et al. Citation2013); and (3), (4) tussock tundra (this study) and shrub tundra to a novel graminoid–forb tundra after high severity fire and repeat burning. (5), (6) Fire regimes that maintain existing vegetation include low-severity fire maintains tussock tundra (e.g., Bret-Harte et al. Citation2013; this study) and shrub tundra and their vegetation and ecosystem properties (7) and a short fire return interval (this study) maintains graminoid–forb tundra with its distinct vegetation and ecosystem properties.
We observed strong and significant shifts in vegetation and soil properties related to metrics to characterize fire regime. In contrast to our hypotheses, however, we found that increases in burn severity were associated with decreases in shrub abundance, and plot biomass was negatively correlated with our integrated variable of fire effect. Our results challenge the prevailing hypothesis that more fire activity will lead to higher plant productivity in tundra. Rather, we observed increased grass abundance with an intensifying fire regime. Incorporating multiple metrics to characterize fire regime into our analyses enabled a more thorough understanding of the complex relationship between fire and vegetation on the Seward Peninsula, indicating the continued need for research that addresses the effects of fire on successional trajectories in tundra ecosystems.
Data availability
All data associated with this project are available at: http://www.lter.uaf.edu/data/data-detail/id/752.
Supplemental Material
Download Zip (130.6 KB)Acknowledgments
We thank four anonymous reviewers for their constructive feedback that greatly improved the article. We also thank Kirsten Barrett for field support, Angie Floyd and Jamie Hollingsworth for creating , and Carolyn Rosner for creating . Bonanza Creek LTER (jointly funded by NSF and PNW Research Station, USDA Forest Service) provided logistical support, and the National Park Service and Bureau of Land Management provided housing in Kotzebue, Alaska.
Disclosure statement
The authors declare no conflict of interest.
Supplementary material
Supplemental material for this article can be accessed on the publisher’s website.
Additional information
Funding
References
- Alaska Interagency Fire Effects Task Group. 2007. Fire effects monitoring protocol (version 1.0), ed. J. Allen, K. Murphy, and R. Jandt. Anchorage, AK: Alaska Wildland Fire Coordinating Group. https://www.frames.gov/documents/catalog/AK_Fire_Effects_Monitoring_Protocol_2007.pdf
- Alexander, H. D., and M. C. Mack. 2016. A canopy shift in interior Alaskan boreal forests: Consequences for above- and belowground carbon and nitrogen pools during post-fire succession. Ecosystems 19:98–114. doi:https://doi.org/10.1007/s10021-015-9920-7.
- Barrett, K., A. V. Rocha, M. J. Van de Weg, and G. Shaver. 2012. Vegetation shifts observed in arctic tundra 17 years after fire. Remote Sensing Letters 3:729–36. doi:https://doi.org/10.1080/2150704X.2012.676741.
- Benjamini, Y., and Y. Hochberg. 1995. Controlling the false discovery rate: A practical and powerful approach to multiple testing. Journal of the Royal Statistical Society. Series B (Methodological) 57:289–300. doi:https://doi.org/10.1111/j.2517-6161.1995.tb02031.x.
- Bergeron, Y., and M. D. Flannigan. 1995. Predicting the effects of climate change on fire frequency in the southeastern Canadian boreal forest. Water, Air, and Soil Pollution 82:437–44. doi:https://doi.org/10.1007/BF01182853.
- Berner, L. T., H. D. Alexander, M. M. Loranty, P. Ganzlin, M. C. Mack, S. P. Davydov, and S. Goetz. 2015. Biomass allometry for alder, dwarf birch and willow in boreal forest and tundra ecosystems of far northeastern Siberia and north-central Alaska. Forest Ecology and Management 337:110–18. doi:https://doi.org/10.1016/j.foreco.2014.10.027.
- Bliss, L. C., and R. W. Wein. 1972. Plant community responses to disturbances in the western Canadian Arctic. Canadian Journal of Botany 50:1097–109. doi:https://doi.org/10.1139/b72-136.
- Boby, L. A., E. A. G. Schuur, M. C. Mack, D. Verbyla, and J. F. Johnstone. 2010. Quantifying fire severity, carbon, and nitrogen emission in Alaska’s boreal forest. Ecological Applications 20:1633–47. doi:https://doi.org/10.1890/08-2295.1.
- Bret-Harte, M. S., M. C. Mack, G. R. Shaver, D. C. Huebner, M. Johnston, C. A. Mojica, C. Pizano, and J. A. Reiskind. 2013. The response of Arctic vegetation and soils following an unusually severe tundra fire. Philosophical Transactions of the Royal Society B-Biological Sciences 368:20120490. doi:https://doi.org/10.1098/rstb.2012.0490.
- Brown, C., and J. F. Johnstone. 2012. One burned, twice shy: Repeat fires reduce seed availabiilty and alter substrate constraints on Picea mariana regeneration. Forest Ecology and Management 266:36–41. doi:https://doi.org/10.1016/j.foreco.2011.11.006.
- Chapin, F. S., III., A. D. McGuire, R. W. Ruess, T. N. Hollingsworth, M. C. Mack, J. F. Johnstone, E. S. Kasischke, E. S. Euskirchen, J. B. Jones, M. T. Jorgenson, et al. 2010. Resilience to climate change in Alaska’s boreal forest. Canadian Journal Forest Research 40 (7):1360–70. doi:https://doi.org/10.1139/X1310-1074.
- Chipman, M. L., V. Hudspith, P. E. Higuera, P. A. Duffy, R. Kelly, W. W. Oswald, and F. S. Hu. 2015. Spatiotemporal patterns of tundra fires: Late-Quaternary charcoal records from Alaska. Biogeosciences 12:4017–27. doi:https://doi.org/10.5194/bg-12-4017-2015.
- Christie, K. S., R. W. Ruess, M. S. Lindberg, C. P. Mulder, and H. Y. H. Chen. 2014. Herbivores influence the growth, reproduction, and morphology of a widespread arctic willow. PLoS One 9:e101716. doi:https://doi.org/10.1371/journal.pone.0101716.
- Dale, V. H., L. A. Joyce, S. McNulty, R. P. Neilson, M. P. Ayres, M. D. Flannigan, P. J. Hanson, L. C. Irland, A. E. Lugo, C. J. Peterson, et al. 2001. Climate change and forest disturbances. Bioscience 51:723–34. doi:https://doi.org/10.1641/0006-3568(2001)051[0723:CCAFD]2.0.CO;2.
- Dyrness, C. T., and R. A. Norum. 1983. The effect of experimental fires on black spruce floors in interior Alaska. Canadian Journal of Forest Research 13:879–93. doi:https://doi.org/10.1139/x83-118.
- Epstein, H. E., J. Beringer, W. A. Gould, A. H. Lloyd, C. D. Thompson, F. S. Chapin III, G. J. Michaelson, C. L. Ping, T. S. Rupp, and D. A. Walker. 2004. The nature of spatial transitions in the Arctic. Journal of Biogeography 31:1917–33. doi:https://doi.org/10.1111/j.1365-2699.2004.01140.x.
- Fetcher, N., T. F. Beatty, B. Mullinax, and D. S. W. 1984. Changes in arctic tussock tundra thirteen years after fire. Ecology 65:1332–33. doi:https://doi.org/10.2307/1938338.
- Forbes, B. C., J. J. Ebersole, and B. Strandberg. 2001. Anthropogenic disturbance and patch dynamics in circumpolar Arctic ecosystems. Conservation Biology 15:954–69. doi:https://doi.org/10.1046/j.1523-1739.2001.015004954.x.
- French, N. H. F., L. K. Jenkins, T. V. Loboda, J. R. Flannigan, L. L. Bourgeau-Chavez, L. L. Bourgeau-Chavez, and M. Whitley. 2015. Fire in arctic tundra of Alaska: Past fire activity, future fire potential, and significance for land management and ecology. International Journal of Wildland Fire 24:1045–61. doi:https://doi.org/10.1071/WF14167.
- Genet, H., Y. He, Z. Lyu, A. D. McGuire, Q. Zhuang, J. Clein, D. D’Amore, A. Bennett, A. L. Breen, F. Biles, et al. 2017. The role of driving factors in historical and projected carbon dynamics of upland ecosystems in Alaska. Ecological Applications 28:5–27. doi:https://doi.org/10.1002/eap.1641.
- Graham, M. H. 2003. Confronting multicollinearity in ecological multiple regression. Ecology 84:2809–15. doi:https://doi.org/10.1890/02-3114.
- Hamann, A., Y. A. El-Kassaby, M. P. Koshy, and G. Namkoong. 1998. Multivariate analysis of allozymic and quantitative trait variation in Alnus rubra: Geographic patterns and evolutionary implications. Canadian Journal of Forest Research 28:1557–65.
- Hewitt, R. E., F. S. Chapin III, T. N. Hollingsworth, and D. L. Taylor. 2017. The potential for mycobiont sharing between shrubs and seedlings to facilitate tree establishment after wildfire at Alaska arctic treeline. Molecular Ecology 26:1–13. doi:https://doi.org/10.1111/mec.13947.
- Hewitt, R. E., T. N. Hollingsworth, D. L. Taylor, and F. S. Chapin III. 2016. Fire-severity effects on plant-fungal interactions after a novel disturbance in the Arctic: Implications for shrub and tree migration? BCM Ecology 16:25. https://doi.org/https://doi.org/10.1186/s12898-016-0075-y.
- Higuera, P. E., L. B. Brubaker, P. M. Anderson, T. A. Brown, A. T. Kennedy, F. S. Hu, and J. Chave. 2008. Frequent fires in ancient shrub tundra: Implications of paleorecords for arctic environmental change. PLoS One 3:e0001744. doi:https://doi.org/10.1371/journal.pone.0001744.
- Higuera, P. E., M. L. Chipman, J. L. Barnes, M. A. Urban, and F. S. Hu. 2011. Variability of tundra fire regimes in Arctic Alaska: Millennial-scale patterns and ecological implications. Ecological Applications 21:3211–26. doi:https://doi.org/10.1890/11-0387.1.
- Hinzman, L., D. L. Kane, K. Yoshikawa, A. Carr, W. R. Bolton, and M. Fraver. 2003. Hydrological variations among watersheds with varying degrees of permafrost. 8th International Conference on Permafrost. A.A. Balkema Publishers, Fairbanks, Alaska. U.S.A.
- Hinzman, L., N. Bettez, W. R. Bolton, F. S. Chapin III., M. Dyurgerov, C. L. Fastie, B. Griffith, R. D. Hollister, A. Hope, H. P. Huntington, et al. 2005. Evidence and implications of recent climate change in northern Alaska and other arctic regions. Climatic Change 72:251–98. doi:https://doi.org/10.1007/s10584-005-5352-2.
- Hobbie, S. E., J. P. Schimel, S. Trumbore, and J. R. Randerson. 2000. Controls over carbon storage and turnover in high-latitude soils. Global Change Biology 6:196–210. doi:https://doi.org/10.1046/j.1365-2486.2000.06021.x.
- Hollingsworth, T. N., J. F. Johnstone, E. Bernhardt, F. S. Chapin III, and K. O. Reinhart. 2013. Fire severity filters regeneration traits to shape community assembly in Alaska’s boreal forest. PLoS One 8:e56033. doi:https://doi.org/10.51371/journal.pone.0056033.
- Hu, F. S., P. E. Higuera, J. E. Walsh, W. L. Chapman, P. A. Duffy, L. B. Brubaker, and M. L. Chipman. 2010. Tundra burning in Alaska: Linkages to climatic change and sea ice retreat. Journal of Geophysical Research-Biogeosciences 115:G04002. doi:https://doi.org/10.1029/2009JG001270.
- Hu, F. S., P. E. Higuera, P. A. Duffy, M. L. Chipman, A. V. Rocha, A. M. Young, R. Kelly, and M. C. Dietze. 2015. Arctic tundra fires: Natural variability and response to climate change. Frontiers in Ecology and the Environment 13:369–77. doi:https://doi.org/10.1890/150063.
- Iversen, C. M., V. L. Sloan, P. F. Sullivan, E. S. Euskirchen, A. D. McGuire, R. Norby, A. P. Walker, J. M. Warren, and S. D. Wullschleger. 2015. Tansley review: The unseen iceberg: Plant roots in arctic tundra. New Phytologist 205:34–58. doi:https://doi.org/10.1111/nph.13003.
- Iwahana, G., K. Harada, S. Uchida, S. Tsuyuzaki, K. Saito, K. Narita, K. Kushida, and L. Hinzman. 2016. Geomorphological and geochemistry changes in permafrost after the 2002 tundra wildfire in Kougarok, Seward Peninsula, Alaska. Journal of Geophysical Research-Earth Surface 121:1697–715. doi:https://doi.org/10.1002/2016JF003921.
- Jandt, R., and C. Meyers. 2000. Recovery of lichen in tussock tundra fire in Northwestern Alaska. in U. S. D. o. t. Interior. Anchorage, Alaska: Bureau of Land Management.
- Johnstone, J. F., T. N. Hollingsworth, and F. S. Chapin III. 2008. A key for predicting postfire successional trajectories in Black Spruce stands of interior Alaska. Gen. Tech. Rep. PNW-GTR-767. Portland, OR: US Department of Agriculture, Forest Service, Pacific Northwest Research Station. 37 p., 767.
- Johnstone, J. F., T. N. Hollingsworth, F. S. Chapin III, and M. C. Mack. 2010. Changes in fire regime break the legacy lock on successional trajectories in Alaskan boreal forest. Global Change Biology 16:1281–95. doi:https://doi.org/10.1111/j.1365-2486.2009.02051.x.
- Joly, K., F. S. Chapin III, and D. R. Klein. 2010. Winter habitat selection by caribou in relation to lichen abundance, wildfires, grazing, and landscape characteristics in northwestern Alaska. Ecoscience 17:321–33. doi:https://doi.org/10.2980/17-3-3337.
- Jones, B. M., A. L. Breen, B. V. Gaglioti, D. H. Mann, A. V. Rocha, G. Grosse, C. D. Arp, M. Kunz, and D. A. Walker. 2013. Identification of unrecognized tundra fire events on the north slope of Alaska. Journal of Geophysical Research Biogeosicences 118:1334–44. doi:https://doi.org/10.1002/jgrg.20113.
- Jones, B. M., C. A. Kolden, R. Jandt, J. T. Abatzoglou, F. Urban, and C. D. Arp. 2009. Fire behavior, weather, and burn severity of the 2007 Anaktuvuk River tundra fire, North Slope, Alaska. Arctic, Antarctic, and Alpine Research 41:309–16. doi:https://doi.org/10.1657/1938-4246-41.3.309.
- Jones, B. M., G. Grosse, C. D. Arp, E. Miller, L. Liu, D. J. Hayes, and C. F. Larsen. 2015. Recent Arctic tundra fire initiates widespread thermokarst development. Scientific Reports 5:15865. doi:https://doi.org/10.1038/srep15865.
- Kruskal, J. B., and M. Wish. 1978. Multidimensional scaling. Beverly Hills: Sage Publications.
- Landhausser, S. M., and R. W. Wein. 1993. Postfire vegetation recovery and tree establishment at the arctic treeline: Climate-change-vegetation-response hypotheses. Journal of Ecology 81:665–72. doi:https://doi.org/10.2307/2261664.
- Lantz, T. C., S. E. Gergel, and G. H. R. Henry. 2010. Response of green alder (Alnus viridis subsp fruticosa) patch dynamics and plant community composition to fire and regional temperature in north-western Canada. Journal of Biogeography 37:1597–610.
- Lantz, T. C., S. V. Kokelj, S. E. Gergel, and G. H. R. Henry. 2009. Relative impacts of disturbance and temperature: Persistent changes in microenvironment and vegetation retrogressive thaw slumps. Global Change Biology 15:1664–75. doi:https://doi.org/10.1111/j.1365-2486.2009.01917.x.
- Liljedahl, A., L. Hinzman, R. Busey, and K. Yoshikawa. 2007. Physical short-term changes after a tussock tundra fire. Seward Peninsula, Alaska. Journal of Geophysical Research 112. doi:https://doi.org/10.1029/2006JF000554.
- Lloyd, A. H., T. S. Rupp, C. L. Fastie, and A. Starfield. 2003. Patterns and dynamics of treeline advance on the Seward Peninsula, Alaska. Journal of Geophysical Research 108:8161. doi:https://doi.org/10.1029/2001JD000852.
- Mack, M. C., M. S. Bret-Harte, T. N. Hollingsworth, R. R. Jandt, E. A. G. Schuur, G. R. Shaver, and D. L. Verbyla. 2011. Carbon loss from an unprecedented Arctic tundra wildfire. Nature 475:489–92. doi:https://doi.org/10.1038/nature10283.
- Masrur, A., A. N. Pretrov, and J. De Groote. 2018. Circumpolar spatio-temporal patterns and contributing climatic factors of wildfire activity in the Arctic tundra from 2001-2015. Environmental Research Letters 13:014019. doi:https://doi.org/10.1088/1748-9326/aa9a76.
- Mather, P. M. 1976. Computional methods of multivariate analysis in physical geography. London: Wiley & Sons.
- McCune, B., and J. B. Grace. 2002. Analysis of ecological communities. Gleneden Beach: MjM Software Design.
- McCune, B., and M. J. Mefford. 2017. PC-ORD. Multivariate analysis of ecological data, version 7. MjM Software Design, Gleneden Beach.
- Mekonnen, Z. A., W. Riley, and R. F. Grant. 2018. Accelerated nutrient cycling and increased light competition will lead to 21st century shrub expansion in North American tundra. Journal of Geophysical Research Biogeosicences 123:1683–701. doi:https://doi.org/10.1029/2017JG004319.
- Melvin, A. P., J. Murray, B. Boehlert, J. A. Martinich, L. Rennels, and T. S. Rupp. 2017. Estimating wildfire response costs in Alaska’s changing climate. Climatic Change 141:783–95. doi:https://doi.org/10.1007/s10584-017-1923-2.
- Moritz, M. A., M.-A. Parisien, E. Batllori, M. A. Krawchuk, J. Van Dorn, D. J. Ganz, and K. Hayhoe. 2012. Climate change and disruptions to global fire activity. Ecosphere 3:49. doi:https://doi.org/10.1890/ES11-00345.1.
- Myers-Smith, I. H., B. C. Forbes, M. Wilmking, M. Hallinger, T. Lantz, D. Blok, K. D. Tape, M. Macias-Fauria, U. Sass-Klaassen, E. Levesque, et al. 2011. Shrub expansion in tundra ecosystems: Dynamics, impacts and research priorities. Environmental Research Letters 6:045509. doi:https://doi.org/10.1088/1748-9326/6/4/045509.
- Myers-Smith, I. H., D. S. Hik, and R. Aerts. 2017. Climate warming as a drive of shrubline advance in high-latitude alpine tundra. Journal of Ecology 106:547–60. doi:https://doi.org/10.1111/1365-2745.12817.
- Narita, K., K. Harada, K. Saito, Y. Sawada, M. Fukuda, and S. Tsuyuzaki. 2015. Vegetation and permafrost thaw depth 10 years after a tundra fire in 2002, Seward Peninsula, Alaska. Arctic, Antarctic, and Alpine Research 47:547–59. doi:https://doi.org/10.1657/AAAR0013-031.
- Natali, S. M., E. A. G. Schuur, and R. Rubin. 2012. Increased plant productivity in Alaskan tundra as a result of experimental warming of soil and permafrost. Journal of Ecology 100:488–98. doi:https://doi.org/10.1111/j.1365-2745.2011.01925.x.
- Pinheiro, J., D. Bates, S. DebRoy, and D. Sarkar, and R. C. Team. 2017. nlme: Linear and nonlinear mixed effects models. R package version 3.1-131. https://CRAN.R-project.org/package=nlme
- R Core Team. 2016. R: A language and environment for statistical computing. Vienna, Austria: R Foundation for Statistical Computing.
- Racine, C. 1981. Tundra fire effects on soils and three plant communities along a hill-slope gradient in the Seward Peninsula, Alaska. Arctic 34:71–84. doi:https://doi.org/10.14430/arctic2508.
- Racine, C., J. Dennis, and W. I. Patterson. 1985. Tundra fire regimes in the Noatak River watershed, Alaska: 1956-83. Arctic 85:194–200.
- Racine, C., and J. H. Anderson. 1979. Flora and vegetation of the Chukchi-Imuruk area. Biology and resource management program. Alaska Cooperative Park Studies Unit, University of Alaska, Fairbanks.
- Racine, C., J. L. Barnes, R. Jandt, and J. Dennis. 2010. Long-term monitoring of 1977 tundra fires in the Northwest Alaska parks. Alaska Parkland Science 9:24–25.
- Racine, C., L. A. Johnson, and L. A. Viereck. 1987. Patterns of vegetation recovery after tundra fires in northwestern Alaska, USA. Arctic, Antarctic, and Alpine Research 19:461–69. doi:https://doi.org/10.2307/1551412.
- Racine, C., R. Jandt, C. Meyers, and J. Dennis. 2004. Tundra fire and vegetation change along a hillslope on the Seward Peninsula, Alaska, USA. Arctic, Antarctic, and Alpine Research 36:1–10. doi:https://doi.org/10.1657/1523-0430(2004)036[0001:TFAVCA]2.0.CO;2.
- Ratajczak, Z., J. B. Nippert, and T. W. Ocheltree. 2014. Abrupt transition of mesic grassland to shrubland: Evidence for thresholds, alternative attractors, and regime shifts. Ecology 95:2633–45. doi:https://doi.org/10.1890/13-1369.1.
- Raynolds, M. K., D. A. Walker, and H. A. Maier. 2005. Plant community-level mapping of arctic Alaska based on the Circumpolar Arctic Vegetation Map. Phytocoenologia 35:821–48. doi:https://doi.org/10.1127/0340-269X/2005/0035-0821.
- Rupp, T. S., A. M. Starfield, and F. S. Chapin. 2000. A frame-based spatially explicit model of subarctic vegetation response to climatic change: Comparison with a point model. Landscape Ecology 15:383–400. doi:https://doi.org/10.1023/A:1008168418778.
- Rupp, T. S., P. A. Duffy, M. Leonawicz, M. Lindgren, A. L. Breen, T. Kurkowski, A. Floyd, A. Bennett, and L. Krutikov. 2016. Climate scenarios, land cover, and wildfire in Alaska. U.S. Geological Survey.
- San-Miguel, I., N. C. Coops, R. D. Chavardes, D. W. Andison, and P. D. Pickell. 2020. What controls fire spatial patterns? Predictability of fire characteristics in the Canadian boreal plains ecozone. Ecosphere 11:e02985. doi:https://doi.org/10.1002/ecs2.2985.
- Schimmel, J., and A. Granstrom. 1996. Fire severity and vegetation response in boreal Swedish forest. Ecology 77:1436–50. doi:https://doi.org/10.2307/2265541.
- Soja, A. J., N. M. Tchebakova, N. H. F. French, M. D. Flannigan, H. H. Shugart, B. J. Stock, A. I. Sukhinin, E. I. Parfenova, F. S. Chapin III, and P. W. Stackhouse Jr. 2006. Climate-induced boreal forest change: Predictions versus current observations. Global and Planetary Change. doi:https://doi.org/10.1016/j.gloplacha.2006.07.028.
- Tape, K., M. Sturm, and C. Racine. 2006. The evidence for shrub expansion in Northern Alaska and the Pan-Arctic. Global Change Biology 12:686–702. doi:https://doi.org/10.1111/j.1365-2486.2006.01128.x.
- Thompson, D. P., and P. S. Barboza. 2014. Nutritional implications of increased shrub cover for caribou (Rangifer tarandus) in the Arctic. Canadian Journal of Zoology 92:339–51. doi:https://doi.org/10.1139/cjz-2013-0265.
- Tsuyuzaki, S., G. Iwahana, and K. Saito. 2017. Tundra fire alters vegetation patterns more than the resultant thermokarst. Polar Biology 41:753–61. doi:https://doi.org/10.1007/s00300-017-2236-7.
- Turner, M. G. 2010. Disturbance and landscape dynamics in a changing world. Ecology 91:2833–49. doi:https://doi.org/10.1890/10-0097.1.
- Viereck, L. A., C. T. Dyrness, C. T. Batten, and K. J. Wenzlick. 1992. The Alaska vegetation classification. PNW-GTR-286. U.S. Department of Agriculture, Forest Service, Portland, OR.
- Walker, D. A., F. J. A. Daniëls, N. V. Matveyeva, J. Šibík, M. D. Walker, A. L. Breen, L. A. Druckenmiller, M. K. Raynolds, H. Bültmann, S. Hennekens, et al. 2018. Circumpolar Arctic vegetation classification. Phytocoenologia 48:181–201. doi:https://doi.org/10.1127/phyto/2017/0192.
- Walker, D. A., and M. D. Walker. 1991. History and pattern of disturbance in Alaskan Arctic terrestrial ecosystems: A hierarchical approach to analysing landscape change. Journal of Applied Ecology 28:244–76. doi:https://doi.org/10.2307/2404128.
- Walker, X. J., M. D. Frey, A. J. Conway, M. Jean, J. F. Johnstone, and B. Bond-Lamberty. 2017. Impacts of fire on non-native plant recruitment in black spruce forest of interior Alaska. PLoS One 12:e0171599. doi:https://doi.org/10.1371/journal.pone.0171599.
- Young, A. M., P. E. Higuera, P. A. Duffy, and F. S. Hu. 2017. Climatic thresholds shape northern high-latitude fire regimes and imply vulnerability to future climate change. Ecography 40:606–17. doi:https://doi.org/10.1111/ecog.02205.