
THE ISSUE
In recent decades, the pace of Arctic warming was at least double that of the globe. A growing body of research suggests this differential warming may increase the frequency of extreme weather events in the United States and elsewhere in the northern hemisphere.
WHY IT MATTERS
Extreme weather events cause billions of dollars in damage, scores of deaths and injuries, and thousands of disrupted lives each year. The frequency of these events is increasingCitation1, some of which – such as heatwaves, droughts, wildfires, and heavy precipitation events – have clear links to climate change. Some recent studies suggest rapid Arctic warming will favor more persistent weather regimes that exacerbate these and other disruptive weather regimes, the subject of many headlines across the northern hemisphere in recent years.
STATE OF KNOWLEDGE
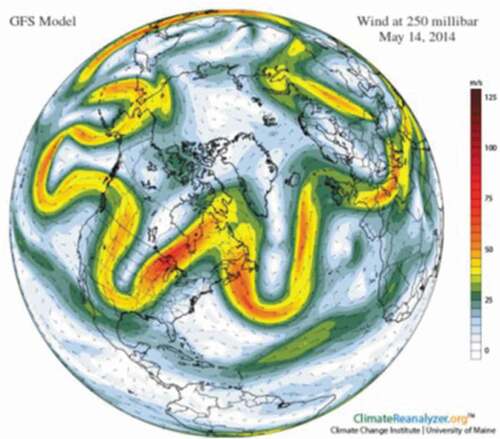
The major wind systems of the globe are driven by temperature differences; the polar jet stream exists primarily because the Arctic is much colder than regions farther south, the so-called midlatitudes. The larger the temperature difference, the stronger the jet stream. Any changes that affect the Earth’s temperature patterns will also affect jet streams (note there are polar and sub-tropical jet streams in both northern and southern hemispheres), and because jet streams create and steer weather patterns, those changes will also affect midlatitude weather. The dramatic Arctic warming during recent decades () is reducing this temperature difference, which is weakening the jet stream’s west-to-east winds in midlatitudesCitation2. Instead of a coherent river of strong winds, a weaker jet tends to waver, split, and wander north and southward () on its path around the northern hemisphereCitation2. These wavier jet streams are responsible for a variety of extreme weather eventsCitation3, which have become more frequent in North America and Asia.
Figure 1. Trends in mean surface air temperature over the period 1960 to 2019. Notice that the Arctic is red, indicating that the trend over this 60-year period is for an increase in air temperature of nearly 4°C (7.2° F) across much of the Arctic, which is larger than for other parts of the globe. The graph in part b presents linear trends over the period by latitude. – Credit: NASA GISS.
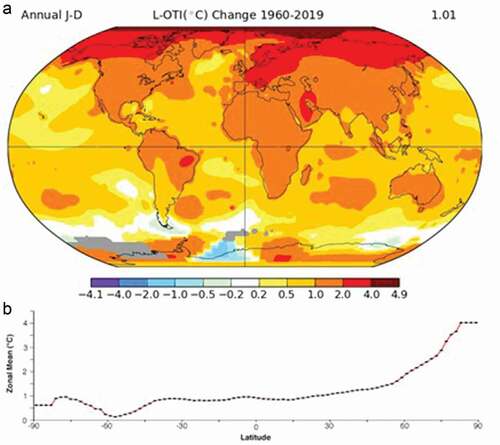
Figure 2. Wandering jet stream on May 14, 2014. Colors represent wind at 250 millibars from the GFS Model. (Credit: Climate Change Institute).
Understanding linkages between amplified Arctic warming and midlatitude weather is a rapidly evolving field of research. New evidence suggests that diminished sea ice and associated warming in particular regions and seasons has distinct effects on weather extremes. Ice loss and warming north of Alaska, for example, allows extra summer sunshine to warm those waters. Come autumn, that heat is released back into the atmosphere, which can intensify northward swings in the jet stream – known as ridges – in the area of ice lossCitation4. The so-called “Ridiculously Resilient Ridge,” which is largely responsible for California’s ongoing extreme drought, is likely strengthened by abnormal warmth near Alaska. Like a whipped jump rope, the effect downstream is a more southerly jet excursion – or trough – which allows cold air to plunge into eastern states. Larger jet waves tend to linger in one place, favoring persistent weather patterns: relatively warm and dry under the ridge, cold and stormy in the trough. Prolonged summer heat waves and flooding caused by slow-moving storms may also get a boost from the Arctic meltdownCitation5.
WHERE THE RESEARCH IS HEADED
While some mechanisms linking the rapidly warming Arctic and changes in mid-latitude weather are becoming clearer – such as persistent winter cold spells in East Asia associated with upstream sea-ice loss and warming in the Barents/Kara seas – all others are more controversial and difficult to identify because the atmosphere is such a chaotic beastCitation6. Challenges also arise because the era of rapid Arctic warming began only a decade or two ago, other changes in the climate system are happening simultaneously and perhaps in opposition, natural fluctuations (such as El Niños/La Niñas) obscure signals, and Arctic influences are often regional and intermittentCitation6. Standard analysis methods that average over large areas or time periods may smear unusual jet features that don’t appear in the same location each year. Computer models of the climate system struggle to realistically simulate very wavy jet features, persistent weather patterns, complex Arctic processes, and the vertical extent of Arctic warming, thus their utility for studying mechanisms of Arctic/mid-latitude linkages is imperfect. Simulation-based, average-response studies, such as the oral presentation highlighted by P. Voosen in Science (see supplemental references), do not address connections between disproportionate Arctic warming and midlatitude weather extremes, which arguably are more relevant for society. What is abundantly clear, however, is that the Arctic is continuing to lose ice and warm rapidly, which according to basic meteorological theory will affect large-scale atmospheric wind patterns. The outstanding questions involve identifying the various mechanisms linking rapid Arctic warming to particular weather regimes and extremes, connections that vary depending on the region, season, and background conditions.
Supplemental Material
Download MS Word (184.8 KB)Supplementary material
Supplemental material for this article can be accessed on the publisher’s website
Additional information
Funding
Key references
- Mann, M. E., S. Rahmstorf, K. Kornhuber, B. A. Steinman, S. K. Miller, S. Petri, and D. Coumou. 2018. Projected changes in persistent extreme summer weather events: The role of quasi-resonant amplification. Science Advances 4 (10):eaat3272. doi:https://doi.org/10.1126/sciadv.aat3272.
- Munich, R. E. 2018. Data on natural disasters since 1980. https://www.munichre.com/en/solutions/for-industry-clients/natcatservice.html.
- Overland, J. E., T. Ballinger, J. Cohen, J. A. Francis, E. Hanna, R. Jaiser, B.-M. Kim, S.-J. Kim, J. Ukita, T. Vihma, et al. 2021. How do intermittency and simultaneous processes obfuscate the Arctic influence on midlatitude winter extreme weather events? Environmental Research Letters 16 (4):043002. doi:https://doi.org/10.1088/1748-9326/11/8/084016.
- Screen, J. A., and I. Simmonds. 2014. Amplified mid-latitude planetary waves favour particular regional weather extremes. Nature Climate Change 4 (8):704–09. doi:https://doi.org/10.1038/nclimate2271.
- Sung, M.-K., B.-K. Kim, E.-H. Baek, Y.-K. Lim, and S.-J. Kim. 2016. Arctic-North Pacific coupled impacts on the late autumn cold in North America. Environmental Research Letters 11 (8):084016. doi:https://doi.org/10.1088/1748-9326/11/8/084016.
- Vavrus, S. J. 2018. The influence of Arctic amplification on mid-latitude weather and climate. Current Climate Change Reports 4 (3):238–49. doi:https://doi.org/10.1007/s40641-018-0105-2.