
ABSTRACT
Two different biostratigraphic approaches are used to identify Marine Isotope Stage 11 (MIS 11) in Arctic Ocean sediments. On the Lomonosov Ridge, globally calibrated nannofossil bioevents constrain the age of sediments back to MIS 13 (Core LOMROG12-3PC). In the Amerasian Basin the unique occurrence of the planktonic foraminifer Turborotalita egelida is increasingly used as a marker for MIS 11. However, the T. egelida horizon has only been dated using cyclostratigraphy. Here we bridge these approaches through investigation of a new core (AO16-8GC) from the Alpha Ridge, Amerasian Basin. AO16-8GC is easily correlated to LOMROG12-3PC and contains the T. egelida horizon, allowing the first comparison between the biostratigraphy of both regions. Based on the nannofossil biochronology of LOMROG12-3PC, the most convincing lithologic correlation between the Alpha and Lomonosov Ridge cores places the T. egelida horizon between MIS 15 and MIS 17. This potentially older age for the T. egelida biohorizon emphasizes the need for continued caution in interpreting paleoceanographic records predating MIS 6, until further work can reconcile the nanno- and microfossil biostratigraphies that are emerging for middle Pleistocene sediments of the central Arctic Ocean.
Introduction
Rapid warming and loss of sea ice in the Arctic Ocean are among the most prominent expressions of current climate change. To put modern changes into a longer-term context, studies of arctic paleoclimate are required. However, the development of a solid stratigraphic framework with accurate age models in the Arctic Basin has lagged behind that of the Pacific and Atlantic basins (Backman et al. Citation2004). Firstly, this is due to challenges associated with Arctic research (e.g., perennial sea ice and a narrow fieldwork season) and, secondly, because the toolkit available for dating sediments is substantially more limited in the Arctic (Backman et al. Citation2004; O’Regan et al. Citation2020). Dating Arctic sediments is difficult because (1) biostratigraphy is hampered by the limited diversity of calcareous microfossils (Backman et al. Citation2004), (2) magnetostratigraphy is notoriously challenging near the North Pole (Xuan et al. Citation2012; Wiers et al. Citation2019; Channell, Singer, and Jicha Citation2020), (3) chemostratigraphy based on oxygen isotopes measured in foraminifera is complicated by discontinuous occurrence of foraminiferal species and meltwater effects (Stein et al. Citation1994), and (4) cyclostratigraphy using lithological changes and physical properties is “floating” in time without any concrete age–depth tie points (Jakobsson et al. Citation2000).
Nevertheless, age models have been developed assigning Marine Isotope Stages (MIS) to the alteration of dark brown and yellow-gray lithological units that are typically found on the main ridges of the Arctic Ocean. These age models are largely reliant on cyclostratigraphy based on lithologic variability (Jakobsson et al. Citation2000; O’Regan et al. Citation2008; Wang et al. Citation2018) or stacked records of microfossil abundances (Polyak et al. Citation2013; Marzen, DeNinno, and Cronin Citation2016). These approaches are based on the concept that glacial/stadial and interglacial/interstadial sediments have distinct and generally readily identifiable facies. For example, across much of the Arctic, modern (Holocene) and previous interglacial/interstadial sediments are characterized by bioturbation, relatively fine grain size (silty clay), presence of microfossils, manganese (Mn) enrichment, and a dark brown color (Jakobsson et al. Citation2000; O’Regan et al. Citation2008; Löwemark et al. Citation2012), though Mn in sediments with gas hydrates might be reworked (Sundby et al. Citation2015). However, cyclostratigraphic dating methods are subject to a relatively high degree of uncertainty, in the sense that they generally leave room for shifting the older part of their chronology by one or two glacial–interglacial cycles due to ambiguity in confidently identifying interglacials (glacials) from interstadials (stadials)—or MIS from MIS substages (O’Regan et al. Citation2020). Furthermore, though recurrent lithologic facies can be convincingly correlated over large regions of the Arctic, there tend to be regional depositional influences that prevent basin-wide lithostratigraphic correlations (Sellén, O’Regan, and Jakobsson Citation2010). For example, whereas downcore lithologic variations over large portions of the Lomonosov Ridge are relatively easy to correlate, it has been more difficult to extend this to core sequences in the Amerasian Basin, including those from the Northwind Ridge, Mendeleev Ridge, and Alpha Ridge (Sellén, O’Regan, and Jakobsson Citation2010; Stein et al. Citation2010).
On the Alpha Ridge, an important development in the late Quaternary age model is the tying of lithostratigraphic variations and biostratigraphic markers in sediment cores ARC3-B84A and ARC-B85A to sediments from the Northwind Ridge (Wang et al. Citation2018; ). A key element in this approach is the use of a distinct planktonic foraminifer biohorizon dominated by the morphospecies Turborotalita egelida (sensu Herman Citation1974; Cronin et al. Citation2014), which is increasingly being viewed as a unique marker for MIS 11 (Cronin et al. Citation2014, Citation2019; Wang et al. Citation2018). Wang et al. (Citation2018) further tuned the chronology by correlating the stacked Alpha Ridge record of bulk XRF manganese, calcium (Ca), and zirconium (Zr) to global stable isotope (LR04-δ18O), sea-level stacks, and orbital parameters (Wang et al. Citation2018).
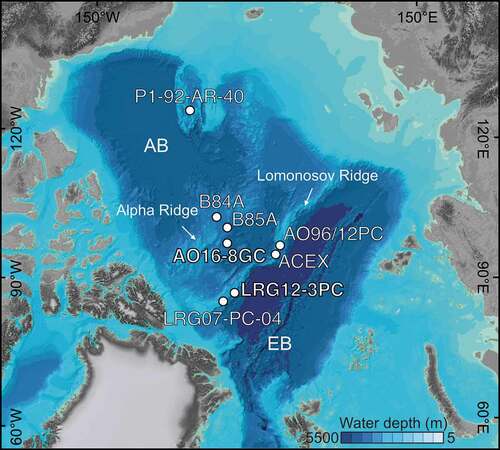
Figure 1. Map of the Arctic Ocean (Jakobsson et al. Citation2012), with indication of core sites discussed in this study. AB = Amerasian Basin, EB = Eurasian Basin. Core names are abbreviated in the map; full core names are AO16-8GC (this study), LOMROG12-3PC, (O’Regan et al. Citation2020), and ARC3-B84A and ARC-B85A (Wang et al. Citation2018).
On the Lomonosov Ridge, an earlier established middle–late Quaternary (MIS 11–present, 243–0 ka) chronology (Jakobsson et al. Citation2001; Spielhagen et al. Citation2004; O’Regan et al. Citation2008) was recently supported using nannofossil biostratigraphy (O’Regan et al. Citation2020). In particular, two calcareous nannofossil taxa that have globally calibrated biozonations were found in core LOMROG12-3PC: Pseudoemiliania lacunosa, a species that went extinct during MIS 12, and Emiliania huxleyi, a species that evolved during MIS 8 (Thierstein et al. Citation1977). This provided the first unequivocal support for Pleistocene chronologies for sediments on the Lomonosov Ridge predating MIS 5 (O’Regan et al. Citation2020) and an independently anchored reference against which other chronological methods can be tested.
In this study, we provide the first direct lithologic and biostratigraphic correlation between Alpha Ridge sediments and (central) Lomonosov Ridge sediments. This correlation is used to test whether the newly proposed nannofossil-based chronology on the Lomonosov Ridge (O’Regan et al. Citation2020) is consistent with the existing foraminifer-based biostratigraphic age model on the Alpha Ridge (Wang et al. Citation2018).
Methods
Core collection and measurements
Core AO16-8GC (86.779° N, 39.357° W, 3.59 m length) was collected at 2,620 m water depth during the 2016 Arctic Ocean cruise with icebreaker IB Oden (, ). A gravity corer with an inner/outer diameter of 100/110 mm was used during sampling. The core was cut into 1.5-m sections on the aft of the ship and brought into the laboratory to equilibrate with room temperature. Bulk density and magnetic susceptibility were logged on a Geotek Multi-Sensor Core Logger (MSCL) at a downcore resolution of 1 cm. Magnetic susceptibility was measured with a 125-mm Bartington loop sensor using a 1-second acquisition time. The core was then split and described on board before being curated and stored in a refrigerated container.
Table 1. Core sites discussed in this study
After the expedition, digital images and measurements of X-ray fluorescence were obtained with an ITRAX XRF core scanner at the Department of Geological Sciences, Stockholm University. The archive half of the core was scanned using a molybdenum tube set at 55 kV and 50 mA with a step size of 2 mm and an exposure time of 25 seconds. To produce analytically reliable counting statistics and remove background noise, the elemental data were normalized by Zr, a conservative element commonly found in weathering-resistant minerals (Rothwell and Croudace Citation2015). To optimize the original core photos, contrast, brightness, and saturation were increased (). This optimization changes dark brown to red colors and beige to yellow colors. Outliers from the MSCL and XRF measurements, related to the edges of core sections (top and bottom), were removed. Sediment core LOMROG12-3PC (87.724° N, 54.425° W, 1607 m water depth) was previously presented by O’Regan et al. (Citation2020), where the corresponding methodology regarding XRF scanning, MSCL, and coccolith analysis are found. Differences in the resolution of the magnetic susceptibility originate from a smaller core and magnetic susceptibility loop sensor diameter for core LOMROG12-3PC.
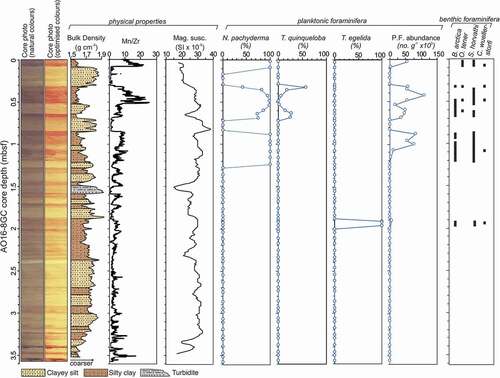
Figure 2. Core imagery (natural and optimized colors) and lithology of AO16-8GC, together with downcore changes in physical properties and variations in foraminiferal composition. Percentages of planktic foraminifera are calculated relative the total planktic foraminifer assemblage. P.F. = planktonic foraminifera. B. arctica = Bolivina arctica, O. tener = Oridorsalis tener, S. horvathi = Stetsonia horvathi, C. wuellerstorfi = Cibicidoides wuellerstorfi.
Microfossil analysis
Sediment samples of 2-cm width (10 cm3) were obtained from the core every 10 cm. To increase the resolution of interglacial intervals, additional sediment samples of 1-cm width (5 cm3) were obtained in the dark brown intervals from the working half of the cores, which are archived in the cold storage room (7°C–8°C) at the department of Geological Sciences, Stockholm University. The samples were sieved over a 63-µm-mesh sieve, dried in an oven (<40°C), weighed, and transferred to glass vials. Counts of planktonic foraminifera were made on the dried >63 µm fraction to document downcore species distribution. Analysis of the >63 µm is important because Arctic populations of some species (e.g., T. quinqueloba) are small and might be missed in larger size fractions (O’Regan et al. Citation2019). To ensure statistical significance, sample sizes of a minimum of 300 tests were counted. This was achieved by splitting samples one or more times using a microsplitter (ASC Scientific MS-1). Identification and counting of foraminifers were performed using a Leica M205C microscope. Different morphotypes of Neogloboquadrina pachyderma were observed but not differentiated in the counts. Due to the low numbers of benthic foraminifera (<5 percent of the total foraminifer composition), we simply indicate the occurrence of benthic species throughout the core rather than calculating changes in abundance percentages of the different species ().
Scanning electron microscope (SEM) imaging was carried out to document taxonomic concepts and microfossil preservation quality. The SEMs used were a JSM-7000 F SEM for Turborotalita species (accelerating voltage = 10 kV, working distance = 9.9 mm) and a TM 3000 for N. pachyderma and benthic foraminifera. Both SEMs are housed in the Department of Materials and Environmental Chemistry, Stockholm University. The specimens were mounted on sticky carbon disks and gold coated before analysis (2 × 60 seconds, applied current of 20 mA).
Results
Lithological description
Overall, core AO16-8GC consists of alternations of dark brown intervals with lighter, beige-colored intervals (). The dark brown intervals in the upper 1.02 m below seafloor (mbsf) are noticeably more pronounced (darker) than those deeper in the stratigraphy (1.03–3.5 mbsf). The dark brown layers are high in Mn and have a relatively fine grain size (clayey silt) and low bulk density. Conversely, the lighter intervals are low in Mn, are coarser (silty to gravelly clay), and have a higher bulk density. In the central Arctic Ocean, bulk density has been shown to be a proxy for grain size: High bulk densities are associated with coarser-grained sediments (O’Regan et al. Citation2019). The bulk density profile is therefore displayed as a measure for grain size (). The dark brown interval between 0.33 and 0.69 mbsf consists of three intervals: the first at 0.32 to 0.52 mbsf constitutes the darkest sequence with relatively low bulk density. Between 0.52 and 0.62 mbsf, sediments are lighter colored and have a higher bulk density. The third and thinnest interval, between 0.66 and 0.68 mbsf, has a color and grain size similar to those of the first interval. At 1.50 to 1.59 mbsf, a grayish interval with very low magnetic susceptibility and high bulk density stands out. This unit displays a coarse base and a marked fining-upwards trend. This interval therefore represents turbidite deposition that interrupts the dark brown interval between 1.46 and 1.65 mbsf.
The characteristics of the dark brown and beige layers are typical of interglacial and glacial units, respectively, commonly found in the Arctic Ocean (Jakobsson et al. Citation2000; O’Regan et al. Citation2008). The ratio of Mn/titanium (Ti) is typically used in the Arctic to trace glacial/interglacial cycles (e.g., O’Regan et al. Citation2019; Xiao et al. Citation2020). Here we normalize Mn over Zr because this ratio slightly enhances the contrast between glacial/interglacial intervals compared to the Mn/Ti ratio; Zr is a weathering-resistant mineral that is enriched in the coarse fraction. For example, Zr was previously used as a marker for glacial intervals (Xiao et al. Citation2020) and has been shown to have a strong correlation with the coarse silt and sand fraction in sediments from the Lomonosov Ridge (O’Regan et al. Citation2019). Nevertheless, it should be taken into account that the Mn variability is very pronounced in central Arctic Ocean sediments compared to other elements; its coefficient of variation (CoV) is typically markedly higher than that of other elements (e.g., in core AO16-8GC; CoVMn = 0.75, CoVTi = 0.16, and CoVZr = 0.18). Therefore, the normalization of Mn counts influences the relative variability of Mn only marginally.
Despite the importance of Mn cycles, sedimentary controls on Mn deposition in the central Arctic Ocean are not yet fully understood. It was originally suggested that increases in Mn could be related to either enhanced riverine input during interglacials/interstadials or to more oxic bottom water conditions (Jakobsson et al. Citation2000; Löwemark et al. Citation2012; Alexanderson et al. Citation2014). However, the main mechanism by which Mn reaches the central Arctic Ocean might be resuspension and transportation of Mn by ocean currents, after its initial deposition on the continental shelves. This suggests that sea level changes play an important role in controlling Mn deposition (Ye et al. Citation2019). The element Zr is likely sourced from the Eurasian continent and transported as ice-rafted debris (Xiao et al. Citation2020).
Foraminifera
Planktonic and benthic foraminifera show discontinuous and pulsed occurrences through the upper 2 m of the core but disappear below this level (). They are typically well preserved, although at times tests are fragmented, implying some degree of postmortem calcite dissolution (Plate 1). Planktonic foraminifera are most abundant in dark brown intervals in the upper 1 m. Neogloboquadrina pachyderma typically dominates assemblages but there is important variability. In the modern ocean, N. pachyderma is by far the most common planktonic foraminifer of the Arctic region and thrives in areas that are influenced by sea ice (e.g., Volkmann Citation2000; Schiebel et al. Citation2017).
The uppermost dark brown unit (0.0–0.08 mbsf) has the highest planktonic foraminiferal abundance and consists of 100 percent N. pachyderma. The second dark brown interval downcore (0.31–0.51 mbsf) comprises both N. pachyderma with significant contributions of T. quinqueloba (10–60 percent). The abundance of T. quinqueloba is highest at the top of this interval, decreases toward the middle, and increases again toward the bottom (). In the modern Atlantic–Arctic region, T. quinqueloba lives predominantly in the subpolar North Atlantic and fringing Arctic seas, where warmer Atlantic-derived waters meet the sea ice edge (Carstens, Hebbeln, and Wefer Citation1997; Volkmann Citation2000). The observed T. quinqueloba specimens are rather small (maximum diameter ca. 100 µm), thus emphasizing the importance of analyzing the >63 µm fraction in this region. The dark brown layers at 0.83 to 1.01 mbsf and 1.05 to 1.20 mbsf are again dominated by N. pachyderma ().
The planktonic foraminiferal assemblage between 1.87 and 1.98 mbsf is very different to the upper horizons, being composed entirely of T. egelida, without N. pachyderma. The key characteristics of the morphotypes here assigned to T. egelida are the visibly “open” and rather deep umbilicus, relatively evolute coiling, and lack of an elongated final chamber. This is consistent with the taxonomic concept of T. egelida sensu Herman (Citation1974, Citation1980) and Cronin et al. (Citation2014). In contrast, T. quinqueloba is distinguished by an elongate final chamber that extends into the aperture, covering the umbilical region (Plate 1). Neither of the Turborotalita morphotypes show evidence of gametogenic calcification, which is typical of T. quinqueloba in subpolar regions (e.g., Schiebel et al. Citation2017). Importantly, Turborotalita egelida is sometimes difficult to differentiate from the weakly calcified 4.5-chambered morphotype of N. pachyderma (Plate 2). The elongate final chamber of T. quinqueloba makes it relatively straightforward to separate turborotalitids (Plate 1). However, the lightly calcified N. pachyderma morphotype can look extremely similar to T. egelida under the light microscope and even in whole-specimen-view SEM images (Plates 1 and 2). Their test size appears similar, although the significance of this needs to be tested with a statistical morphological analysis. In this case, high-resolution SEM images are needed to reveal the test wall texture type, a primary feature that underpins planktonic foraminifera classification and taxonomy (Hemleben et al. Citation1991, Citation2018). In doing so, we can observe the spinose wall of Turborotalita egelida, defined by pronounced pustules bearing a spine (= spine bases), or spine holes (the spines themselves missing; Plate 2), compared to low pustules and/or coalescing pustules that do not bare spines (non-spinose) in the weakly calcified N. pachyderma (Plate 2; Hemleben et al. Citation1991). Light microscope indicators of these differences include a “bumpy,” “furry-looking” appearance of the test in T. egelida (corresponding to the separate spine bases) and a more lobulate peripheral outline, whereas the N. pachyderma morphotype can appear more “shiny/reflective,” have a less lobed outline, and typically have straighter sutures (see Eynaud et al. Citation2009). We emphasize that these features can be difficult to see without SEM imaging and/or where dissolution obscures wall texture details.
The T. egelida tests are fragile, with many broken tests present. In the Arctic Ocean, T. egelida (originally identified as Globigerina exumbilicata Herman Citation1974) has been identified in subsurface sediments on the Northwind Ridge and Mendeleev Ridge (Herman Citation1974; Polyak et al. Citation2013; Cronin et al. Citation2014), Alpha Ridge (Wang et al. Citation2018), and Lomonosov Ridge just north of Greenland (Cronin et al. Citation2014) based on similar criteria. Whether our T. egelida taxonomic concept can be used to consistently discriminate these species in different geographic settings remains uncertain (O’Regan et al. Citation2019) and warrants a wider analysis of morphology both in polar and subpolar regions.
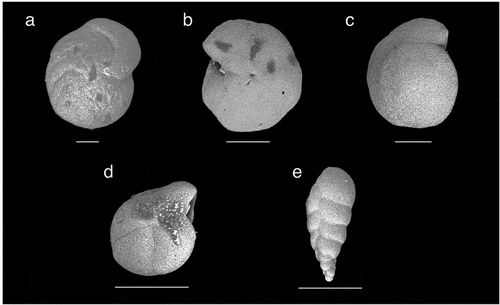
Key species of benthic foraminifers that have been previously used for biostratigraphy in the Arctic Ocean (Ishman, Polyak, and Poore Citation1996) include Bolivina arctica and Oridorsalis tener (Plate 3). These species are found in core AO16-8GC, although in very low abundances (abundance of benthic foraminifers is generally <5 percent of the total foraminifer assemblage). Oridorsalis tener is found between 0.02 and 0.09 mbsf and in the top and bottom of the dark brown interval spanning 0.32 to 0.60 mbsf (). Bolivina arctica is found at 0.40 to 0.70 mbsf and 0.90 to 1.13 mbsf. Stetsonia horvathi occurs in all of the dark brown intervals that are rich in planktonic foraminifera (), together with scarce Cibicidoides wuellerstorfi.
Discussion
We attempt to construct a chronology for AO16-8GC using lithostratigraphic correlation to core LOMROG12-3PC as a reference section (). This approach has the advantage that the upper part of LOMROG12-3PC is anchored in time by globally recognized and calibrated coccolithophore evolutionary events (O’Regan et al. Citation2020). The presence of E. huxleyi, which evolved during MIS 8 (300–243 ka), was used to assign its first occurrence in LOMROG12-3PC to MIS 7. Additionally, the identification of P. lacunosa, a species that went extinct in MIS 12 (478–424 ka), is used to constrain the position of MIS 11 in this core (). Below MIS 11, the chronology is based on recurrent interglacial facies and becomes rather tentative below MIS 14 as lithological changes useful for delineating MIS stages become less pronounced, and no other biostratigraphic markers have been found. The MIS stages older than MIS 14 in LOMROG12-3PC are therefore indicated with a question mark ().
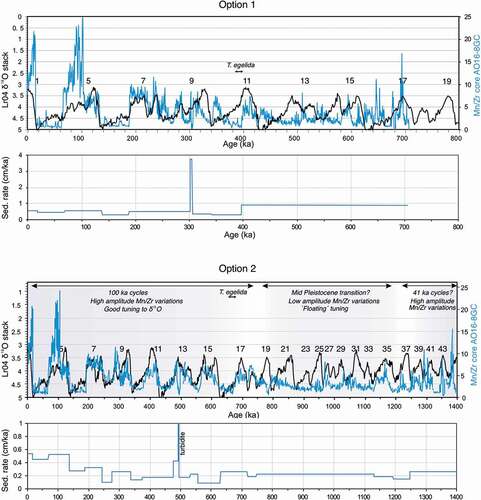
Figure 3. Presentation of two options for tying AO16-8GC to LOMROG12-3PC, leading to different MIS stratigraphies for AO16-8GC. Downcore variations in nannofossil composition of LOMROG12-3PC and planktonic foraminiferal composition and key benthic species of AO16-8GC are also presented. In option 1 (left), the T. egelida interval in AO16-8GC is correlated with the MIS 11 interval in LOMROG12-3PC. Dotted lines indicate the tentative correlation of lithologic units that follows from this. In option 2 (right), a coherent lithostratigraphic correlation between AO16-8GC to LOMROG12-3PC is presented. Tu = Turbidite. Correlation of LOMROG12-3PC to the well-studied cores AO96/12-1PC and ACEX can be found in O’Regan et al. (Citation2019, Citation2020).
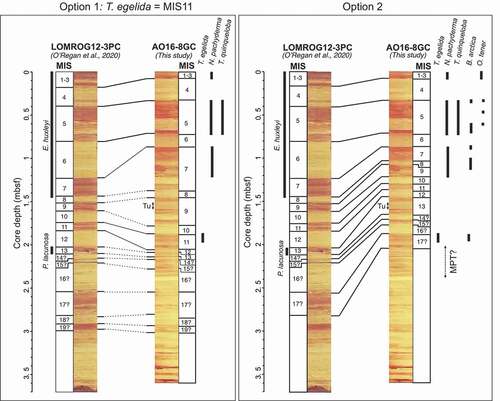
Assigning MIS 1 to 6 in AO16-8GC is relatively straightforward because the lithological similarity with LOMROG12-3PC is evident (). The first lithologic unit consists of a dark brown interval with a relatively high planktonic foraminiferal abundance (). This is assumed to include MISs 1 to 3. Consistently, 14C dating has shown that the base of this uppermost brown unit corresponds to around 30 to 40 ka (MIS 3–1) and that MIS 2 is thin, if expressed at all in this interval (O’Regan et al. Citation2019). Below this, the lighter and coarser interval barren of foraminifers has been found in many cores on the Lomonosov Ridge and Alpha Ridge and reflects MIS 4 (Spielhagen et al. Citation2004; O’Regan et al. Citation2020). Below MIS 4 a relatively thick dark brown layer occurs, divided in three parts. The occurrence of T. quinqueloba together with N. pachyderma in it is consistent with several studies attributing this interval to MIS 5 (Nørgaard-Pedersen, Mikkelsen, Lassen et al. Citation2007; Cronin et al. Citation2014). Notably, the relative change of the T. quinqueloba abundance throughout this interval (high–low–high) is persistent across different parts of the Arctic Ocean and provides confidence that it is indeed correlative (Nørgaard-Pedersen, Mikkelsen, and Kristoffersen Citation2007; Wang et al. Citation2018; O’Regan et al. Citation2019). On the Lomonosov Ridge, the assignment of this unit to MIS 5 is also supported by the occurrence of E. huxleyi (Jakobsson et al. Citation2001) and by results from optically stimulated luminescence dating on quartz grains (Jakobsson et al. Citation2003). The lithologic parts within this sequence have been interpreted as substages within MIS 5 (Jakobsson et al. Citation2001). If the upper two parts were assigned as the interstadials 5a and 5c, then the lowermost, relatively thin part would represent MIS 5e (the Eemian).
For sediments predating MIS 6, we evaluate two alternative MIS stratigraphies for AO16-8GC (). The first, which we refer to as option 1, is based on the prevailing assumption that the dark brown interval containing the planktonic foraminifer T. egelida (1.87–1.98 mbsf) corresponds to MIS 11. Considering this, the T. egelida interval is correlated with the MIS 11 interval in core LOMROG12-3PC, located at 2.92 to 3.00 mbsf (). However, this complicates the determination of the boundaries of MIS 6 to MIS 10, because it requires tying four dark brown units in AO16-8GC with only two dark brown units in LOMROG12-3PC (). Though a mismatch in the number of units does not preclude a possible correlation, the overall shape of the correlated proxy data across the glacial cycles is not overly convincing given this biostratigraphic based correlation.
The second chronology, referred to as option 2, ignores the a priori assumed MIS 11 age of the T. egelida horizon and is based on a simplified top-down, unit-by-unit visual lithostratigraphic correlation (). Each of the dark brown intervals of AO16-8GC in the upper 2 m of the core can be confidently tied to individual dark brown units in LOMROG12-3PC (). However, using this approach the T. egelida horizon in AO16-8GC falls in an interglacial interval older than MIS 11 in LOMROG12-3PC (). Whether this is MIS 15 or 17 in core AO16-8GC is uncertain. This is because the age determination depends on whether a thin dark brown interval, at 2.16 to 2.20 mbsf in LOMROG12-3PC (and at 1.71–1.76 mbsf in AO16-8GC), is interpreted as an interglacial (MIS 15) or as a substage of MIS 14.
The physical properties and elemental distributions (Mn/Zr) in both cores are compared to independently evaluate the two correlation options (). Each of the parameters displays a high degree of similarity in option 2, whereas option 1 yields more dissimilar variations (). Moreover, highly variable sedimentation rates in AO16-8GC would be required to explain option 1, whereas the lithostratigraphic correlation in option 2 can be explained by relatively steady sedimentation rates at both sites (). These results thus favor option 2, suggesting an older age for the occurrence of T. egelida than currently assumed. This is an important finding because the occurrence of T. egelida is used to pinpoint MIS 11 in many recent studies in the Amerasian Basin (Polyak et al. Citation2013; Cronin et al. Citation2014, Citation2019; Wang et al. Citation2018). Support for an older than MIS 11 age for the T. egelida horizon, and possibly even an MIS 17 age, comes from the broad pattern of lithological variability in the studied section, which shows a general switch from weak to strong color alternations at around 2.0 mbsf in core AO16-8GC, approximately coeval with the T. egelida zone (). It is possible that this switch in sedimentation mode identifies the Mid-Pleistocene Transition (Head and Gibbard Citation2015), when relatively mild 41,000-year-long glacial cycles were replaced by more extreme glacial cycles of the “100kyr world,” driving a variety of changes in the ocean–cryosphere and sedimentary systems (). The late stage of the Mid-Pleistocene Transition thus possibly introduced the climatic conditions that allowed T. egelida to thrive in the Arctic Ocean.
Figure 4. Comparison of downcore variability of physical properties between LOMROG12-3PC (red) and A016-8GC (blue). The measurements are plotted on a common depth scale according to correlation 1 (upper panels) and correlation 2 (lower panels).
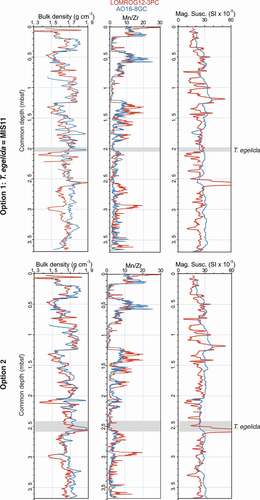
More support for option 2 stems from tuning the Mn/Zr record to the global δ18O stack (Lisiecki and Raymo Citation2005). In option 1, the T. egelida horizon is fixed as MIS 11, and the rest of the record is tuned freely (). However, this assumption hinders a good agreement of Mn/Zr and δ18O between MIS 6 and MIS 10 (). In option 2, no a priori age assumptions are made, and this allows the Mn/Zr record to be tuned convincingly to the δ18O curve for the period 0 to 780 ka BP, placing the T. egelida horizon in MIS 17. Beyond 780 ka, age determinations remain floating in both options, because the low amplitude Mn/Zr variations are difficult to tune to the δ18O record (). The change from low- to high-amplitude Mn variations corresponds broadly to the Mid-Pleistocene Transition according to option 2, which is in agreement with a similar change in Mn variability that was noted in the ACEX core, recovered during IODP expedition 302 at the Lomonosov Ridge (O’Regan et al. Citation2008).
Figure 5. Comparison of the two options for tuning the Mn/Zr record of AO16-8GC to the LRO4 δ18O stack and derived sedimentation rates. In option 1 (upper panels), the T. egelida horizon is “set” to MIS 11. Tuning of the Mn/Zr in option 2 (lower panels) is done freely, without a priori age assumptions. Numbers within the plots indicate marine isotope stages.
The biostratigraphy of the Arctic Ocean is masked by regional and temporal differences in the preservation potential of calcareous microfossils. Until now, T. egelida sensu Herman (Citation1974) has been only found in the Arctic Ocean, on the Northwind Ridge (Cronin et al. Citation2014), Mendeleev Ridge (Cronin et al. Citation2013), and Alpha Ridge (Wang et al. Citation2018) and in one core from the outer end of the Lomonosov Ridge near Greenland (Cronin et al. Citation2014). We assume that the absence of T. egelida from sediment more centrally on the Lomonosov Ridge is due to poorer local preservation—calcareous foraminifera are typically absent below a certain sediment depth, which appears quite variable (2–5 mbsf; O’Regan et al. Citation2019). Controls on the preservation potential within the Arctic Ocean are poorly understood. Clearly, water depth plays an important role due to the corrosive nature of deep arctic waters (Eynaud Citation2011). However, it remains unclear why cores from the Siberian and central parts of the Lomonosov Ridge show poorer preservation of calcareous microfossils than the Greenland side of the Lomonosov Ridge and the Alpha Ridge, despite similar water depths. Potentially, the poorer preservation conditions are related to the position of the ice front—at the seasonal margin high productivity leads to organic carbon oxidation and carbonate dissolution at the seafloor, whereas underneath the perennial sea ice cover the lack of primary production allows carbonate preservation at the seafloor (De Vernal et al. Citation2020).
Comparing the total abundance of planktic foraminifers across different ridges can be complicated due to the variability in sedimentation rate, species-specific flux rates, ice-rafted debris, and dissolution effects. This is particularly so in the Arctic Ocean where large regional differences occur in sea ice melting, ice-rafted sediment provenance, and ocean circulation (Sellén, O’Regan, and Jakobsson Citation2010). The T. egelida zone identified in core AO16-8GC has a similar total abundance of planktic foraminifer tests compared to the T. egelida intervals found on the Northwind Ridge and Mendeleev Ridge (ca. 3000/g; Cronin et al. Citation2014). However, visual observations show a much higher amount of T. egelida tests in the samples from the Northwind Ridge (e.g., core P1-92-AR-P40) than in AO16-8GC. The relatively low absolute abundance but high numbers per gram of T. egelida in AO16-8GC might be due be to a lower sedimentation rate at site AO16-8GC. Indeed, this is implied by the shallower depth at which the T. egelida zone is found in core AO16-8GC (ca. 2 mbsf) compared to deeper sediment depths on the Northwind Ridge and Mendeleev Ridge, generally ranging between 3.5 and 5 mbsf . Also, the T. egelida zone can exceed several decimeters on the Northwind Ridge, whereas it is only a few centimeters thick in AO16-8GC. Therefore, we infer that the main habitat of T. egelida was present at the Siberian side of the Arctic Ocean (Northwind Ridge and Mendeleev Ridge), whereas conditions near the Alpha Ridge were somewhat less optimal for T. egelida.
From a climatic point of view, the appearance of T. egelida in MIS 15 or 17 seems somewhat puzzling. Generally, interglacials were weak during MISs 22 to 16 while glacials were intensifying (Ford and Chalk Citation2020). If this age assignment proves to be correct, we speculate that the relatively mild but long interglacial MIS 15 perhaps resulted in a (seasonally) ice-free Arctic Ocean, allowing the appearance of T. egelida. The apparent absence of the T. egelida morphology (sensu Herman Citation1974, Citation1980; Cronin et al. Citation2014) in the modern ocean and surface sediments (e.g., Schiebel et al. Citation2017) precludes a direct paleoceanographic interpretation. However, due to its clear affinity with the subpolar species T. quinqueloba, we presume that it had a similar ecology. T. quinqueloba is highly abundant south/east of the Arctic front, in subpolar Atlantic waters that are warmer than those currently present in the Arctic Ocean. Therefore, the T. egelida zone likely reflects oceanographic conditions that were markedly different than those today. This interpretation is supported by the lack of or relatively low percentage of N. pachyderma within the T. egelida biozone, suggesting a limited ice cover.
We also compare the stratigraphic ranges of benthic foraminifera found in AO16-8GC with those previously identified. The stratigraphic ranges of benthic foraminifera can be difficult to determine due to their generally low numbers in the central part of the Arctic Ocean. For O. tener, increased occurrences are found since MIS 5 (Polyak et al. Citation2013; Lazar and Polyak Citation2016; Wang et al. Citation2018), and this is confirmed by our results (). As a result of the older age of T. egelida, our preferred option (option 2) implies that increased occurrences of the benthic foraminifer B. arctica (compared to low occurrences in the early Pleistocene) could have started some time during MISs 15 to 17, rather than MIS 11, as proposed earlier (Polyak et al. Citation2013; Cronin et al. Citation2014; Lazar and Polyak Citation2016; Wang et al. Citation2018).
Although the older age for the occurrence of T. egelida is surprising, we emphasize that option 2 proposed here is independently derived by correlation using the time-calibrated calcareous nannofossil chronostratigraphy from LOMROG12-3PC, whereas the T. egelida assignment to MIS 11 remains an “uncalibrated” inference based on cyclostratigraphic cores from the Northwind Ridge and Mendeleev Ridge (Cronin et al. Citation2013; Polyak et al. Citation2013). At the same time, we acknowledge that LOMROG12-3PC is the first and only arctic sediment core where P. lacunosa has been identified (away from the Yermak Plateau), and a more thorough search for this biostratigraphic marker needs to be undertaken in sediments from the Amerasian and Eurasian basins to ultimately resolve this apparent discrepancy between the possible age of a unique, basin-wide T. egelida biohorizon. We point out that a possibly older than MIS 11 age for the occurrence of T. egelida would not alter the established age models on the Lomonosov Ridge (e.g., cores ACEX and AO96/12-PC1), because these do not depend on the age assignment of the T. egelida biozone. If further investigations would confirm the MIS 15 or 17 age for the T. egelida biozone, this could lead to a revision of age assignments of interglacial intervals predating MIS 6 on the Northwind Ridge and some records on the Alpha Ridge.
Conclusions
We present a new sediment core from the Alpha Ridge (AO16-8GC) and analyze downcore changes in foraminiferal composition. The lithology is characterized by an alternation of beige and dark brown intervals, typical of glacial–interglacial cycles in the Arctic Ocean. Due to its proximity to the Lomonosov Ridge, this is the first time that a lithology-based correlation can be convincingly made between an Amerasian basin record bearing T. egelida and the established stratigraphy of the Lomonosov Ridge. Specifically, sediment ages in AO16-8GC are determined by correlation with LOMROG12-3PC, a core with a chronology that is constrained by global biozonations of coccolithophores (E. huxleyi and P. lacunosa) and that was placed in the wider lithostraphic framework of the Lomonosov Ridge (O’Regan et al. Citation2019). Surprisingly, the resulting correlation between LOMROG12-3PC and AO16-8GC suggests an older age for T. egelida than MIS 11, as is currently assumed. In order for the lithostratigraphic correlation to be coherent, the T. egelida zone in core AO16-8GC corresponds to either MIS15 or MIS17—this depends on whether a thin, dark brown interval located just above the T. egelida zone represents a marine isotope stage or a substage. A change in lithology at the level where T. egelida occurs may support this and may coincide with the late phase of the Mid-Pleistocene Transition (MIS 17). The associated changes in the ocean–climate system could potentially explain the appearance of T. egelida in the Arctic Ocean, although the exact mechanism remains somewhat unclear. Our results support the biostratigraphy and age models previously proposed for the period MIS 1 to MIS 6 in the Amerasian and Eurasian basin, but due to a possibly older age for the occurrence of T. egelida, we show that the nannofossil and other microfossil biostratigraphy of both basins needs to be reconciled for sediments predating MIS 6. This might require a reexamination of the age of the T. egelida horizon and/or additional studies validating the nannofossil-based biostratigraphy in both basins.
Plate 1. SEM images showing morphological variability of planktonic foraminifers found in AO16-8GC. (a) to (e): T. egelida (1.88–1.90 mbsf). Specimens (b) and (e) have a reduced final chamber. (f) to (j): T. quinqueloba (0.31–0.33 mbsf). (k) to (o): N. pachyderma; (k), (l), and (n) are from 0.10 to 0.12 mbsf. Specimen (n) represents a form without gametogenic calcite. (m) From 1.25 to 1.26 mbsf, (o) From 1.09 to 1.11 mbsf. Specimen (o) represents an aberrant form. Scale bar = 100 µm.
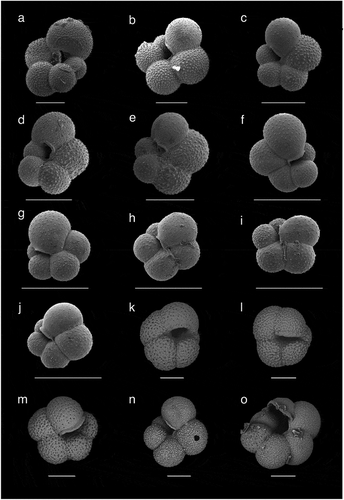
Plate 2. SEM images demonstrating wall texture differences between T. egelida and the weakly calcified N. pachyderma morphotype with which it can be confused. (a) to (d) The T. egelida morphotype with corresponding wall texture close-up views showing spine bases, with evidence of broken spines and/or spine holes still visible in some cases, sample AO16-9-PC1-3, 60 to 62 cm. (e) and (f) Weakly calcified N. pachyderma morphotype, having a wall texture with low pustules but no spines or spine bases, sample form the Eastern Fram Strait, ODP Site 986, 15.32 m, MIS 5e (sample provided by A. Zhuravleva/H. Bauch). (a), (c), (d) Scale bar = 100 µm. (b), (d), (f) Scale bar = 10 μm.
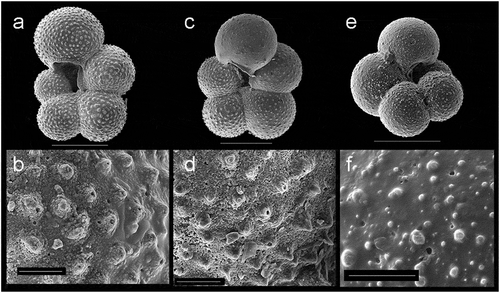
Plate 3. SEM images of the most common benthic foraminifers found in core AO16-8GC. a) C. wuellerstorfi (1.95-1.97 mbsf). (b) and (c) O. tener (0.48-0.50 mbsf). d) S. horvathi (1.95-1.97 mbsf). e) B. arctica (1.95-1.97 mbsf). Scale bars are 100 microns.
Data
The data related to this article can be accessed at the Bolin Centre database. https://doi.org/10.17043/oden-ao-2016-sediment-ao16-8gc-forams-xrf-1.
List of foraminifer species
Planktonic
Neogloboquadrina pachyderma (Ehrenberg, 1861)
Turborotalita egelida (Cifelli and Smith, 1970)
Turborotalita quinqueloba (Natland, 1938)
Benthic
Bolivina arctica (Herman, 1973)
Oridorsalis tener (Brady, 1884)
Cibicidoides wuellerstorfi (Schwager, 1866)
Stetsonia horvathi (Green, 1960)
Acknowledgments
The captain and crew of I/B Oden are thanked for core collection. Kjell Jansson is thanked for help with SEM images and Carina Johansson for producing XRF data.
Disclosure statement
No potential conflict of interest was reported by the authors.
Additional information
Funding
References
- Alexanderson, H., J. Backman, T. M. Cronin, S. Funder, L. Ingólfsson, M. Jakobsson, J. Y. Landvik, L. Löwemark, J. Mangerud, C. März, et al. 2014. An Arctic perspective on dating Mid-Late Pleistocene environmental history. Quaternary Science Reviews 92:9–31.
- Backman, J., M. Jakobsson, R. Løvlie, L. Polyak, and L. A. Febo. 2004. Is the central Arctic Ocean a sediment starved basin? Quaternary Science Reviews 23 (11–13):1435–54. doi:https://doi.org/10.1016/j.quascirev.2003.12.005.
- Carstens, J., D. Hebbeln, and G. Wefer. 1997. Distribution of planktic foraminifera at the ice margin in the Arctic (Fram Strait). Marine Micropaleontology 29 (3–4):257–69. doi:https://doi.org/10.1016/S0377-8398(96)00014-X.
- Channell, J. E. T., B. S. Singer, and B. R. Jicha. 2020. Timing of Quaternary geomagnetic reversals and excursions in volcanic and sedimentary archives. Quaternary Science Reviews 228:106114. doi:https://doi.org/10.1016/j.quascirev.2019.1061140.
- Cronin, T. M., K. J. Keller, J. R. Farmer, M. F. Schaller, M. O’Regan, R. Poirier, H. Coxall, G. S. Dwyer, H. Bauch, I. G. Kindstedt, et al. 2019. Interglacial Paleoclimate in the Arctic. Paleoceanography and Paleoclimatology 34 (12):1959–79. doi:https://doi.org/10.1029/2019PA003708.
- Cronin, T. M., L. H. DeNinno, L. Polyak, E. K. Caverly, R. Z. Poore, A. Brenner, J. Rodriguez-Lazaro, and R. E. Marzen. 2014. Quaternary ostracode and foraminiferal biostratigraphy and paleoceanography in the western Arctic Ocean. Marine Micropaleontology 111:118–33. doi:https://doi.org/10.1016/j.marmicro.2014.05.001.
- Cronin, T. M., L. Polyak, D. Reed, E. S. Kandiano, R. E. Marzen, and E. A. Council. 2013. A 600-ka Arctic sea-ice record from Mendeleev Ridge based on ostracodes. Quaternary Science Reviews 79:157–67. doi:https://doi.org/10.1016/j.quascirev.2012.12.010.
- De Vernal, A., C. Hillaire-Marcel, C. Le Duc, P. Roberge, C. Brice, J. Matthiessen, R. F. Spielhagen, and R. Stein. 2020. Natural variability of the Arctic Ocean sea ice during the present interglacial. Proceedings of the National Academy of Sciences 117 (42):26069–26075. doi:https://doi.org/10.1073/pnas.2008996117.
- Eynaud, F., T. M. Cronin, S. A. Smith, S. Zaragosi, J. Mavel, Y. Mary, V. Mas, and C. Pujol. 2009. Morphological variability of the planktonic foraminifer Neogloboquadrina pachyderma from ACEX cores: Implications for Late Pleistocene circulation in the Arctic Ocean. Micropaleontology 55:101–16.
- Eynaud, F. 2011. Planktonic foraminifera in the Arctic: Potentials and issues regarding modern and quaternary populations. IOP Conference Series: Earth and Environmental Science 14:012005. doi:https://doi.org/10.1088/1755-1315/14/1/012005.
- Ford, H. L., and T. B. Chalk. 2020. The Mid-Pleistocene Enigma. Oceanography 33 (2):101–03. doi:https://doi.org/10.5670/oceanog.2020.216.
- Head, M. J., and P. L. Gibbard. 2015. Early-Middle Pleistocene transitions: Linking terrestrial and marine realms. Quaternary International 389:7–46.
- Hemleben, C., D. Mühlen, R. K. Olsson, and W. A. Berggren. 1991. Surface texture and the first occurrence of spines in planktonic foraminifera from the early Tertiary. Geologisches Jahrbuch 128 (A):117–46.
- Hemleben, C., R. K. Olsson, V. Premek Fucek, and M. Hernitz Kucenjak. 2018. Wall textures of Oligocene normal perforate planktonic foraminifera. In Atlas of Oligocene Planktonic Foraminifera, 55–78. McLean, VA: GeoScienceWorld. https://www.ucl.ac.uk/earth-sciences/sites/earth_sciences/files/Chapter_3.pdf.
- Herman, Y. 1974. Marine geology and oceanography of the Arctic seas. New York: Springer.
- Herman, Y. 1980. Globigerina exumbilicata Herman, 1974, a Synonym of G. quinqueloba egelida Cifelli and Smith, 1970. Journal of Paleontology 54 (3):631.
- Ishman, S. E., L. V. Polyak, and R. Z. Poore. 1996. Expanded record of Quaternary oceanographic change: Amerasian Arctic Ocean. Geology 24 (2):139–42. doi:https://doi.org/10.1130/0091-7613(1996)024<0139:EROQOC>2.3.CO;2.
- Jakobsson, M., J. Backman, A. Murray, and R. Løvlie. 2003. Optically stimulated luminescence dating supports central Arctic ocean cm-scale sedimentation rates. Geochemistry, Geophysics, Geosystems 4 (2):1–11. doi:https://doi.org/10.1029/2002GC000423.
- Jakobsson, M., L. Mayer, B. Coakley, J. A. Dowdeswell, S. Forbes, B. Fridman, H. Hodnesdal, R. Noormets, R. Pedersen, M. Rebesco, et al. 2012. The International Bathymetric Chart of the Arctic Ocean (IBCAO) version 3.0. Geophysical Research Letters 39 (12). doi: https://doi.org/10.1029/2012GL052219.
- Jakobsson, M., R. Løvlie, E. M. Arnold, J. Backman, L. Polyak, J. O. Knutsen, and E. Musatov. 2001. Pleistocene stratigraphy and paleoenvironmental variation from Lomonosov Ridge sediments, central Arctic Ocean. Global and Planetary Change 31 (1–4):1–22. doi:https://doi.org/10.1016/S0921-8181(01)00110-2.
- Jakobsson, M., R. Løvlie, H. Al-Hanbali, E. Arnold, J. Backman, and M. Mörth. 2000. Manganese and color cycles in Arctic Ocean sediments constrain Pleistocene chronology. Geology 28 (1):23. doi:https://doi.org/10.1130/0091-7613(2000)28<23:MACCIA>2.0.CO;2.
- Lazar, K. B., and L. Polyak. 2016. Pleistocene benthic foraminifers in the Arctic Ocean: Implications for sea-ice and circulation history. Marine Micropaleontology 126:19–30. doi:https://doi.org/10.1016/j.marmicro.2016.04.004.
- Lisiecki, L. E., and M. E. Raymo. 2005. A Pliocene-Pleistocene stack of 57 globally distributed benthic δ 18O records. Paleoceanography 20:1–17.
- Löwemark, L., M. O’Regan, T. J. J. Hanebuth, and M. Jakobsson. 2012. Late Quaternary spatial and temporal variability in Arctic deep-sea bioturbation and its relation to Mn cycles. Palaeogeography, Palaeoclimatology, Palaeoecology 365-366:192–208. doi:https://doi.org/10.1016/j.palaeo.2012.09.028.
- Marzen, R. E., L. H. DeNinno, and T. M. Cronin. 2016. Calcareous microfossil-based orbital cyclostratigraphy in the Arctic Ocean. Quaternary Science Reviews 149:109–21. doi:https://doi.org/10.1016/j.quascirev.2016.07.004.
- Nørgaard-Pedersen, N., N. Mikkelsen, S. J. Lassen, Y. Kristoffersen, and E. Sheldon. 2007. Reduced sea ice concentrations in the Arctic Ocean during the last interglacial period revealed by sediment cores off northern Greenland. Paleoceanography 22 (1). doi: https://doi.org/10.1029/2006PA001283.
- Nørgaard-Pedersen, N., N. Mikkelsen, and Y. Kristoffersen. 2007. Arctic Ocean record of last two glacial-interglacial cycles off North Greenland/Ellesmere Island - Implications for glacial history. Marine Geology 244 (1–4):93–108. doi:https://doi.org/10.1016/j.margeo.2007.06.008.
- O’Regan, M., H. K. Coxall, T. M. Cronin, R. Gyllencreutz, M. Jakobsson, S. Kaboth, L. Löwemark, S. Wiers, and G. West. 2019. Stratigraphic occurrences of sub-polar planktic foraminifera in Pleistocene sediments on the Lomonosov Ridge, Arctic Ocean. Frontiers in Earth Science 7:1–18. doi:https://doi.org/10.3389/feart.2019.00071.
- O’Regan, M., J. Backman, E. Fornaciari, M. Jakobsson, and G. West. 2020. Calcareous nannofossils anchor chronologies for Arctic Ocean sediments back to 500 ka. Geology 48 (11):1115–19. doi:https://doi.org/10.1130/G47479.1.
- O’Regan, M., J. King, J. Backman, M. Jakobsson, H. Pälike, K. Moran, C. Heil, T. Sakamoto, T. M. Cronin, and R. W. Jordan. 2008. Constraints on the Pleistocene chronology of sediments from the Lomonosov Ridge. Paleoceanography 23 (1). doi: https://doi.org/10.1029/2007PA001551.
- Polyak, L., K. M. Best, K. A. Crawford, E. A. Council, and G. St-Onge. 2013. Quaternary history of sea ice in the western Arctic Ocean based on foraminifera. Quaternary Science Reviews 79:145–56. doi:https://doi.org/10.1016/j.quascirev.2012.12.018.
- Rothwell, R. G., and I. W. Croudace. 2015. Twenty years of XRF core scanning marine sediments: What do geochemical proxies tell us? In Micro-XRF studies of sediment cores, 25–102. Dordrecht: Springer Netherlands.
- Schiebel, R., R. F. Spielhagen, J. Garnier, J. Hagemann, H. Howa, A. Jentzen, A. Martínez-garcia, J. Meilland, E. Michel, J. Repschläger, et al. 2017. Modern planktic foraminifers in the high-latitude ocean. Marine Micropaleontology 136:1–13. doi:https://doi.org/10.1016/j.marmicro.2017.08.004.
- Sellén, E., M. O’Regan, and M. Jakobsson. 2010. Spatial and temporal Arctic Ocean depositional regimes: A key to the evolution of ice drift and current patterns. Quaternary Science Reviews 29 (25–26):3644–64. doi:https://doi.org/10.1016/j.quascirev.2010.06.005.
- Spielhagen, R. F., K. H. Baumann, H. Erlenkeuser, N. R. Nowaczyk, N. Nørgaard-Pedersen, C. Vogt, and D. Weiel. 2004. Arctic Ocean deep-sea record of northern Eurasian ice sheet history. Quaternary Science Reviews 23 (11–13):1455–83. doi:https://doi.org/10.1016/j.quascirev.2003.12.015.
- Stein, R., C. Schubert, C. Vogt, and D. Fütterer. 1994. Stable isotope stratigraphy, sedimentation rates, and salinity changes in the Latest Pleistocene to Holocene eastern central Arctic Ocean. Marine Geology 119 (3–4):333–55. doi:https://doi.org/10.1016/0025-3227(94)90189-9.
- Stein, R., J. Matthiessen, F. Niessen, A. Krylov, N. S. Il, and E. Bazhenova. 2010. Towards a better (litho-) stratigraphy and reconstruction of Quaternary paleoenvironment in the Amerasian basin (Arctic Ocean). Polarforschung 79:97–121.
- Sundby, B., P. Lecroart, P. Anschutz, S. Katsev, and A. Mucci. 2015. When deep diagenesis in Arctic Ocean sediments compromises manganese-based geochronology. Marine Geology 366:62–68. doi:https://doi.org/10.1016/j.margeo.2015.04.005.
- Thierstein, H. R., K. R. Geitzenauer, B. Molfino, and N. J. Shackleton. 1977. Global synchroneity of late Quaternary coccolith datum levels: Validation by oxygen isotopes. Geology 5 (7):400–04. doi:https://doi.org/10.1130/0091-7613(1977)5<400:GSOLQC>2.0.CO;2.
- Volkmann, R. 2000. Planktic foraminifers in the outer Laptev Sea and the Fram Strait - Modern distribution and ecology. The Journal of Foraminiferal Research 30 (3):157–76. doi:https://doi.org/10.2113/0300157.
- Wang, R., L. Polyak, W. Xiao, L. Wu, T. Zhang, Y. Sun, and X. Xu. 2018. Late-Middle Quaternary lithostratigraphy and sedimentation patterns on the Alpha Ridge, central Arctic Ocean: Implications for Arctic climate variability on orbital time scales. Quaternary Science Reviews 181:93–108. doi:https://doi.org/10.1016/j.quascirev.2017.12.006.
- Wiers, S., I. Snowball, M. O’Regan, and B. Almqvist. 2019. Late pleistocene chronology of sediments from the Yermak Plateau and uncertainty in dating based on geomagnetic excursions. Geochemistry, Geophysics, Geosystems 20 (7):3289–310. doi:https://doi.org/10.1029/2018GC007920.
- Xiao, W., L. Polyak, R. Wang, L. Löwemark, J. Mei, D. You, W. Wang, L. Wu, and X. Jin. 2020. Middle to Late Pleistocene Arctic paleoceanographic changes based on sedimentary records from Mendeleev Ridge and Makarov Basin. Quaternary Science Reviews 228:106105. doi:https://doi.org/10.1016/j.quascirev.2019.106105.
- Xuan, C., J. E. T. Channell, L. Polyak, and D. A. Darby. 2012. Paleomagnetism of Quaternary sediments from Lomonosov Ridge and Yermak Plateau: Implications for age models in the Arctic Ocean. Quaternary Science Reviews 32:48–63. doi:https://doi.org/10.1016/j.quascirev.2011.11.015.
- Ye, L., C. März, L. Polyak, X. Yu, and W. Zhang. 2019. Dynamics of manganese and cerium enrichments in Arctic Ocean sediments: A case study from the Alpha Ridge. Frontiers in Earth Science 6:1–18. doi:https://doi.org/10.3389/feart.2018.00236.