
ABSTRACT
Monitoring wild populations is an essential tool to assess the conservation status and the ecological requirements of a species. Capture–mark–recapture (CMR), based on individual recognition, is the most commonly used and most effective technique. However, in cases of species with no individual color pattern, tracing the encounter history of individuals without invasive marking methods is impossible. In this study we aimed to (1) estimate population abundance and density using a less effort-intensive and nonstressful technique, (2) test a long-term monitoring protocol, and (3) assess the fine-scale ecological requirements of a black-colored amphibian, Salamandra atra, in the Italian Alps. For three populations we applied an N-mixture model on data collected using a dependent double-observer approach. To understand ecological requirements, we assessed the relative importance of a set of environmental and topographical variables. The double-observer approach was a cost-effective technique that provided reliable demographic estimates of population density. Our results suggest that the most important fine-scale ecological variables positively associated with salamander abundance were canopy cover and terrain ruggedness, which are strictly related to shelter availability and soil moisture.
Introduction
There are several reasons for monitoring wild animal populations. Among them, to (1) determine the conservation status of species, (2) understand their ecological needs in order to plan appropriate conservation strategies, (3) assess the effectiveness of management and biodiversity actions, and (4) know the effects of anthropogenic pressures in a given territory (Yoccoz, Nichols, and Boulinier Citation2001; Witmer Citation2005; Reynolds, Thompson, and Russell Citation2011; Shrestha and Lapeyre Citation2018). However, obtaining accurate estimates of population abundance and density is time- and resource-consuming, mainly because of the imperfect detection of wild animals in their habitat (Seber Citation1982; Williams, Nichols, and Conroy Citation2002). Imperfect detection originates from our inability to capture or sight all the individuals of a wild population and from the fact that the available ones for sampling are just a fraction of the entire population (Nichols and Conroy Citation1996; Borchers et al. Citation2002; Schmidt Citation2003).
A rich array of analytical methods, known as capture–mark–recapture (CMR) protocols, have been developed to analyze data from marked populations, and these are considered the most informative techniques to estimate population abundance and other demographic parameters (Seber Citation1982; Williams, Nichols, and Conroy Citation2002; Barker et al. Citation2017). CMR models are based on the encounter history of captured individuals in successive recapture occasions, allowing the estimation of the population size (Seber Citation1982; Schmidt Citation2003). Traditionally, individual recognition is accomplished by capturing animals and placing unique marks on them. Usually these methods are not invasive or minimally invasive, but in some cases unexpected and negative effects on marked individuals have been observed (e.g., Saraux et al. Citation2011). Accordingly, these possible animal welfare consequences (McMahon, van den Hoff, and Burton Citation2005) and the effort associated to capture and physically mark individuals have pressed researchers to develop alternative methods (Zemanova Citation2021). Therefore, in recent years, digital photography and image processing software have gained popularity in providing photographic methods (i.e., photographic mark–recapture) to recognize individuals by their unique color marks or patterns (Bolger et al. Citation2012; Zemanova Citation2021). The fundamental prerequisite for the photographic marking application is that individuals must exhibit color patterns on some region of their coat, skin, or eyes sufficiently distinctive to discriminate among them and that this pattern must be stable over the duration of the study period (Bolger et al. Citation2012). However, several methods of photo identification often require the capture and handling of individuals, in particular when the focal species is small, cryptic, and possesses its characteristic pattern in hidden parts such as the gular, ventral, or abdominal regions.
In situations where invasive marking methods (e.g., visible implant elastomers, passive integrated transponders, tattoos, etc.) are not desirable and individuals do not have discriminating color patterns—for instance, in completely monochromatic black species—alternative methods such as distance sampling (DS; e.g., Buckland et al. Citation2004) and an adaptation of the CMR framework known as “multiple observers” (MO) method (Southwell Citation1996, table 16) can be applied. In DS animals are counted along a line transect or a point, and the distance from the center of the transect is recorded for each observation. Population density from line transect surveys may be therefore estimated by modeling the way detectability decreases with distance from the observer. Unfortunately, DS has been judged only moderately effective for amphibians and reptiles, because these animals may be undetected even on the transect line (i.e., one of the fundamental assumptions of DS), leading to assumption violation and imprecise density estimates (see Dodd [Citation2010], [Citation2016] and references therein; see also Marques Citation2009). In the MO approach, animals are sighted and recorded by two or more observers in succession, with a protocol that allows partitioning of the sightings into those scored by each observer. MO has been mainly applied to animals readily observable from long distances, such as large terrestrial or marine mammals (Cook and Jacobson Citation1979; Langtimm et al. Citation2011; Bröker et al. Citation2019) and waterfowl (Koneff et al. Citation2008; Vrtiska and Powell Citation2011), and also to animal traces and signs (amphibian egg masses; Grant et al. Citation2005) or animals calls (frogs and toads: Shirose et al. Citation1997; birds: Forcey et al. Citation2006). Recently, multinomial N-mixture models, which are a generalization of the binomial N-mixture model (Royle Citation2004), have been developed to accommodate sampling frameworks yielding multinomial outcomes, such as the MO protocol under a metapopulation design (Chandler, Royle, and King Citation2011; Kéry Citation2018; Costa, Romano, and Salvidio Citation2020). These multinomial N-mixture models have been successfully applied mainly on large mammals with high detection probability (e.g., manatees: Langtimm et al. Citation2011; narwhals: Bröker et al. Citation2019) but also on terrestrial amphibians (Costa, Romano, and Salvidio Citation2020). Amphibians and reptiles include several mimetic, nocturnal, small-sized, and cryptic species that for these reasons are typically characterized by a low detection probability (e.g., McDiarmid et al. Citation2012; Griffiths et al. Citation2015).
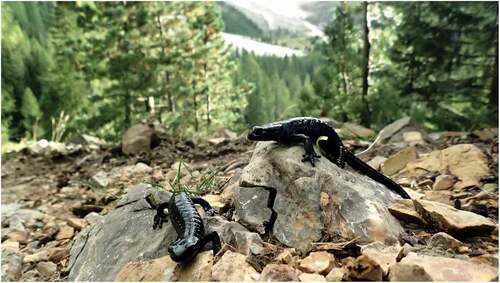
In this study, we used the multinomial N-mixture model on data collected using a dependent double-observer approach to estimate population abundance and density of a completely black-colored and fully terrestrial salamander (). To date, population abundance estimates of the alpine salamander (Salamandra atra Laurenti, 1768) have been obtained using invasive or highly stressful methods, such as toe clipping (Luiselli et al. Citation2001) and transponders after anesthetization (Helfer, Broquet, and Fumagalli Citation2012), and a moderately stressful approach; that is, removal methods (Romano et al. Citation2018a). In addition, we evaluated whether this approach can be used as an expeditious method in a long-term monitoring program to detect possible demographic trends of alpine salamander populations, which is among the aims of the monitoring program of the Natura 2000 Network.
Figure 1. The alpine salamander, Salamandra atra, a fully terrestrial and completely black amphibian, endemic of the Central and Eastern Alps and Dinaric Alps.
Materials and methods
Study species
The alpine salamander, Salamandra atra, is a fully terrestrial and viviparous salamander endemic to the Central and Eastern Alps and the Dinaric Alps where some isolated populations have been recorded (Sillero et al. Citation2014). The alpine salamander is a polytypic species: two Italian endemics possess a very narrow distribution range and yellowish spots on the body (S. atra aurorae and S. atra pasubiensis). Two other subspecies, S. a. atra and S. a. prenjensis, both with wider distributions, are characterized by completely black coloration. This study was performed on the most diffused subspecies, the nominal one, for which the typical habitats are mixed coniferous and deciduous forests, alpine meadows, and rocky tundra-like areas, mainly on limestone substrates. Annual activity pattern is concentrated in the warmest months (April–October), whereas during the rest of the year the salamanders are inactive (Klewen Citation1988). Moreover, these salamanders are active during rainy conditions and in particular at night.
Study area, study framework, and sampling design
The study area is located in the Italian Dolomites, in the Paneveggio–Pale di San Martino Natural Park (province of Trento, Northern Italy), and is characterized by open habitats (pastures, other grasslands, and rocky areas) mixed with coniferous woodlands dominated by European larch (Larix decidua) and Norway spruce (Picea abies). Three sites were chosen, in similar habitat conditions, to start population monitoring, based on a series of inspections performed in 2019, which also took into account the accessibility and safety of operators at night. Each study site was a transect 300 m long. The first, OTA, is at about 1,900 m.a.s.l., near the locality Malga Venegiota (cadastral municipality of Tonadico; 46°18′48″ N, 11°48′53″ E); the second, GIA, is at about 1,850 m.a.s.l., near the locality Malga Venegia (cadastral municipality of Tonadico; 46°19′21″ N, 11°47′46″ E), and the last one, FOS, is at about 1,950 m.a.s.l., near the locality Malga Fosse (cadastral municipality of Siror, 46°17′20″ N, 11°47′57″ E). The linear distance between transects ranged from 2.3 km (OTA-GIA) to 3.9 km (GIA-FOS). The transects were on mountain slopes with different exposures: OTA and FOS had a southwest aspect and GIA had a southeast aspect. Each transect was divided in thirty subtransects of 10 m each (measured by means of a range finder), which were individually flagged a few days before salamander sampling and constituted sampling units of the dependent double-observer surveys. Several environmental variables describing salamander microhabitat were also measured for each subtransect. Three variables were detected on the field: average width of the subtransect (width, measured with a metric wheel tape), canopy cover (canopy) divided in three categories (high = cover >70%, medium = cover >20% and <70%; low = cover <20%), and presence/absence of shelters (shelter; e.g., stones, deadwood). Two additional variables were derived from a digital elevation model of the study area (1-m mesh size; Lidar 2009–PAT) and calculated within SAGA-GIS software v.7.9 (Conrad et al. Citation2015): the ruggedness of the subtransect (ruggedness; i.e., the relative measure of elevation difference between adjacent elevation cells), calculated as the Terrain Ruggedness Index (Riley, DeGloria, and Elliot Citation1999), and the Topographic Position Index (TPI), which expresses the topographic position of each cell within the landscape (Guisan, Weiss, and Weiss Citation1999). Although Lauber (Citation2004) found no main effect of air humidity on salamander counts, our pilot studies (Roner et al. Citationin press) showed significant differences in the number of active salamanders in different meteorological conditions and times of the day, confirming Günther and Grossenbacher (Citation1996) and Geiger (Citation2006). Consequently, salamanders were counted when they were more active; that is, during a rainy night at the end of August 2020, between 9:00 p.m. and 02:00 a.m. The dependent double-observer technique was used, in which observer 1 points to and counts out all salamanders in each subtransect to observer 2 (Cook and Jacobson Citation1979; Nichols et al. Citation2000). Observer 2 records what observer 1 reports but also records in a separate column any additional salamanders detected by him and missed by observer 1, avoiding any possible influence. At each subtransect the two observers exchanged roles. Each transect was covered in a time ranging from 30 to 45 minutes.
Data analysis
We analyzed dependent double-observer data using multinomial N-mixture models, employing each subtransect as a site (n = 90). For the double-dependent observer protocol, multinomial N-mixture models include two parameters: one for the latent variable (i.e., mean abundance at sampling sites; lambda, λ) and another one for the detection process (i.e., detection probability, p; Royle and Dorazio Citation2006; Chandler, Royle, and King Citation2011; Costa, Romano, and Salvidio Citation2020). Both abundance and detection parameters can be conveniently modeled as a function of environmental or sampling covariates through a log or logit link, respectively (Kéry and Royle Citation2016). Prior to model building, all continuous predictors were scaled by means of function scale() within the R environment (mean = 0; SD = 1). We built a global model; that is, the more complex model on which other models are nested, with a Poisson error distribution for λ and including all sub-transect-specific covariates on the abundance side of the formula. We modeled p with a fixed observer-dependent effect, which we retained in all models, and considered p to be also affected by width. Model building occurred within the R package “unmarked” using function multinomPois(), set for data type “depDouble” (Fiske and Chandler Citation2011). We conducted model selection within the R package “AICcmodavg” (Mazerolle Citation2020) by simplifying the global model using stepwise backwards elimination, dropping one term at a time, beginning from the one with the highest p value and removing terms until Akaike’s informative criterion corrected for small sample size (AICc; using number of sites as sample size for a more conservative approach; Burnham and Anderson Citation2002; MacKenzie et al. Citation2017) no longer decreased (Kéry and Royle Citation2020). From the best model, we derived abundance estimates (N-hat)for each population from the posterior distribution of the latent abundance using function ranef() in the R package “unmarked.” From the posterior distribution of the latent abundance, we also derived density estimates (D-hat; individuals/hectares) for each population by calculating the total surveyed area for each population using the subtransect specific width. Confidence intervals for N-hat and D-hat were obtained by parametric bootstrap, using function parboot() in the R package “unmarked” (Fiske and Chandler Citation2011; Kéry and Royle Citation2016).
Results
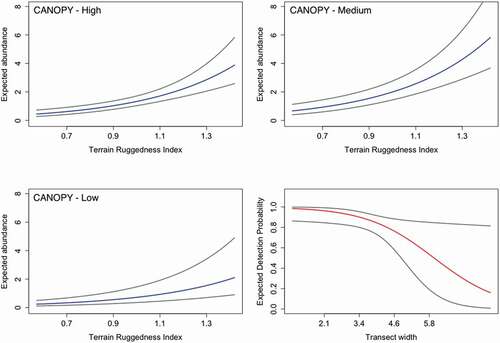
During the surveys we counted a total of 109 salamanders (see Supplementary Materials). After backwards model selection, the resulting best model accounted for the effect of width and observer on p and of canopy and ruggedness on λ (all models, also including the global model, are presented in ). Detection probability was negatively affected by subtransect width (, ). Estimates of detection probability were high and not significantly different between observers (observer 1; i.e., the observer pointing to detected salamanders, p = .89, 95 percent confidence interval [CI] [0.76–0.96]; observer 2; i.e., the observer recording salamanders pointed by observer 1 and also those detected by himself but missed by observer 1, p = .85, 95 percent CI [0.24–0.99]), and the combined detection probability—that is, the probability of an individual being detected by at least one observer (see Nichols et al. Citation2000)—was p = .98 (95 percent CI [0.82–0.99]). Mean expected abundance (λ = 1.04, 95 percent CI [0.78–1.39]) was positively affected by medium and high canopy cover, negatively affected by low canopy cover (; ), and positively affected by terrain ruggedness (, ). Population-level abundance estimates, derived from the posterior distribution of the latent abundance, greatly differed among populations. Abundance and density estimates in GIA (N-hat = 26, 95 percent CI [24–36]; D-hat = 231, 95 percent CI [134–376]) and FOS (N-hat = 22, 95 percent CI [22–24]; D-hat = 299, 95 percent CI [190–480]) were similar, whereas a higher abundance was estimated in OTA (N-hat = 66, 95 percent CI [63–87]; D-hat = 570, 95 percent CI [435–883]).
Table 1. List of candidate models, ranked by AICc
Table 2. Parameter estimates and 95 percent confidence intervals from the best model. Detection parameters are on the logit scale. Abundance parameters are on the log scale
Figure 2. Plots representing the relationship between expected values of abundance and detection and covariates included in the best model. Transect width is expressed in meters. Three plots for abundance represent different levels of canopy. Blue and red lines represent the mean for abundance and detection, respectively. Grey lines represent 95 percent confidence intervals.
Discussion
The MO method is a cost-effective approach to estimate alpine salamander abundance. Bailey et al. (Citation2004) argued that, in the short term, reliable methods (i.e., robust design and removal methods) usually estimate surface population of salamanders, because only in long-term studies the temporary emigration may be taken into account.Nonexposure to sampling can have significant consequences for abundance estimation. Consequently, the results we obtained can be comparable to other short-term methods (e.g., Romano et al. Citation2018a), rather than to long-term studies. We estimated the abundance of salamanders active on the surface during optimal weather conditions; therefore, we are confident that the population active on the ground surface is a proxy of the true population. In the weather and night conditions in which we performed the surveys, salamanders exhibited a very high detection probability, which led to an estimate close to the observed number of individuals. In the site OTA, salamander density was also estimated using the removal method three years before this study (472 ind./ha; 95 percent CI [310–633], estimated in September 2017; see Romano et al. Citation2018a) and did not significantly differ from the results we obtained in the present study (D-hat = 570, 95 percent CI [435–883]). Considering that site OTA has not undergone any considerable changes during these three years, the concordance of the two methods in the density estimate highlights their mutual robustness and reliability. Population density was remarkably higher in site OTA than in the other two sites (GIA and FOS).
Available literature shows that population density of the nominal subspecies of the alpine salamander is highly variable among sites, spanning from more than 3,000 ind./ha (Helfer, Broquet, and Fumagalli Citation2012) to 120 ind./ha (Klewen Citation1986), also including intermediate values (Klewen Citation1986, Citation1988; Helfer, Broquet, and Fumagalli Citation2012). However, a higher value was obtained extrapolating on a hectare from a small area (625 m2), whereas lower values were extrapolated from larger areas (3,000 m2). Considering that, as for many other small vertebrate species, the spatial distribution of Salamandra atra may be significantly aggregated also within small areas (about 1,300 m2; S. a. aurorae; Bonato and Fracasso Citation2003), extrapolation of population density from very small areas to hectares should be regarded with caution because it could greatly under- or overestimate the actual densities at larger scale. To clarify this question—that is, whether the densities along the transects are comparable to the surrounding areas (as suggested by our preliminary studies in progress)—further research is needed.
The MO method applied here is confirmed as a useful tool to perform abundance and trend monitoring of this elusive amphibian, for which marking techniques are not a viable option. Furthermore, this technique provides an important reduction of sampling effort compared to CMR and removal methods. Finally, the MO method eliminates the need for capture, marking, and handling of individuals, preventing any possible stress or negative effects on animals.
The included microhabitat variables in our modeling framework allowed us to conveniently evaluate the fine-scale ecological requirements of the alpine salamander. Local abundance was positively affected both by closed canopy cover and by terrain ruggedness. Higher canopy cover could favor salamander occurrence and abundance at two different levels. First, the positive effect of the canopy cover can be directly related to phenomena associated with protection from solar radiation and desiccation. In addition, considering that alpine salamanders are usually active at night and during rainy weather, when they retreat under shelters or in shallow subterranean habitats, they are exposed to climatic variations, linked to the surface environment (Culver and Pipan Citation2014). Therefore, a higher canopy cover may have a buffering effect on climatic variationsin subterranean shelters. Second, canopy cover is intuitively correlated to the number of trees and their size, which may in turn be directly linked to shelter availability because the basal part of the tree trunks, with their cavities and buttresses, is used by salamanders as shelter (Basile et al., Citation2017; Piraccini et al. Citation2017). However, our results show that salamanders were more abundant along subtransects with intermediate canopy cover (). A preference for areas with intermediate canopy cover can be explained by the effect of canopy on soil moisture, resulting from both the outcome of gross precipitation and canopy interception, and also from the shading effect of the canopy on soil drying. Canopy interception loss ranges between 9 and 48 percent of gross precipitation and tends to be higher for coniferous than for broad-leaf forests (Gerrits and Savenije Citation2011). Intuitively, soil drying is slower if the soil is shaded and if it is protected from the wind by trees. Subtransects characterized by high conifer canopy cover require extremely abundant rainfall to humidify the soil, whereas subtransects without or with low canopy cover are more exposed to direct solar radiation and wind action, resulting in faster soil drying. Subtransects with intermediate canopy cover are probably the best compromise for a greater maintenance of soil moisture, which is essential for salamanders.
The second significant environmental variable (i.e., the terrain ruggedness) has to be regarded from this perspective. Terrain heterogeneity is indeed an important variable for several reasons and for many species: it provides different information considering different spatial scales (e.g., Nellemann and Reynolds Citation1997; Riley, DeGloria, and Elliot Citation1999; Sappington, Longshore, and Thompson Citation2007; Einoder et al. Citation2018). We used the Terrain Ruggedness Index at a spatial scale (i.e., 1-m meshes) suitable for describing the relevant elements for salamanders considering their size, behavior, ecology, and vagility. At this scale, a higher index corresponds to a greater abundance of rocky geomorphological elements on the ground that can provide shelters for alpine salamanders. Terrestrial salamanders are indeed highly constrained to a narrow range of environmental conditions due to their physiological requirements (Feder Citation1983; Peterman and Semlitsch Citation2014), and they are able to behaviorally buffer nonoptimal environmental conditions, in particular temperature and moisture (e.g., Farallo, Wier, and Miles Citation2018). One strategy is to be nocturnal, as the alpine salamander is, but this does not seem to be sufficient, and terrestrial salamanders regulate these environmental parameters through microhabitat selection (Farallo, Wier, and Miles Citation2018). However, considering their limited spatial movements (Bonato and Fracasso Citation2003; see table 8.1 in Vitt and Caldwell Citation2013) salamanders are strictly dependent to shelter availability in the surrounding (Popescu and Hunter Citation2011; Peterman and Semlitsch Citation2013). In the subspecies S. a. aurorae, the uneven availability of suitable rocky shelters was considered the main factor influencing the heterogeneous distribution of the population studied by Bonato and Fracasso (Citation2003), and the availability of moist shelters was identified as a driving variable in determining species occurrence in forest patches (Romano et al. Citation2018b). Shelter availability, associated to canopy cover and high terrain ruggedness, seems to play a key role in determining differences in the alpine salamander abundance at a small spatial scale.
Conclusions
In this study we tested a method typically used for large species or signs of presence, and therefore with high detection probability and easily recognizable, on a small, elusive, and not easily markable amphibian with a uniformly black coloration. The dependent double-observer method was reliable and in agreement with the abundance estimate obtained from the removal method in a previous study. Furthermore, the analysis of microhabitat variables provided important information about habitat selection and ecological requirements; these factors are of paramount importance for proper species management and conservation. Ongoing studies on other amphibians and reptiles will allow us to test the validity of the double-observer approach in providing a robust and noninvasive method for those species, such as the alpine salamander, that are difficult to mark or for species whose handling is not recommended. Finally, annual monitoring using the double-observer protocol will allow us to detect demographic trends, leading to a better assessment of the conservation of salamanders in alpine habitats.
Acknowledgments
The Paneveggio–Pale di San Martino Natural Park provided logistic facilities close to the sampling site. In particular, we are grateful to the Technical Coordinator Piergiovanni Partel, the Director Vittorio Ducoli, and the park guard Gilberto Volcan. Thanks to Rachele Gobbi for the contributions to field sampling.
Disclosure statement
No potential conflict of interest was reported by the author(s).
Additional information
Funding
References
- Bailey, L. L., Simons, T. R., and Pollock, K. H. 2004. Estimating detection probability parameters for Plethodon salamanders using the robust capture–recapture design. Journal of Wildlife Management 68 (1):1–13.
- Barker, R. J., M. R. Schofield, W. A. Link, and J. R. Sauer. 2017. On the reliability of N-mixture models for count data. Biometrics 74 (1):369–77. doi:https://doi.org/10.1111/biom.12734.
- Basile, M., A. Romano, A. Costa, M. Posillico, D. Scinti Roger, A. Crisci, R. Raimondi, T. Altea, V. Garfi, G. Santopuoli, et al. 2017. Seasonality and microhabitat selection in a forest-dwelling salamander. The Science of Nature – Naturwissenschaften 104 (9–10):1–1. art. 80. doi:https://doi.org/10.1007/s00114-017-1500-6.
- Bolger, T. D., T. A. Morrison, B. Vance, D. Lee, and H. Farid. 2012. A computer-assisted system for photographic mark–recapture analysis. Methods in Ecology and Evolution 3 (5):813–22. doi:https://doi.org/10.1111/j.2041-210X.2012.00212.x.
- Bonato, L., and G. Fracasso. 2003. Movements, distribution pattern and density in a population of Salamandra atra aurorae (Caudata: Salamandridae). Amphibia-Reptilia 24 (3):251–60. doi:https://doi.org/10.1163/156853803322440736.
- Borchers, D. L., S. T. Buckland, W. E. Stephens, and W. Zucchini. 2002. Estimating animal abundance. London, UK: Springer.
- Bröker, K. C. A., R. G. Hansen, K. E. Leonard, W. R. Koski, and M. P. Heide-Jørgensen. 2019. A comparison of image and observer based aerial surveys of narwhal. Marine Mammal Science 35 (4):1253–79. doi:https://doi.org/10.1111/mms.12586.
- Buckland, S. T., D. R. Anderson, K. P. Burnham, J. L. Laake, D. Borchers, and L. Thomas. 2004. Advanced distance sampling: Estimating abundance of biological populations. Oxford: Oxford University Press.
- Burnham, K., and K. Anderson. 2002. Model selection and multi-model inference: A practical information-theoretic approach. New York: Springer.
- Chandler, R. B., J. A. Royle, and D. I. King. 2011. Inference about density and temporary emigration in unmarked populations. Ecology 92 (7):1429–35. doi:https://doi.org/10.1890/10-2433.1.
- Conrad, O., B. Bechtel, M. Bock, H. Dietrich, E. Fischer, L. Gerlitz, J. Wehberg, V. Wichmann, and J. Bohner. 2015. System for Automated Geoscientific Analyses (SAGA) v. 2.1.4. Geoscientific Model Development 8 (7):1991–2007. doi:https://doi.org/10.5194/gmd-8-1991-2015.
- Cook, R. D., and J. O. Jacobson. 1979. A design for estimating visibility bias in aerial surveys. Biometrics 35 (4):735–42. doi:https://doi.org/10.2307/2530104.
- Costa, A., A. Romano, and S. Salvidio. 2020. Reliability of multinomial N-mixture models for estimating abundance of small terrestrial vertebrates. Biodiversity and Conservation 29 (9–10):2951–65. doi:https://doi.org/10.1007/s10531-020-02006-5.
- Culver, D. C., and T. Pipan. 2014. Shallow subterranean habitats: Ecology, evolution, and conservation. New York: Oxford University Press.
- Dodd, C. K. J., Ed. 2010. Amphibian ecology and conservation: A handbook of techniques. Oxford, UK: Oxford University Press.
- Dodd, C. K. J., Ed. 2016. Reptile ecology and conservation: A handbook of techniques. Oxford, UK: Oxford University Press.
- Einoder, L. D., D. M. Southwell, J. J. Lahoz-Monfort, G. Gillespie, A. Fisher, and B. A. Wintle. 2018. Occupancy and detectability modelling of vertebrates in northern Australia using multiple sampling methods. PLoS ONE 13 (9):e0203304. doi:https://doi.org/10.1371/journal.pone.0203304.
- Farallo, V. R., R. Wier, and D. B. Miles. 2018. The Bogert effect revisited: Salamander regulatory behaviors are differently constrained by time and space. Ecology and Evolution 8 (23):11522–32. doi:https://doi.org/10.1002/ece3.4590.
- Feder, M. E. 1983. Integrating ecology and physiology of Plethodontid salamanders. Herpetologica 39:291–310.
- Fiske, I., and R. Chandler. 2011. Unmarked: An R package for fitting hierarchical models of wildlife occurrence and abundance. Journal of Statistical Software 43 (10):1–23. doi:https://doi.org/10.18637/jss.v043.i10.
- Forcey, G. M., J. T. Anderson, F. K. Ammer, and R. C. Whitmore. 2006. Comparison of two double-observer point-count approaches for estimating breeding bird abundance. Journal of Wildlife Management 70 (6):1674–81. doi:https://doi.org/10.2193/0022-541X(2006)70[1674:COTDPA]2.0.CO;2.
- Geiger, C. 2006. Ecological requirements of the Alpine salamander Salamandra atra: Assessing the effects of current habitat structure and landscape dynamics on local distribution. Diploma Thesis, University of Bern.
- Gerrits, A. M. J., and H. H. G. Savenije. 2011. Interception. In Treatise on water science, ed. P. Wilderer, 89–101. 2nd ed. Oxford: Academic Press.
- Grant, E. H. C., R. E. Jung, J. D. Nichols, and J. E. Hines. 2005. Double-observer approach to estimating egg mass abundance of pool-breeding amphibians. Wetlands Ecology and Management 13 (3):305–20. doi:https://doi.org/10.1007/s11273-004-7524-7.
- Griffiths, R. A., J. Foster, J. W. Wilkinson, and D. Sewell. 2015. Science, statistics and surveys: A herpetological perspective. Journal of Applied Ecology 52 (6):1413–17. doi:https://doi.org/10.1111/1365-2664.12463.
- Guisan, A., S. B. Weiss, and A. D. Weiss. 1999. GLM versus CCA spatial modelling of plant species distribution. Plant Ecology 143 (1):107–22. doi:https://doi.org/10.1023/A:1009841519580.
- Günther, R., and Grossenbacher. 1996. Alpensalamander – Salamandra atra Laurenti 1768, 70–81. Jena: Gustav Fischer Verlag.
- Helfer, V., T. Broquet, and L. Fumagalli. 2012. Sex-specific estimates of dispersal show female philopatry and male dispersal in a promiscuous amphibian, the Alpine salamander (Salamandra atra). Molecular Ecology 21 (19):4706–20. doi:https://doi.org/10.1111/j.1365-294X.2012.05742.x.
- Kéry, M. 2018. Identifiability in N-mixture models: A large-scale screening test with bird data. Ecology 99 (2):281– 88. doi:https://doi.org/10.1002/ecy.2093.
- Kéry, M., and J. A. Royle. 2016. Applied hierarchical modelling in ecology. Cambridge, MA: Academic Press.
- Kéry, M., and J. A. Royle. 2020. Applied hierarchical modeling in ecology: Analysis of distribution, abundance and species richness in R and BUGS: Volume 2: Dynamic and advanced models. London: Academic Press.
- Klewen, R. F. 1986. Untersuchungen zur Verbreitung, Öko-Ethologie und innerartlichen Gliederung von Salamandra atra (Laurenti 1768). PhD thesis, Universität Köln.
- Klewen, R. F. 1988. Die landsalamander Europas 1: Die gattungen Salamandra und Mertensiella. Wittenberg, Lutherstadt: Ziemsen Verlag.
- Koneff, M. D., J. A. Royle, M. C. Otto, J. S. Wortham, and J. K. Bidwell. 2008. A double-observer method to estimate detection rate during aerial waterfowl surveys. Journal of Wildlife Manage 72:1641–49.
- Langtimm, C. A., R. M. Dorazio, B. M. Stith, and T. J. Doyle. 2011. New aerial survey and hierarchical model to estimate manatee abundance. The Journal of Wildlife Management 75 (2):399–412. doi:https://doi.org/10.1002/jwmg.41.
- Lauber, A. 2004. Methodenevaluation zum Monitoring der Alpensalamanderpopulation. Diplomarbeit, ETH Zürich, Schweiz.
- Luiselli, L., F. Andreone, D. Capizzi, and C. Anibaldi. 2001. Body size, population structure and fecundity traits of a Salamandra atra atra (Amphibia, Urodela, Salamandridae) population from the northeastern Italian Alps. Italian Journal of Zoology 68 (2):125–30. doi:https://doi.org/10.1080/11250000109356396.
- MacKenzie, D. I., J. D. Nichols, J. A. Royle, K. H. Pollock, L. Bailey, and J. E. Hines. 2017. Occupancy estimation and modeling: Inferring patterns and dynamics of species occurrence. Burlington, MA: Elsevier.
- Marques, T. A. 2009. Distance sampling: Estimating animal density. Significance 6 (3):136–37. doi:https://doi.org/10.1111/j.1740-9713.2009.00380.x.
- Mazerolle, M. J. 2020. AICcmodavg: Model selection and multimodel inference based on (Q)AIC(c). R package version 2.3-1. https://cran.r-project.org/package=AICcmodavg.
- McDiarmid, R. W., M. S. Foster, C. Guyer, J. W. Gibbons, and N. Chernoff. 2012. Reptile biodiversity. Standard methods for inventorying and monitoring. Berkeley: University of California Press.
- McMahon, C. R., J. van den Hoff, and H. R. Burton. 2005. Repeated handling and invasive research methods in wildlife research: Impacts at the population level. AMBIO: A Journal of the Human Environment 34 (6):426–29. doi:https://doi.org/10.1579/0044-7447-34.6.426.
- Nellemann, C., and P. E. Reynolds. 1997. Predicting late winter distribution of Muskoxen using an Index of Terrain Ruggedness. Arctic and Alpine Research 29 (3):334–38. doi:https://doi.org/10.2307/1552148.
- Nichols, J. D., J. E. Hines, J. R. Sauer, F. Fallon, J. Fallon, and P. J. Heglund. 2000. A double-observer approach for estimating detection probability and abundance from avian point counts. The Auk 117 (2):393–408. doi:https://doi.org/10.1093/auk/117.2.393.
- Nichols, J. D., and M. J. Conroy. 1996. Techniques for estimating abundance and species richness. In Measuring and monitoring biological diversity - standard methods for mammals, ed. D. E. Wilson, C. F. Russel, J. D. Nichols, R. Rudram, and M. S. Foster, 177–79. Washington and London: Smithsonian Institution Press.
- Peterman, W. E., and R. D. Semlitsch. 2013. Fine-scale habitat associations of a terrestrial salamander: The role of environmental gradients and implications for population dynamics. PLos One 8 (5):e62184. doi:https://doi.org/10.1371/journal.pone.0062184.
- Peterman, W. E., and R. D. Semlitsch. 2014. Spatial variation in water loss predicts terrestrial salamander distribution and population dynamics. Oecologia 176 (2):357–69. doi:https://doi.org/10.1007/s00442-014-3041-4.
- Piraccini, R., M. Cammarano, A. Costa, M. Basile, M. Posillico, L. Boitani, M. Baschetto, G. Matteucci, B. De Cinti, and A. Romano. 2017. Habitat trees and salamanders: Conservation and management implications in temperate forests. Forest Ecology and Management 384:17–25. doi:https://doi.org/10.1016/j.foreco.2016.10.048.
- Popescu, V. D., and M. L. Hunter. 2011. Clear-cutting affects habitat connectivity for a forest amphibian by decreasing permeability to juvenile movements. Ecological Applications 21 (4):1283–95. doi:https://doi.org/10.1890/10-0658.1.
- Reynolds, J. H., W. L. Thompson, and B. Russell. 2011. Planning for success: Identifying effective and efficient survey designs for monitoring. Biological Conservation 144 (5):1278–84. doi:https://doi.org/10.1016/j.biocon.2010.12.002.
- Riley, S. J., S. D. DeGloria, and R. Elliot. 1999. Index that quantifies topographic heterogeneity. Intermountain Journal of Sciences 5 (1–4):23–27.
- Romano, A., A. Costa, S. Salvidio, M. Menegon, E. Garollo, K. T. de Fatis, D. Miserocchi, G. Matteucci, and P. Pedrini. 2018b. Forest management and conservation of an elusive amphibian in the Alps: Habitat selection by the Golden Alpine salamander reveals the importance of fine woody debris. Forest Ecology and Management 424:338–44. doi:https://doi.org/10.1016/j.foreco.2018.04.052.
- Romano, A., M. Anderle, A. Forti, P. Partel, and P. Pedrini. 2018a. Population density, sex ratio and body size in a population of Salamadra atra atra on the Dolomites. Acta Herpetol 13:195–99.
- Roner, L., M. Trenti, S. Salvidio, A. Costa, P. Pedrini, and A. Romano. in press. Il monitoraggio della Salamandra alpina, Salamandra atra, in Trentino: Applicazione e validità del metodo del Doppio Osservatore in diverse condizioni meteorologiche. Atti XIII Congresso Societas Herpetologica Italica. Lipari, Messina: Il Naturalista Siciliano.
- Royle, J. A. (2004). N-mixture models for estimating population size from spatially replicated counts. Biometrics 60:108–15.
- Royle, J. A., and R. M. Dorazio. 2006. Hierarchical models of animal abundance and occurrence. Journal of Agricultural, Biological, and Environmental Statistics 11 (3):249–63. doi:https://doi.org/10.1198/108571106X129153.
- Sappington, J. M., K. M. Longshore, and D. B. Thompson. 2007. Quantifying landscape ruggedness for animal habitat analysis: A case study using bighorn sheep in the Mojave Desert. Journal of Wildlife Management 71 (5):1419–26. doi:https://doi.org/10.2193/2005-723.
- Saraux, C., C. Le Bohec, J. M. Durant, V. A. Viblanc, M. Gauthier-Clerc, M. Beaune, J. Park, N. G. Yoccoz, N. C. Stenseth, and Y. Le Maho. 2011. Reliability of flipper-banded penguins as indicators of climate change. Nature 469 (7329):203–06. doi:https://doi.org/10.1038/nature09630.
- Schmidt, B. R. 2003. Count data, detection probabilities, and the demography, dynamics, distribution, and decline of amphibians. Comptes Rendus Biologies 326:S119–S124. doi:https://doi.org/10.1016/S1631-0691(03)00048-9.
- Seber, G. A. F. 1982. Estimating animal abundance and related parameters. 2nd ed. London: Charles Griffin and Co.
- Shirose, L. J., C. A. Bishop, D. M. Green, C. J. MacDonald, R. J. Brooks, and N. J. Heleferty. 1997. Validation tests of an amphibian call count survey technique in Ontario, Canada. Herpetologica 53:312–20.
- Shrestha, Y., and R. Lapeyre. 2018. Modern wildlife monitoring technologies: Conservationists versus communities? A case study: The Terai-Arc landscape, Nepal. Conservation and Society 16 (1):91–101. doi:https://doi.org/10.4103/cs.cs_16_83.
- Sillero, N., J. Campos, A. Bonardi, C. Corti, R. Creemers, P. A. Crochet, J. Crnobrnja Isailovic, M. Denoël, G. F. Ficetola, J. Gonçalves, et al. 2014. Updated distribution and biogeography of amphibians and reptiles of Europe. Amphibia-Reptilia 35 (1):1–31. doi:https://doi.org/10.1163/15685381-00002935.
- Southwell, C. 1996. Estimation of population size and density when counts are incomplete. In Measuring and monitoring biological diversity—standard methods for mammals, ed. D. E. Wilson, C. F. Russel, J. D. Nichols, R. Rudram, and M. S. Foster, 196–210. Washington and London: Smithsonian Institution Press.
- Vitt, L. J., and J. P. Caldwell. 2013. Herpetology. An introductory biology of amphibians and reptiles. 4th ed. San Diego: Academic Press.
- Vrtiska, M. P., and L. A. Powell. 2011. Estimates of duck breeding populations in the Nebraska sandhills using double observer methodology. Waterbirds 34 (1):96–101. doi:https://doi.org/10.1675/063.034.0112.
- Williams, B. K., J. D. Nichols, and M. J. Conroy. 2002. Analysis and management of animal populations: Modeling, estimation and decision-making. Cambridge: Academic Press.
- Witmer, G. W. 2005. Wildlife population monitoring: Some practical considerations. Wildlife Research 32 (3):259–63. doi:https://doi.org/10.1071/WR04003.
- Yoccoz, N. G., J. D. Nichols, and T. Boulinier. 2001. Monitoring of biological diversity in space and time. Trends in Ecology & Evolution 16 (8):446–53. doi:https://doi.org/10.1016/S0169-5347(01)02205-4.
- Zemanova, M. A. 2021. New online resource on the 3Rs principles of animal research for wildlife biologists, ecologists, and conservation managers. Conservation 1 (2):106–12. doi:https://doi.org/10.3390/conservation1020009.