
 ?Mathematical formulae have been encoded as MathML and are displayed in this HTML version using MathJax in order to improve their display. Uncheck the box to turn MathJax off. This feature requires Javascript. Click on a formula to zoom.
ABSTRACT
Glaciers in the Pamir are the water tower of arid Central Asia, and more than 50 million people depend on meltwater from them. Many studies have reported glacier changes in the Pamir, but the glacier inventories employed in the previous investigations are both outdated and lack comparability. In this study, we present a new multitemporal glacier inventory for the Pamir based primarily on the Landsat ETM+/OLI scenes from the period around 2000 and 2017. Glacier outlines in 2000 and 2017 were delineated manually using Landsat images, SRTM digital elevation model (DEM), and high-resolution Google Earth images, using the same criteria and methods. We mapped 12,186 glaciers covering 10,396.20 ± 421.16 km2 in 2017 for the Pamir and demonstrated that the Pamir lost 124.28 ± 81.33 km2 of its glacier areas with a shrinkage rate of 1.17 ± 0.77 percent or 0.07 ± 0.05 percent·a−1 from 2000 to 2017. Based on the new inventories and the existing elevation change data sets of High Mountain Asia (HMA) from 2000 to 2016, we calculated a weaker glacier mass loss of −0.05 ± 0.06 m w.e. a−1. Spatial heterogeneity of glacier changes has been found in both the area and mass balance, but our results still suggest that the Pamir glaciers changed slightly since 2000.
Introduction
As a part of the climate system, mountain glaciers are a sensitive indicator of climate change (Jacob et al. Citation2012; Gardner et al. Citation2013; Zemp et al. Citation2015; Immerzeel et al. Citation2020). According to the Intergovernmental Panel on Climate Change Special Report on the Ocean and Cryosphere, global warming has led to the widespread shrinking of the cryosphere, which was projected to continue (Intergovernmental Panel on Climate Change Citation2019). Due to the climate change in recent decades, global glaciers except the Greenland and Antarctic ice sheets, as a whole, have contributed 27 ± 22 mm to global mean sea level rise from 1961 to 2016, which accounts for 25 to 30 percent of the entire sea level rise for the same period (Zemp et al. Citation2019). High Mountain Asia (HMA) has the greatest density of glaciers outside of the polar regions; it is therefore called the Third Pole and Asian Water Tower (Yao et al. Citation2012; Immerzeel et al. Citation2020). For the HMA, the drastic glacier changes can induce glacier hazards (landslides, glacier lake outburst floods, debris flows), which seriously affect downstream residents (Brun et al. Citation2017; Yao et al. Citation2019; Shean et al. Citation2020; Bhattacharya et al. Citation2021).
The Pamir is the mountain range spanning the borders of Tajikistan, Kyrgyzstan, Afghanistan, and China and is known as a home to giant glaciers (Goerlich, Bolch, and Paul Citation2020). According to the Randolph Glacier Inventory version 6.0 (RGI 6.0), the region features 10,233 glaciers, covering an area of 10,234 km2, or nearly 10 percent of the total glacier area for HMA (RGI Consortium Citation2017). Glaciers in the Pamir are reported to be losing mass slightly since the mid-1970s, with varied and irregular ice movement (Gardelle et al. Citation2013; Holzer et al. Citation2015; Kääb et al. Citation2015; Brun et al. Citation2017; Lin et al. Citation2017; Zhou et al. Citation2019; Shean et al. Citation2020). The glacier inventories used in previous studies are the RGI (RGI Consortium Citation2017), the GAMDAM (Glacier Area Mapping for Discharge from the Asian Mountains) Glacier Inventory (GGI 15; Nuimura et al. Citation2015), the Updated GAMDAM Glacier Inventory (GGI 18; Sakai Citation2019), and the NM 18 (Molg et al. Citation2018), but the glacier outlines in these inventories were obtained around 2000. Because of glacier change in the Pamir, these inventories are outdated, especially for the surging glaciers (Supplementary Material Figures 1c and 1d). In addition, the glacier outlines in such inventories are quite different (Supplementary Material Figures 1 and 7). In the Pamir, the glacier area calculated on the RGI 6.0 is 11.6 percent larger than the GGI 15, 2.2 percent smaller than the GGI 18, and 9.9 percent smaller than the NM 18. The differences between such inventories are mainly due to the different acquisition dates and glacier outline delineations (Nuimura et al. Citation2015; Molg et al. Citation2018; Sakai Citation2019). However, no matter which method is used in the glacier change analysis, the exact distinction between glacier and nonglacier areas is extremely important (Nuth and Kääb Citation2011; Gardelle, Berthier, and Arnaud Citation2012). Based on an Advanced Spaceborne Thermal Emission and Reflection Radiometer (ASTER)-derived digital elevation model (DEM) and geodetic method, Brun et al. (Citation2017) reported a slight negative mass balance of −0.08 ± 0.07 m w.e. a−1 from 2000 to 2016 for the Pamir. However, the glacier inventory employed in this study was the GGI 15, which has a serious underestimation of the total glacier area (more than 10 percent) for the Pamir (Molg et al. Citation2018; Sakai Citation2019). Thus, it is necessary to recalculate glacier area change and mass balance for the entire Pamir based on a new multitemporal glacier inventory.
In addition, in the Pamir, previous studies assumed a constant glacierized area in the mass change estimation (Brun et al. Citation2017; Zhou et al. Citation2019; Shean et al. Citation2020). In fact, the glaciers usually experience frequent terminus changes, especially for the surging glacier, whose terminus advances some kilometers in a few weeks or months (Bhambri et al. Citation2017; Farinotti et al. Citation2020; Goerlich, Bolch, and Paul Citation2020). The surface elevation changes of the surging glacier terminus are quick and drastic, but in previous studies, they were ignored because of the outdated glacier outlines (Supplementary Material Figures 1c and 1d). Therefore, this study has two objectives: (1) to delineate glacier outlines of the Pamir in 2000 and 2017; in this process, we did not directly edit the existing glacier inventories because the differences in these inventories are far greater than the actual glacier changes; and (2) to recalculate the area change and geodetic mass balance of the Pamir glaciers using the new glacier inventories and the existing elevation change data sets of the HMA.
Study area
The Pamir is located in the southeastern margin of Central Asia and the northwestern margin of the Qinghai–Tibet Plateau (QTP), with the Alai Range in the north and the Hindukush Range in the south (). It covers an area of more than 120,000 km2 and usually is divided into Western Pamir and Eastern Pamir by the Amu Darya Basin and Tarim River Basin (Z. Zhang et al. Citation2016; Lin et al. Citation2017). The Pamir lies in a transition zone between arid Central Asia and the QTP and thus is controlled by the prevailing westerlies (Yao et al. Citation2012; Luo et al. Citation2018). According to the meteorological records from the Fedchenko station (38.83° N, 72.22° E, and 4,179 m) in Western Pamir, the mean annual temperature and precipitation were −6.9°C and 1,140 mm for 1935 to 1990. But in the Tashkurgan station (37.78° N, 75.23° E, and 3,090 m) of Eastern Pamir, the mean annual temperature and precipitation were 3.7°C and 70 mm for 1960 to 2015.
Figure 1. Location map of the study region in QTP and overview of the Pamir.
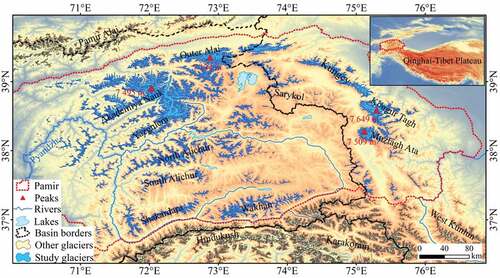
The Pamir is known as a home to many large glaciers and has a total glacier area of approximately 10,000 km2. Of these glaciers, the Fedchenko Glacier, with an area of approximately 710 km2, is one of the largest mountain glaciers in the world (Yan et al. Citation2019). As shown in , there are two regions of mountain glacier concentration in the Pamir, the Ismoil Somoni Peak (7,495 m)–Lenin Peak (7,134 m) of Western Pamir and the Muztagh Ata Peak (7,509 m)–Kongur Tagh Peak (7,649 m) of Eastern Pamir. In addition, the percentage of debris-covered area is 10 percent in the Pamir glaciers (Molg et al. Citation2018).
Data set
Landsat images
As a mapping basis, we used ten Landsat ETM+ and fourteen Landsat OLI Level 1 terrain-corrected images available from the United States Geological Survey (USGS Citation1972). The spatial resolution of the ETM+/OLI sensor is 15 m after sharpening. Among them, ten ETM+ images acquired from 1999 to 2002 were used to delineate the Pamir glacier outlines in 2000, and fourteen OLI images acquired from 2015 to 2018 were used to delineate outlines in 2017. As reported by previous studies (Nuimura et al. Citation2015; S. Y. Liu et al. Citation2015; Sakai Citation2019), it is very difficult to complete a glacier inventory in a given year, especially for an extensive region, because of the adverse effects of shade, cloud cover, and seasonal snow cover. We selected Landsat images at the end of glacier ablation season (July to September) with minimal cloud and shade and reduced the duration of Landsat image acquisition dates as much as possible (Supplementary Material Table 1). When we were unable to obtain a suitable image in 2000 or 2017 for a certain region, we used a clear image acquired in adjacent years (https://earthexplorer.usgs.gov/; USGS Citation1972). In addition, the Landsat images employed in this study covered paths 149 to 153 and rows 032 to 034 in the Worldwide Reference System 2.
SRTM DEM
A DEM is needed to retrieve ice divides and topographic information for a glacier inventory. In the process of glacier outline delineation, contour lines, basin polygons, and slope distribution maps from the DEM are useful (Guo et al. Citation2015; Sakai Citation2019). Nuimura et al. (Citation2015) tested the SRTM DEM and GDEM2 by comparing them to the ICESat GLA 14. They found that there was no significant elevation bias between the SRTM DEM and GDEM2 in the Pamir. The SRTM DEM has a precise acquisition time (February 2000), which is consistent with our 2000 glacier inventory, so we selected SRTM 3 DEM in this study, available from USGS Earth Explorer (van Zyl Citation2001).
Glacier inventories
RGI is a globally complete inventory of glacier outlines (RGI Consortium Citation2017). Version 6.0 of the RGI was released by the RGI Consortium in July 2017 and has now been integrated into the database of the Global Land Ice Measurements from Space (RGI Consortium Citation2017). GGI 15 is the first glacier inventory covering the whole HMA (Nuimura et al. Citation2015) but underestimated the glacier area because it did not include steep slopes covered with ice or snow and shadow areas. GGI 18 is the updated version of the GGI 15, which fixes the problems that existed in the former (Sakai Citation2019). GGI 18 can be downloaded from the PANGAEA (Sakai Citation2018). NM 18 is a regional glacier inventory covering the Karakoram, Pamir, and Alay and was presented by Molg et al. (Citation2018) in October 2018 (https://doi.pangaea.de/10.1594/PANGAEA.894707).
Elevation change data sets of the HMA
Brun et al. (Citation2017) calculated the glacier mass balance for the HMA from 2000 to 2016 using time series of ASTER-derived DEM, and their elevation change data sets of the HMA are freely available from the PANGAEA (https://doi.pangaea.de/10.1594/PANGAEA.876545). They applied a fully automated method to compute DEM from the ASTER stereo pairs and used these DEMs to assess glacier volume changes over the entire HMA for the period of 2000 to 2016 (Brun et al. Citation2017). The spatial resolution of the data sets is 30 m, and more details can be found in Brun et al. (Citation2017).
Methods
Preprocessing
We used the Landsat scenes to generate false-color composite images (bands 7, 2, 3 as RGB for ETM+/OLI) and true-color composite images (bands 3, 2, 1 as RGB for ETM+/OLI) using (ENVI Citation2015) software. True-color composite images were used to preliminarily confirm the glacierized areas, and false-color composite images were used for glacier outline delineation. In both true-color and false-color Landsat composite images, there are obvious color, texture, and hue differences between the clean glacier areas and nonglacier areas (Nuimura et al. Citation2015; Sakai Citation2019), but the differences are more significant in false-color images (). False-color and true-color composite images also enabled us to identify thermokarst features in debris-covered areas such as exposed ice cliffs, small ponds, and stream outlets (Molg et al. Citation2018). Additionally, high-resolution Google Earth images were used to verify glacier outlines and identify thermokarst features in debris-covered areas ().
Figure 2. Manual delineation of clear glacier outlines: (a) false-color composite landsat image (bands 7, 2, 3 as RGB) and (b) Google Earth image.
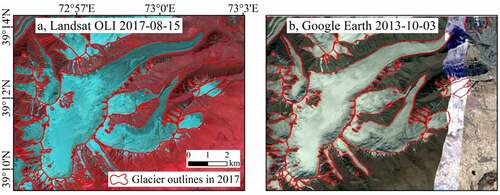
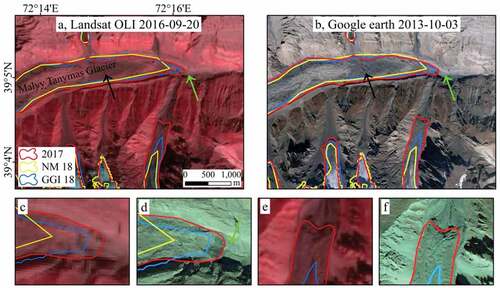
Figure 3. Manual delineation of debris-covered glacier outlines: (a) false-color composite Landsat image (bands 7, 2, 3 as RGB); (b) Google Earth image; (c) and (d) close-ups of the Malyy Tanymas Glacier tongue in Landsat and Google Earth images, respectively; (e) and (f) close-ups of another debris-covered glacier tongue in Landsat and Google Earth images, respectively.
Criteria for manual delineation
In the glacier outline delineation based on optical remote sensing images, manual improvements are considered essential, especially for debris-covered glaciers (S. Y. Liu et al. Citation2015; Molg et al. Citation2018). The percentage of debris-covered area is 10 percent in the Pamir glaciers; therefore, in this study, we employed manual delineation to extract glacier outlines. For the glacier outline delineation, we followed the approach reported in Nuimura et al. (Citation2015) and Sakai (Citation2019).
As shown in , for the clean ice areas that are largely free of debris, digitization of glacier outlines can be carried out directly according to the color differences in the false-color composite image. Following Sakai (Citation2019), our glacier polygons include the high-angle headwalls of the upper glacier, because the high-angle, avalanche-prone headwall is a part of the accumulation areas. We used time series Landsat and Google Earth images for a certain region to avoid shade, cloud, and seasonal snow cover (). We delineated outlines for a certain glacier as far as in the same image, but for some very large glaciers (e.g. Fedchenko Glacier), we had to use more images from different paths/rows.
Where glacier surfaces are largely covered by debris, glacier outlines are unable to be directly delineated in the false-color composite images (Molg et al. Citation2018; Zhou et al. Citation2018; Goerlich, Bolch, and Paul Citation2020). Supraglacial debris cover on glaciers has a unique thermal process relative to exposed snow and ice, the spatial distribution of which influences both rates and spatial patterns of melting (Y. Zhang and Liu Citation2017; Herreid and Pellicciotti Citation2020). Therefore, for the debris-covered areas, the glacier outlines were delineated based on thermokarst features in false-color composite imagery, thermal band infrared imagery, and high-resolution Google Earth imagery with a two-step process:
Firstly, we identified debris-covered glacier terminal boundaries by the combination of exposed ice cliff and stream outlet or proglacial lake in the glacier fronts (Ye et al. Citation2017; Y. Zhang and Liu Citation2017; Zhou et al. Citation2018). Due to the difference in reflectivity and surface temperature, exposed ice cliffs, stream outlets, and proglacial lakes can be easily identified in the images, especially in thermal infrared band imagery (Supplementary Material Figure 2; Nuimura et al. Citation2015). For some heavily debris-covered glacier tongues that are often in contact with lateral or frontal moraines, very high-resolution imagery available in Google Earth was used for identification. Secondly, we distinguished lateral margins for the debris-covered flat areas. This step is easier than the former because we can confirm the coverage of debris-covered areas through the thermokarst features of flat areas (e.g., small ponds surrounded by ice cliffs, crevassed surfaces) after the first step. In this process, contour lines and slope distribution maps, high-resolution Google Earth images, and thermal infrared band images were used to help identify the boundaries between debris-cover flat areas and lateral moraines (Supplementary Material Figure 2).
For example, the Malyy Tanymas Glacier is a typical debris-covered glacier in Western Pamir, and the percentage of debris-covered area is approximately 20 percent for the total glacier area (Molg et al. Citation2018). As shown in , we firstly distinguished the debris-covered glacier tongue by a combination of stream outlet and exposed ice cliff (green arrow). Then we delineated debris-covered area margins by the thermokarst features such as rugged surface topography and crevassed surfaces in the flat areas (, black arrow).
Glacier outlines delineation and quality control
We mapped 2017 glacier outlines for the Pamir with the abovementioned criteria and methods using Landsat OLI images. With this foundation, we delineated glacier outlines in 2000 with the same criteria and methods. In this process, we only revised the glacier outlines in the changed parts (e.g., glacier tongue and its lateral part). Although the glacier outlines in existing inventories (RGI 6.0, GGI 15, GGI 18, NM 18) were acquired around 2000, their differences in total glacier area are more than 10 percent (). Therefore, in this study, we present the new 2000 glacier inventory for the Pamir.
Table 1. Comparison with other glacier inventories of the Pamir
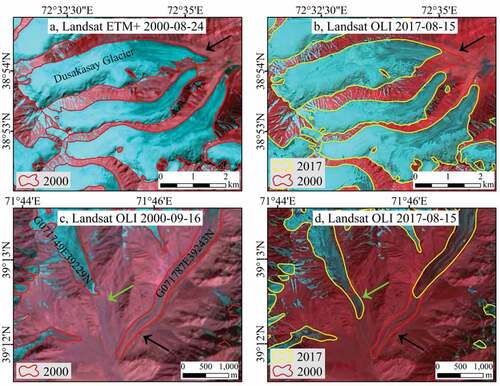
For the mountain glaciers, terminus changes (the glacier tongue and its lateral part advance, retreat, or remain stable) are the main manifestation of glacier variations (Chen et al. Citation2017; Ji et al. Citation2018; Dehecq et al. Citation2019). For both clean glaciers and debris-covered glaciers, the outline changes can be easily identified in time series images. Thus, in the delineation of 2000 Pamir glacier outlines, we directly edited the outlines in 2017 with the Landsat ETM+ images in 2000 as the reference. On the Dusakasay Glacier, which is free of debris, for example, there was an obvious recession in the glacier tongue and its lateral part from 2000 to 2017 ( and 4b, black arrow). By contrast, on the unnamed glacier G071787E39243N, the recession of the debris-covered glacier tongue was manifested by the location of the stream outlet ( and 4d, black arrow). Based on time series images, the rapid advance of surging glaciers can also be easily identified ( and 4d, green arrow; Supplementary Material Figure 3). As shown in , on the premise of accurate delineation, the outlines in 2000 only revised the changed parts compared with 2017. Therefore, we can ensure that the glacier outline changes in our inventories reflect the actual glacier changes. In addition, in our inventories, small glaciers with an area less than 0.01 km2 were excluded, which is the same as the thresholds employed by the RGI 6.0 and the GGI 18.
Figure 4. Examples of glacier outline delineation in 2000 and 2017: (a) and (b) glacier outlines in 2000 and 2017 for the same clear glaciers, respectively; (c) and (d) glacier outlines in 2000 and 2017 for a debris-covered glacier and a surging glacier, respectively.
Uncertainty of glacier outlines delineation
Glacier mapping uncertainties originate from the transitional of color changes between glacier and nonglacier areas in the false-color composite images and are dependent on the spatial resolution of the imagery (Guo et al. Citation2015; S. Y. Liu et al. Citation2015; Nuimura et al. Citation2015). Therefore, the delineation uncertainty (EA) can be evaluated by counting the number of pixels passed by the glacier outlines (S. Y. Liu et al. Citation2015; Ji et al. Citation2018; J. Liu et al. Citation2019):
where N is the number of pixels passed by the glacier outlines and can be estimated by transforming the glacier outlines to the raster with 15-m spatial resolution, and λ is the pixel area (225 m2). In the calculation, the ice divides inside the glacier areas were excluded because they did not affect the total glacier area uncertainty (S. Y. Liu et al. Citation2015).
The uncertainty for glacier area change in the Pamir from 2000 and 2017 (EAC) was calculated as follows (Z. Zhang et al. Citation2018):
where E2000 and E2017 are uncertainties in the glacier areas of 2000 and 2017, respectively. In this study, only the changed parts of the glacier outlines were considered in the calculation because the unchanged parts do not affect the glacier area change.
Results
Glacier area change
This study generated two new glacier inventories representing glacier outlines in 2000 and 2017. According to the glacier outlines in 2017, there were 12,186 glaciers with an area of 10,396.20 ± 421.16 km2 in the Pamir, unevenly distributed within the different subregions. Among them, there were 10,031 glaciers in Western Pamir (Amu Darya Basin) with a total area of 8,106.58 ± 346.24 km2 (77.98 percent ± 3.33 percent), and 2,155 glaciers in Eastern Pamir (Tarim River Basin) with a total area of 2,289.62 ± 74.92 km2 (22.02 percent ± 0.72 percent). The subregion of Ismoil Somoni Peak–Lenin Peak covers more than half of the whole glaciated surface of the Pamir. Four of the five largest Pamir glaciers (more than 100 km2) are located in this region: Fedchenko Glacier (712 km2), Grumm–Grzhimaylo Glacier (155 km2), Garmo Glacier (138 km2), and Bol Glacier (110 km2). The other largest glacier is the Kelayayilake Glacier (113 km2), which is located in the Kongur Tagh Peak of Eastern Pamir.
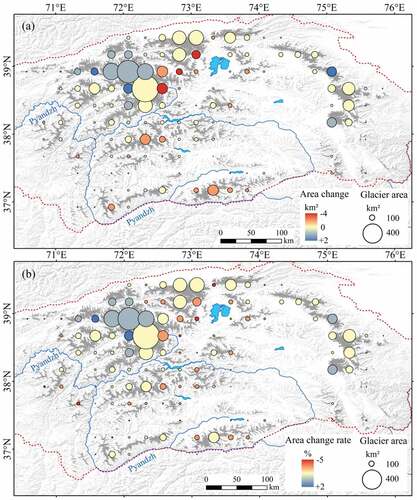
From 2000 to 2017, 124.28 ± 81.33 km2 of the Pamir’s glacier areas shrank, with a shrinkage rate of 1.17 ± 0.77 percent or 0.07 ± 0.05 percent·a−1, which is not significant for glacier change. The area changes of the Pamir glaciers were characterized by spatial heterogeneity. As shown in , a map of glacier area changes on a 0.25°×0.25° grid, the glacier area was decreased slightly in the central and southern parts of the Pamir but increased slightly in the northwestern and eastern parts. However, , a map of glacier area change rates on a 0.25°×0.25° grid, shows that although the glacier area changes in these grids were different, the area change rates in all 0.25°×0.25° grids were near zero, except for some grids with small glaciers. Therefore, as a whole, the glacier area change since 2000was not significant in the entire Pamir. The spatial pattern of glacier area changes is likely due to the surging glaciers. In our inventories, we identified fifty-eight surging glaciers in the Pamir with a total area of 1,156 km2 in 2017 (Supplementary Material Table 2, Supplementary Material Figure 4). From 2000 to 2017, the advance of surging glaciers resulted in expansion of the Pamir glacier area by 22.77 km2. Surging glaciers of the Pamir are concentrated in the Akademiya Nauk Range, Outer Alai Range, Kungey Range, and Kongur Tagh Peak, resulting in glacier area expansions in such regions (Supplementary Material Figures 5 and 6).
Figure 5. Map of glacier area change (a) and change rate (b) on a 0.25°×0.25° grid of the Pamir from 2000 to 2017.
Glacier mass balance
In this study, we recalculated the region-wide glacier mass balance of the Pamir using the new inventories and the existing elevation change data sets of the HMA. In the calculations of glacier elevation changes and mass balance, we merged the glacier polygons in 2000 and 2017 as whole glacierized areas to exclude the uncertainty of glacier area change (Chen et al. Citation2017). A glacier average density of 850 ± 60 kg·m−3, which was suggested by Huss (Citation2013), was used to convert the volume change into mass balance. Here, we observed the mass balance for 9,790 km2 glacierized areas in the Pamir, accounting for approximately 93 percent of the total glacier area.
From 2000 to 2016, the glacier surface elevation in the Pamir decreased at an average rate of 0.06 ± 0.07 m·a−1 with a mass balance of −0.05 ± 0.06 m w.e. a−1, indicating that the average mass budget of the Pamir glaciers was nearly balanced. But the spatial distribution of the glacier surface elevation changes was far from homogeneous, because many surging glaciers experienced significant thickness changes for marked thinning in accumulation areas and thickening in ablation areas (Supplementary Material Figures 5 and 6). However, there was no distinct difference in mass change between surging (−0.06 ± 0.06 m w.e. a−1) and nonsurging glaciers (−0.04 ± 0.06 m w.e. a−1). Similar mass balances for surging and nonsurging glaciers have been also reported in the Karakoram and Western Kunlun (Rankl et al. Citation2014; Wang et al. Citation2018; Farinotti et al. Citation2020). As a whole, there was a clear spatial trend of the glacier mass change in the Pamir; that is, the glaciers in the northwestern and southern parts experienced greater mass loss than those in the central and eastern parts.
Discussion
Comparison with other inventories
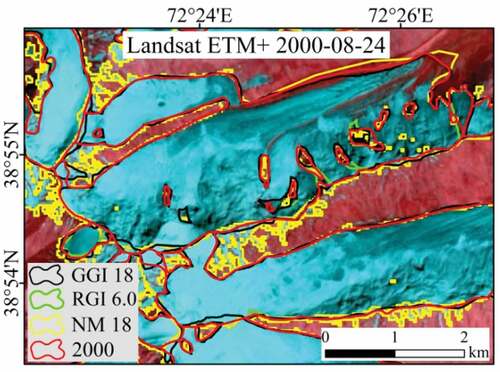
To evaluate our glacier inventories, we compared the total glacier area and number in the RGI 6.0, GGI 15, GGI 18, NM 18, and our 2000 inventory across the Pamir. lists the statistical results of glacier number and total area among these inventories. The GGI 15 excluded steep snow- and ice-covered parts from the accumulation areas and small glaciers of less than 0.05 km2 in area, resulting in a serious underestimation of the Pamir glaciers (Supplementary Material Figure 7; Sakai Citation2019). Whereas the total glacier area in our inventory is comparable to the RGI 6.0 and GGI 18, this value is significantly lower relative to the NM 18. Compared to the RGI 6.0 and GGI 18, our total glacier area is only 2.7 percent and 0.5 percent larger, respectively, but the glacier number is 15.8 percent higher and 29.5 percent lower. Relative to the NM 18, our total glacier area is 8.0 percent lower and the glacier number is 5.8 percent lower. Therefore, the difference in total glacier area is mainly related to the different glacier outline acquisition dates and delineations, and the greater difference in glacier number is potentially linked to the different divisions for large ice masses (Supplementary Material Figures 1, 7 and 8).
In the manual delineation of clear glacier outlines, we can use time series Landsat and Google Earth images to avoid shade, cloud, and seasonal snow cover (). But in the automatic delineation by the band ratio method, NM 18 only made manual corrections to the debris-covered glaciers. Therefore, in NM 18, large areas of sawtooth and seasonal snow cover were included in the glacier polygons (), which resulted in a larger total glacier area than other inventories. In the manual delineation of debris-covered glacier outlines, we established a set of criteria based on thermokarst features. However, the RGI is a collection of glacier inventories from different data sources, with different definitions and delineations of glacier outlines (RGI Consortium Citation2017). In the RGI 6.0, the glacier outlines in Eastern Pamir are derived from the Second Chinese Glacier Inventory, in Western Pamir they are derived from the GGI 18 and NM 18. Additionally, more than 50 km2 of glaciers in the Pamir were omitted in the RGI 6.0, leading to an underestimation of the total glacier area (Supplementary Material Figure 8).
Figure 6. Comparison of glacier outlines used in the NM 18, GGI 18, RGI 6.0, and our 2000 inventory at 38.90° N, 72.45° E (false-color composite image, bands 7, 2, 3 as RGB for ETM+).
Glacier change
Glacier area change has been reported for many parts of the Pamir against the background of worldwide warming (Khromova et al. Citation2006; Q. B. Zhang, Kang, and Chen Citation2013; Z. Zhang et al. Citation2016). However, previous studies did not consider a whole region, nor could they offer a comparison in a similar period for the glacier area changes. But at the subregion scale, our results show that the glacier area changes in the Pamir were characterized by spatial heterogeneity. The glacier area was increased slightly in the northwestern and eastern parts of the Pamir but decreased slightly in the southern and central parts. This spatial pattern agrees well with the previously published results from Khromova et al. (Citation2006), Q. B. Zhang, Kang, and Chen (Citation2013), and Z. Zhang et al. (Citation2016).
Based on our new inventories and the existing elevation change data sets of the HMA shared by Brun et al. (Citation2017), our study revealed that the mass balance of the entire Pamir glacier area was −0.05 ± 0.06 m w.e. a−1 for 2000 to 2016. Compared with Brun et al. (Citation2017), our results show a smaller glacier mass loss. We suggest that this disparity is likely due to two potential factors: (1) compared to the GGI 15, our new inventories covered a larger (14.0 percent) total glacier area, especially in the accumulation areas, and (2) we considered the glacier area changes in the calculation of mass balance rather than assuming a constant glacierized area. Overall, within the accepted uncertainty, our results are consistent with those of existing studies based on multitemporal DEMs (Brun et al. Citation2017; Shean et al. Citation2020). In subregions of the Pamir (e.g., the Fedchenko basin, Muztagh Ata, and Kungey Range), previous studies have also all exhibited a near-zero glacier mass balance (Gardelle et al. Citation2013; Holzer et al. Citation2015; Lin et al. Citation2017).
Pamir glaciers exhibit varying and irregular ice movements (Farinotti et al. Citation2020). In our inventories, we identified fifty-eight surging glaciers in the Pamir with a total area of 1,156 km2. Among them, fifty-five have been reported by other studies and three are newly discovered (Kotlyakov, Osipova, and Tsvetkov Citation2008; Muzinska Citation2015; Lv et al. Citation2019; Goerlich, Bolch, and Paul Citation2020). According to the surging glacier inventory based on NM 18 (Goerlich, Bolch, and Paul Citation2020), there were 186 surging glaciers in the Pamir with a total area of 2,663 km2 from 1988 to 2018. In this study we only compared the glacier outlines in 2000 and 2017, resulting in some internal surging glaciers or surging glaciers with a short active phase being undetected. Therefore, in the calculation of surface elevation changes and mass balance of surging glaciers, we used a surging glacier polygon that includes all reported surging glaciers in the Pamir (Supplementary Material Figures 5 and 6).
Conclusions
In this study, we presented two new glacier inventories for the Pamir based primarily on Landsat ETM+/OLI scenes around 2000 and 2017. Special emphasis was given to the manual delineation criteria and methods for clear glaciers and debris-covered glaciers. In the glacier outline delineation, we used time series Landsat and Google Earth images for a certain region to avoid shade, cloud, and seasonal snow cover. For the glacier outlines in 2000, we directly edited the outlines in 2017 with the Landsat ETM+ images as the reference. Therefore, the glacier outline changes in our inventories reflect the actual glacier changes.
We mapped 12,186 glaciers covering 10,396.20 ± 421.16 km2 in 2017 for the entire Pamir and demonstrated that the Pamir lost 124.28 ± 81.33 km2 of its glacier area with a shrinkage rate of 1.17 ± 0.77 percent or 0.07 ± 0.05 percent·a−1 from 2000 to 2017. Based on new inventories and the existing elevation change data sets of the HMA from 2000 to 2016, we suggest a smaller glacier mass loss of −0.05 ± 0.06 m w.e. a−1 than reported in previous studies. Spatial heterogeneity of glacier changes has been found in both area and mass balance; however, these results still suggest that the Pamir glaciers changed slightly since 2000.
Supplemental Material
Download Zip (1.9 MB)Acknowledgments
We thank the USGS for providing access to the Landsat images and SRTM DEM. We gratefully acknowledge the contributors of the RGI 6.0, GGI 15, GGI 18, and NM 18. We also thank all contributors to the elevation change data sets of the HMA.
Disclosure statement
No potential conflict of interest was reported by the authors.
Supplementary material
Supplemental material for this article can be accessed on the publisher’s website
Additional information
Funding
References
- Bhambri, R., K. Hewitt, P. Kawishwar, and B. Pratap. 2017. Surge-type and surge-modified glaciers in the Karakoram. Scientific Reports 7 (1):15391. doi:10.1038/s41598-017-15473-8.
- Bhattacharya, A., T. Bolch, K. Mukherjee, O. King, B. Menounos, V. Kapitsa, N. Neckel, W. Yang, and T. D. Yao. 2021. High Mountain Asian glacier response to climate revealed by multi-temporal satellite observations since the 1960s. Nature Communications 12:4133. doi:10.1038/s41467-021-24180-y.
- Brun, F., E. Berthier, P. Wagnon, A. Kääb, and D. Treichler. 2017. A spatially resolved estimate of High Mountain Asia glacier mass balances from 2000 to 2016. Nature Geoscience 10 (9):668–73. doi:10.1038/NGEO2999.
- Chen, A. A., N. L. Wang, Z. Li, Y. W. Wu, W. Zhang, and Z. M. Guo. 2017. Region-wide glacier mass budgets for the Tanggula Mountains between ~1969 and ~2015 derived from remote sensing data. Arctic, Antarctic, and Alpine Research 49 (4):551–68. doi:10.1657/AAAR0016-065.
- Dehecq, A., N. Gourmelen, A. S. Gardner, F. Brun, D. Goldberg, P. W. Nienow, E. Berthier, C. Vincent, P. Wagnon, and E. Trouve. 2019. Twenty-first century glacier slowdown driven by mass loss in High Mountain Asia. Nature Geoscience 12 (1):22–27. doi:10.1038/s41561-018-0271-9.
- Environment for Visualizing Images (ENVI). 2015. https://www.enviidl.com/.
- Farinotti, D., W. W. Immerzeel, R. J. Kok, D. J. Quincey, and A. Dehecq. 2020. Manifestations and mechanisms of the Karakoram glacier Anomaly. Nature Geoscience 13 (1):8–16. doi:10.1038/s41561-019-0513-5.
- Gardelle, J., E. Berthier, and Y. Arnaud. 2012. Impact of resolution and radar penetration on glacier elevation changes computed from DEM differencing. Journal of Glaciology 58 (208):419–22. doi:10.3189/2012JoG11J175.
- Gardelle, J., E. Berthier, Y. Arnaud, and A. Kääb. 2013. Region-wide glacier mass balances over the Pamir-Karakoram-Himalaya during 1999–2011. The Cryosphere 7 (4):1263–86. doi:10.5194/tc-7-1263-2013.
- Gardner, A. S., G. Moholdt, J. G. Cogley, B. Wouters, A. A. Arendt, J. Wahr, E. Berthier, R. Hock, W. T. Pfeffer, G. Kaser, et al. 2013. A reconciled estimate of glacier contributions to sea level rise: 2003 to 2009. Science 340 (6134):852–57. doi:10.1126/science.1234532.
- Goerlich, F., T. Bolch, and F. Paul. 2020. More dynamic than expected: An updated survey of surging glacier in the Pamir. Earth System Science Data 12:3161–76. doi:10.5194/essd-12-3161-2020.
- Guo, W. Q., S. Y. Lin, J. L. Xu, L. Z. Wu, D. H. Shangguan, X. J. Yao, J. F. Wei, W. J. Bao, P. C. Yu, Q. Liu, et al. 2015. The second Chinese glacier inventory: Data, methods and results. Journal of Glaciology 61 (226):357–72. doi:10.3189/2015JoG14J227.
- Herreid, S., and F. Pellicciotti. 2020. The state of rock debris covering Earth’s glaciers. Nature Geoscience 13 (9):621–27. doi:10.1038/s41561-020-0615-0.
- Holzer, N., S. Vijay, T. D. Yao, B. Q. Xu, M. Buchroithner, and T. Bolch. 2015. Four decades of glacier variations at Muztagh Ata (eastern Pamir): A multi-sensor study including Hexagon KH-9 and Pléiades data. The Cryosphere 9 (6):2071–88. doi:10.5194/tc-9-2071-2015.
- Huss, M. 2013. Density assumptions for converting geodetic glacier volume change to mass change. The Cryosphere 7 (3):877–87. doi:10.5194/tc-7-877-2013.
- Immerzeel, W. W., A. F. Lutz, M. Andrade, A. Bahl, H. Biemans, T. Bolch, S. Hyde, S. Brumby, B. J. Davies, A. C. Elmore, et al. 2020. Importance and vulnerability of the world’s water towers. Nature 577 (7790):364–69. doi:10.1038/s41586-019-1822-y.
- Intergovernmental Panel on Climate Change. 2019. IPCC Special Report on the Ocean and Cryosphere in a Changing Climate. https://www.ipcc.ch/srocc/.
- Jacob, T., J. Wahr, W. T. Pfeffer, and S. Swenson. 2012. Recent contributions of glaciers and ice caps to sea level rise. Nature 482 (7386):514–18. doi:10.1038/nature10847.
- Ji, Q., T. B. Yang, J. Dong, and Y. He. 2018. Glacier variations in response to climate change in the eastern Nyainqentanglha range, Tibetan Plateau from 1999 to 2015. Arctic, Antarctic, and Alpine Research 50 (1):e1435844. doi:10.1080/15230430.2018.1435844.
- Kääb, A., D. Treichler, C. Nuth, and E. Berthier. 2015. Brief communication: Contending estimates of 2003-2008 glacier mass balance over the Pamir-Karakoram-Himalaya. The Cryosphere 9 (2):557–64. doi:10.5194/tc-9-557-2015.
- Khromova, T. E., G. B. Osipova, D. G. Tsvetkov, M. B. Dyurgerov, and R. G. Barry. 2006. Changes in glacier extent in the eastern Pamir, Central Asia, determined from historical data and ASTER imagery. Remote Sensing of Environment 102 (1–2):24–32. doi:10.1016/j.rse.2006.01.019.
- Kotlyakov, V. M., G. B. Osipova, and D. G. Tsvetkov. 2008. Monitoring surging glaciers of the Pamirs, Central Asia, from space. Annals of Glaciology 48 (1):125–34. doi:10.3189/172756408784700608.
- Lin, H., G. Li, L. Cuo, A. Hooper, and Q. H. Ye. 2017. A decreasing glacier mass balance gradient from the edge of the Upper Tarim Basin to the Karakoram during 2000-2014. Scientific Reports 7:6712. doi:10.1038/s41598-017-07133-8.
- Liu, S. Y., X. J. Yao, W. Q. Guo, J. L. Xu, D. H. Shangguan, J. F. Wei, W. J. Bao, and L. Z. Wu. 2015. The contemporary glaciers in China based on the second Chinese Glacier inventory. Acta Geographica Sinica 70 (1):3–16. (In Chinese). doi:10.11821/dlxb201501001.
- Liu, J., X. J. Yao, S. Y. Liu, W. Q. Guo, and J. L. Xu. 2019. Glacier changes in the Gangdisê Mountains from 1970 to 2016. Acta Geographica Sinica 74 (7):1333–44. (In Chinese). doi:10.11821/dlxb201907005.
- Luo, Y., X. L. Wang, S. L. Piao, L. Sun, P. Ciais, Y. Q. Zhang, C. K. Ma, R. Gan, and C. S. He. 2018. Contrasting streamflow regimes induced by melting glaciers across the Tien Shan-Pamir -North Karakoram. Scientific Reports 8:16470. doi:10.1038/s41598-018-34892-2.
- Lv, M. Y., H. D. Guo, X. C. Lu, G. Liu, S. Y. Yan, Z. X. Ruan, Y. X. Ding, and D. J. Quincey. 2019. Characterizing the behaviour of surge- and non-surge-type glaciers in the Kingata Mountains, eastern Pamir, from 1999 to 2016. The Cryosphere 13 (1):219–36. doi:10.5194/tc-13-219-2019.
- Molg, N., T. Bolch, P. Rastner, T. Strozzi, and F. Paul. 2018. A consistent glacier inventory for Karakoram and Pamir derived from Landsat data: Distribution of debris cover and mapping challenges. Earth System Science Data 10 (4):1807–27. doi:10.5194/essd-2018-35.
- Muzinska, A. 2015. Transport conditions of mountain-surging glaciers as recorded in the micromorphology of quartz grains (Medvezhiy Glacier, West Pamir). Geologos 21 (2):127–38.
- Nuimura, T., A. Sakai, K. Taniguchi, H. Nagai, D. Lamsal, S. Tsutaki, A. Kozawa, Y. Hoshina, S. Takenaka, S. Omiya, et al. 2015. The GAMDAM glacier inventory: A quality-controlled inventory of Asian glaciers. The Cryosphere 8 (3):849–64. doi:10.5194/tc-9-849-2015.
- Nuth, C., and A. Kääb. 2011. Co-registration and bias corrections of satellite elevation data sets for quantifying glacier thickness change. The Cryosphere 5 (1):271–90. doi:10.5194/tc-5-271-2011.
- Rankl, M., S. Vijay, C. Kienholz, and M. Braun. 2014. Glacier changes in the Karakoram region mapped by multimission satellite imagery. The Cryosphere 8 (3):977–89. doi:10.5194/tc-7-4065-2013.
- RGI Consortium. 2017. Randolph glacier inventory–a dataset of global glacier outlines: Version 6.0: Technical report. Global Land Ice Measurements from Space. Colorado, USA: Digital Media. doi:10.7265/N5-RGI-60. http://www.glims.org/RGI/randolph60.html
- Sakai, A. 2018. GAMDAM glacier inventory for High Mountain Asia. Pangaea. doi:10.1594/PANGAEA.891423. https://doi.pangaea.de/10.1594/PANGAEA.891423
- Sakai, A. 2019. Brief communication: Updated GAMDAM glacier inventory over high-mountain Asia. The Cryosphere 13 (7):2043–49. doi:10.5194/tc-13-2043-2019.
- Shean, D. E., S. Bhushan, P. Montesano, D. R. Rounce, A. Arendt, and B. Osmanoglu. 2020. A systematic, regional assessment of High Mountain Asia glacier mass balance. Frontiers in Earth Science 7:363. doi:10.3389/feart.2019.00363.
- United States Geological Survey (USGS). 1972. Landsat Missions. https://earthexplorer.usgs.gov/
- van Zyl, J. 2001. The Shuttle Radar Topography Mission (SRTM): A breakthrough in remote sensing of topography. Acta Astronautica 48 (5–12):559–65. doi:10.1016/S0094-5765(01)00020-0. https://earthexplorer.usgs.gov/
- Wang, Y. T., S. G. Hou, B. J. Huai, W. L. An, H. X. Pang, and Y. P. Liu. 2018. Glacier anomaly over the western Kunlun Mountains, Northwestern Tibetan Plateau, since the 1970s. Journal of Glaciology 64 (246):624–36. doi:10.1017/jog.2018.53.
- Yan, S. Y., Y. T. Zheng, Y. Li, F. K. Lang, and Z. Ruan. 2019. A spatio-temporal variation analysis of Fedchenko and Grumm-Grzhimaylo glacier motion pattern with an efficient pixel-tracking method on spaceborne SAR imagery. Environmental Earth Sciences 78:599. doi:10.1007/s12665-019-8610-8.
- Yao, T. D., L. Thompson, W. Yang, W. S. Yu, Y. Gao, X. J. Guo, X. X. Yang, K. Q. Duan, H. B. Zhao, B. Q. Xu, et al. 2012. Different glacier status with atmospheric circulations in Tibetan Plateau and surroundings. Nature Climate Change 2 (9):663–67. doi:10.1038/NCLIMATE1580.
- Yao, T. D., G. J. Wu, B. Q. Xu, W. C. Wang, J. Gao, and B. S. An. 2019. Asia water tower change and its impacts. Bulletin of the Chinese Academy of Sciences 34 (11):1203–09. (In Chinese). doi:10.16418/j.1000-3045.2019.11.003.
- Ye, Q. H., J. B. Zong, L. D. Tian, J. G. Cogley, C. Q. Song, and W. Q. Guo. 2017. Glacier changes on the Tibetan Plateau derived from Landsat imagery: Mid-1970s-2000-13. Journal of Glaciology 63 (238):273–87. doi:10.1017/jog.2016.137.
- Zemp, M., H. Frey, I. Gartner-Roer, S. U. Nussbaumer, M. Hoelzle, F. Paul, W. Haeberli, F. Denzinger, A. P. Ahlstrom, B. Anderson, et al. 2015. Historically unprecedented global glacier decline in the early 21st century. Journal of Glaciology 61 (228):745–62. doi:10.3189/2015JoG15J017.
- Zemp, M., M. Huss, E. Thibert, N. Eckert, R. McNabb, J. Huber, M. Barandun, H. Machguth, S. U. Nussbaumer, I. Gartner-Roer, et al. 2019. Global glacier mass changes and their contributions to sea-level rise from 1961 to 2016. Nature 568 (7752):382–86. doi:10.1038/s41586-019-1071-0.
- Zhang, Q. B., S. C. Kang, and F. Chen. 2013. Glacier variations in the Fedchenko basin, Tajikistan, 1992–2006: Insights from remote-sensing images. Mountain Research and Development 34 (1):56–65. doi:10.1659/MRD-JOURNAL-D-12-00074.1.
- Zhang, Y., and S. Y. Liu. 2017. Research progress on debris thickness estimation and its effect on debris-covered glaciers in western China. Acta Geographica Sinica 72 (9):1606–20. (In Chinese). doi:10.11821/dlxb201709006.
- Zhang, Z., S. Y. Liu, Y. Zhang, J. F. Wei, Z. L. Jiang, and K. P. Wu. 2018. Glacier variations at Aru Co in western Tibet from 1971 to 2016 derived from remote-sensing data. Journal of Glaciology 64 (245):397–406. doi:10.1017/jog.2018.34.
- Zhang, Z., J. L. Xu, S. Y. Liu, W. Q. Guo, J. F. Wei, and T. Feng. 2016. Glacier changes since the early 1960s, eastern Pamir, China. Journal of Mountain Science 13 (2):276–91. doi:10.1007/s11629-014-3172-4.
- Zhou, Y. S., Z. W. Li, J. Li, R. Zhao, and X. L. Ding. 2018. Glacier mass balance in the Qinghai–Tibet Plateau and its surroundings from the mid-1970s to 2000 based on Hexagon KH-9 and SRTM DEMs. Remote Sensing of Environment 210:96–112. doi:10.1016/j.rse.2018.03.020.
- Zhou, Y. S., Z. W. Li, J. Li, R. Zhao, and X. L. Ding. 2019. Geodetic glacier mass balance (1975-1999) in the central Pamir using the SRTM DEM and KH-9 imagery. Journal of Glaciology 65 (250):309–20. doi:10.1017/jog.2019.8.