
 ?Mathematical formulae have been encoded as MathML and are displayed in this HTML version using MathJax in order to improve their display. Uncheck the box to turn MathJax off. This feature requires Javascript. Click on a formula to zoom.
ABSTRACT
Shrub expansion is among the most conspicuous of the warming-related phenomena occurring within tundra regions, but its effects on vertebrates are not well understood. Among passerines, the habitats of shrub- and tundra-adapted species are expected to increase and decrease, respectively, by roughly equivalent amounts. However, shrub expansion is highly discontinuous, and these predictions are typically based on coarse-scale models of vegetation that permit limited spatial heterogeneity. We used a hindcasting approach to investigate spatial and interspecific heterogeneity in passerine densities through time, as a function of changes in Normalized Difference Vegetation Index (NDVI). We conducted line transect surveys of passerines between 2015 and 2019 at four sites in arctic and subarctic Alaska. Collecting the encounter locations permitted fine-scale assessment of covariates of density. We fit spatial distance sampling models to these data and then used the predicted relationship between passerine density and NDVI to hindcast changes in density since 1999. Our hindcasts suggested limited areal changes in the habitat of tundra-adapted species over the last twenty years while the habitat corresponding to tall shrub–adapted species has likely expanded. Thus, our results contrast with previous predictions due partially to the finer spatial scale of our inference, which allowed for portions of the landscape to resist shrub expansion.
Introduction
Warming in the Subarctic and Arctic is amplified, inducing a cascade of impacts within tundra regions (Sturm et al. Citation2005; Post et al. Citation2009; Clegg and Hu Citation2010). Shrub expansion is among the most conspicuous of these phenomena and is evident across the circumpolar Arctic (Myers–Smith et al. Citation2011; Frost and Epstein Citation2014). Colonization by tall shrubs along riparian corridors and on hillslopes is the most visible example (Sturm, Racine, and Tape Citation2001; Tape, Sturm, and Racine Citation2006), but a general pattern of greening across tundra landscapes is also apparent (e.g., Verbyla Citation2008; Jia, Epstein, and Walker Citation2009; Pouliot, Latifovic, and Olthof Citation2009), driven largely by increases in the cover of both dwarf and tall shrubs (Fraser et al. Citation2014).
These changes in vegetation structure and composition are expected to affect the distribution of vertebrates (reviewed in Wheeler, Høye, and Svenning Citation2018). For example, the recent range expansions of moose (Alces alces gigas) and snowshoe hare (Lepus americanus) in Arctic Alaska appear to be linked to riparian shrub expansion in the region (Tape et al. Citation2016a, Citation2016b). In Subarctic Alaska, shrub-adapted passerines have exhibited rapid upslope shifts in distribution apparently tracking the expansion of shrubs into higher elevations (Mizel et al. Citation2016; Mizel, Schmidt, and McIntyre Citation2021). Such shifts in distribution are expected among shrub-adapted passerines, but the response of tundra-adapted species has received relatively little study. In one such study, Boelman et al. (Citation2015) predicted a 20 to 60 percent increase in the shrub-dominated habitat of white-crowned sparrow (Zonotrichia leucophrys gambelii) and an equivalent decrease in the graminoid-dominated tundra habitat of Lapland longspur (Calcarius lapponicus) in the Brooks Range foothills of Arctic Alaska by 2050. However, these predictions were based on modeling vegetation change at a coarse spatial scale (a 4.5-km pixel) that fails to accommodate much of the spatial heterogeneity in the extent of shrub expansion (Boelman et al. Citation2015).
Though the signal of vegetation change in tundra regions is evident at coarse spatial scales (Goetz et al. Citation2005; Bunn and Goetz Citation2006; Jia, Epstein, and Walker Citation2006; Verbyla Citation2008), shrub expansion is highly discontinuous, occurring primarily along rock outcrops, hillslopes, floodplains, and areas of incised topography (Tape et al. Citation2012; Swanson Citation2013, Citation2015; Brodie et al. Citation2019). Soil characteristics (e.g., acidity, thaw depth, and drainage; Tape et al. Citation2012; Swanson Citation2015), herbivory (Olofsson et al. Citation2009; Christie et al. Citation2015), climate (Swanson Citation2015; Brodie et al. Citation2019), and disturbance history (Higuera et al. Citation2009) all mediate shrub distribution in tundra environments and, consequently, result in varied susceptibility of the landscape to shrub expansion. In Arctic Alaska, tussock tundra appears to be relatively resistant to shrub expansion and mesic sedge/Dryas tundra shows only modest evidence of recent increases in shrub density (Swanson Citation2013). Thus, failing to capture spatial heterogeneity in the extent of shrub expansion when forecasting passerine distribution may be biased toward predictions of complementary responses on the part of tundra- and shrub-adapted species.
Here, we hindcast passerine density as a function of changes in the annual maximum Normalized Difference Vegetation Index (NDVI; Tucker and Sellers Citation1986). We used data from ten species at four sites in Arctic and Subarctic Alaska, thereby permitting assessment of spatial and interspecific heterogeneity in changes in density. The passerine data were collected between 2015 and 2019 using distance sampling line transect methods and were unique in the sense that they comprise individual encounter locations rather than counts aggregated at the plot level, thereby allowing fine-scale assessment of spatial variation in density under a point process framework (Hedley and Buckland Citation2004; Mizel, Schmidt, and Lindberg Citation2018). We used these data together with the NDVI time series to model current distribution of passerine species and to make predictions about their density in 1999, approximately twenty years prior to our surveys. Annual maximum NDVI strongly correlates with shrub cover in tundra environments and is used widely for landscape-level assessment of changes in tundra vegetation structure (Jia, Epstein, and Walker Citation2003; Riedel, Epstein, and Walker Citation2005; Blok et al. Citation2011; Pattison et al. Citation2015).
Our hindcasts assumed that density in the past is a deterministic function of changes in NDVI. Therefore, our inference was to relative changes across species and sites due to changes in NDVI alone, which is analogous to predicting areal changes in potential habitat. That is, the predicted differences in bird density served as our unit of relative change in habitat. Given our focus on relative differences due to changes in breeding habitat alone, our objectives did not include predicting actual population trajectories that integrate numerous factors outside of breeding habitat structure. However, we expect that our hindcasts will help understand the extent to which current and future trends in the density of passerines may incorporate the effects of habitat change. We expected that our hindcasts would yield predictions of lower density for shrub-adapted species in 1999 compared to the present and we expected that species associated with tussock and alpine tundra would show limited predicted differences in density over this time period due to the relatively low susceptibility of these habitats to shrub expansion (Swanson Citation2013, Citation2015).
Methods
Study area
The study area is located within the U.S. National Park Service’s Arctic and Central Alaska Inventory and Monitoring Networks. We established four long-term monitoring sites targeting passerine assemblages breeding above treeline. Three sites are located at similar latitudes in the Arctic but are aligned along a longitudinal gradient extending from the central to western Brooks Range (). The lone subarctic site is located more than 500 km to their south in the Alaska Range (). Sites were located at access points including tundra airstrips in Noatak National Preserve (hereafter, arctic-west and arctic-central sites, respectively), the village of Anaktuvuk Pass within Gates of the Arctic National Park and Preserve (arctic-east), and along a gravel road in Denali National Park and Preserve (subarctic; ). We surveyed one site in each year from 2015 to 2019, resulting in only one of the four sites being resurveyed (arctic-east in 2015 and 2018). Because we were not specifically interested in interannual variation in density, we fit the same model to both years of data from the arctic-east site while allowing for site and year stochasticity through the incorporation of random effects (see below).
Figure 1. (a) Location of passerine monitoring sites in three national parks in Alaska including arctic-west (AW) and arctic-central (AC) in Noatak National Preserve, arctic-east (AE) in Gates of the Arctic National Park and Preserve, and subarctic (SU) in Denali National Park and Preserve. (b) An example of our route, plot, and grid configuration from the arctic-central site.
Mean elevations at the four study sites vary from 380 m at the arctic-west site to 1,140 m at the subarctic site (Supporting Information, Table S1). As a result of regional latitudinal and longitudinal temperature trends, the mean July temperatures at the four sites are similar and range from about 8.5°C to 11.5°C (PRISM Climate Group Citation2020; Supporting Information, Table S1). Based on ground sampling in the Arctic Inventory and Monitoring Network, shrub canopy volume (Canopy cover × Height of medium to tall shrubs) is typically low below 10°C mean July temperature and may exceed 1 m3/m2 (volume per unit area) at 11°C or higher on suitable sites (Supporting Information, Figure S1).
Each site covers an elevational gradient from lowland tundra to alpine habitats including upland and riparian shrublands, herb- and low shrub–dominated wet tundra, mesic to dry Dryas and/or mixed dwarf shrub tundra, and barren slopes (Boggs et al. Citation2001; Jorgenson et al. Citation2009; Supporting Information, Tables S3 and S4). NDVI generally increases along a vegetation density gradient, from an average of 0.31 for barrens ecotypes to 0.54 for dwarf shrub (<0.2 m) ecotypes, 0.64 for herbaceous ecotypes, 0.68 for low shrub (0.2–1.5 m) ecotypes, and 0.77 for tall shrub (>1.5 m) ecotypes (Swanson and Neitlich Citation2016; after Viereck et al. Citation1992, Supporting Information, Table S5). NDVI varies widely within these basic structural classes due to the wide range in species and canopy covers that they encompass.
Though maximum NDVI is a coarse representation of the underlying vegetation gradient, it has fundamental relationships with ecological variables in tundra environments. This becomes apparent when we examine the shape of the NDVI–ecological variable relationship across studies. Specifically, we identified three studies in arctic tundra environments that fit exponential regressions with maximum NDVI as the independent variable and some ground-measured ecological variable as the response. The response variables were diverse and included arthropod biomass (Sweet et al. Citation2015), shrub aboveground biomass (Berner et al. Citation2018), and vegetation height (Bartsch et al. Citation2020). However, the shapes of these relationships are remarkably similar after standardizing the response to have mean 0 and standard deviation 1 (). That is, the expected change in the standardized ecological response per unit of NDVI was similar across these studies. This implies that NDVI is capable of capturing variation in productivity and structure in tundra environments that is likely driven to a large extent by the density of deciduous shrubs.
Figure 2. Exponential relationships between maximum NDVI and ecological variables in arctic tundra. In the main plot, the relationships are shown for the same range of NDVI values (0.5–0.8) with the response (the ecological variable) standardized to have mean 0 and SD = 1. The insets show these relationships on their real scale within the range of NDVI values evaluated in each study and with line types corresponding to those shown in the main plot, although they overlap considerably. The three insets include (a) (Bartsch et al. Citation2020), (b)
(Berner et al. Citation2018), and (c)
(Sweet et al. Citation2015).
NDVI change
We derived NDVI rasters from 30-m resolution Landsat data (Landsats 5–8) in the U.S. Geological Survey’s Landsat Analysis-Ready Data (ARD) collection (Sauer and Dwyer Citation2018). The Landsat ARD collection contains atmospherically corrected surface reflectance data organized into a regular grid of 150 × 150 km tiles. We limited these data to all tiles with less than 40 percent cover of clouds/cloud shadow and those that were taken during the period of June through August, 1999–2019. Landsat coverage in our study area was sporadic until 1999, when multiple passes became available every summer.
We used the quality band within each Landsat ARD tile to designate as missing data all pixels classified with medium to high confidence as cloud, cloud shadow, snow, or ice. We corrected for slight differences in the band definitions of Landsat 8 using the method developed in Roy et al. (Citation2016).
For each study area and year, we constructed a composite of the maximum NDVI values representing the peak growing season value. Peak NDVI correlates strongly with tundra vegetation structure, especially shrub density (Walker et al. Citation2005). Annual maximum values did not always represent the peak of the growing season due to the presence of cloud cover during the relatively short arctic summer and the scan-line corrector failure that affected Landsat 7 starting in 2003. Off-peak NDVI values reflect stages of leaf-out or senescence that do not properly represent the vegetation structure, which introduces error in peak NDVI values when ignored. That is, the raw, maximum NDVI values for each year contain a considerable amount of noise in relation to the peak greenness of deciduous shrubs, which is likely relatively static absent their incremental expansion. Because this was underlying process of interest in our hindcasts, we modeled peak NDVI using three-year composites to minimize this noise. Specifically, we aggregated the annual peak NDVI data from groups of three consecutive years (1999–2001, 2002–2005, …, 2017–2019), identifying each by the middle year, and computed the maximum of the three years to obtain a more reliable peak NDVI value. We then fit pixel-level linear regressions to the seven three-year composite values to obtain annual predictions of maximum NDVI using the “raster” package in R (Hijmans et al. Citation2015; R Core Team Citation2018). Our composite approach sacrificed some precision to reduce bias, which in turn resulted in more conservative estimates of hindcasted changes in bird density due to filtering changes in NDVI by significance level (see below).
Passerine surveys
We adopted a route-based, continuous effort survey design to maximize encounter rates of passerines. At the three roadless sites in the Arctic, we centered a grid comprising 600 × 600 m cells on the access point (). We used this grid to establish a series of survey routes that radiated outwards from the access point (i.e., the basecamp/airstrip), permitting us to survey all accessible cells within 6.75 km (). At the subarctic site, the grid was centered along the Denali park road and designated parking areas were used as access points for individual routes.
Routes were designed to be completed in a single day and were allowed to change direction in part to return observers close to their original starting point. In general, routes were located such that they intersected the centroid of each cell and then were deflected at an angle of 0° or 90° (i.e., followed a parallel or perpendicular direction; ). In some cases, we shifted routes off the central axis of the cell due to the presence of cliffs and high flow creeks. At each site, we surveyed twelve to seventeen routes an average of 3.6 times per season. Routes were fixed after their initial survey with one exception. During the pilot season (2015) at arctic-east, adjustments were made to the routes after their initial visit, necessitating survey-level indexing of the detection function in the analysis.
We conducted surveys of each route as if they were one continuous line transect, recording one observation per individual bird during a given route visit. Two-person survey teams included a data recorder who transcribed all encounter information spoken by the observer. Upon detecting a bird, we took a bearing and waypoint from our location along the line and used a laser range finder to estimate the distance to the bird. The encounter locations were projected in continuous space in ArcGIS using the waypoint, bearing, and distance data collected in the field. With one exception, the analysis was restricted to detections of singing males, which can be reasonably expected to represent the breeding population. For American pipit (Anthus rubescens), we pooled singing and calling detections based on similar detection functions estimated for both types of observations during exploratory modeling.
We delineated plots within each route by buffering the route using a species-specific truncation distance (based on removing ~5 percent of the furthest detections; Buckland et al. Citation2001) and clipping the buffered area at the intersection of the route and grid cell boundaries (see ). The purpose of separating the route-level survey strip into multiple plots was to accommodate variation in temperature over the course of a route visit (see below). We then overlaid a grid of 30-m pixels on each study site g= 1, …, G and assigned the observed encounter locations to the nearest pixel centroid leading to a data structure, which was a series of counts in pixel i= 1, …, I, in plot j = 1, …, J, and on visit t = 1, …, T (Mizel, Schmidt, and Lindberg Citation2018).
Analyses
Predicting the distributions of terrestrial vertebrate species in time and space is made difficult because vegetation trajectories are often relatively uncertain, themselves outcomes of multiple interacting processes. Specifically, the formation of new vegetation communities by shrub expansion at our sites is rate limited (by plant dispersal and growth rates) and limited at fine geographic scales by edaphic factors (Tape et al. Citation2012; Swanson Citation2015). Given the uncertainty associated with forward predictions of vegetation structure, we used a hindcasting approach to predict relative changes in passerine density across species and study areas due to the observed changes in maximum NDVI (hereafter, NDVI). At fine scales, NDVI explains much of the variation in passerine density in above-treeline areas (Mizel, Schmidt, and Lindberg Citation2018), in part due to the structural simplicity of the habitat and the distinctive reflectance patterns corresponding to barren ground, open tundra, and tall shrubs. On this basis, we modeled passerine density as a partial function of NDVI predicted for the survey year (2016–2019) from the pixel-level linear regressions. These models of current density then served as a baseline for hindcasting density with NDVI predicted for 1999 (the initial year in our NDVI timeseries).
Current passerine density
We fit spatial distance sampling models (Hedley and Buckland Citation2004) individually to each of ten species with sufficient data for assessing covariates of density at two or more of the sites. Our model yielded inference about density of the population that was present and available for detection. That is, we accommodated imperfect detection via the detection function, which describes the monotonic decrease in detectability with distance from the line. However, the repeated surveys were used to model variation in availability or song rate as nuisance parameters in a Poisson regression framework (Link and Sauer Citation1997; Oedekoven et al. Citation2013).
The focus was on estimating the intensity function for an inhomogenous Poisson point process of the individual encounter locations (Mizel, Schmidt, and Lindberg Citation2018):
where is the expected number of individuals per pixel, the
are the study site–specific vectors of
coefficients, and
is the corresponding
matrix of spatial covariates. The spatial covariates
were made specific to each study site because elevations varied considerably across sites and to prevent one site from affecting the hindcasted predictions of the others.
The spatial covariates included the linear and quadratic effects of NDVI and elevation and the linear effect of solar radiation. The latter effect corresponded to the typical solar radiation (WH/m2) accumulated on 8 June (the average midpoint of our survey) given a generally clear sky. It was derived using the area solar radiation tool in ArcGIS and integrates variation in elevation, slope, and aspect, all variables that are expected to affect vegetation. Elevation was extracted from a 5-m digital terrain model (U.S. Geological Survey Citation2012). The NDVI values were those predicted for the survey year by pixel-level linear regressions of the NDVI timeseries.
We specified the normal random variables to accommodate repeated sampling within years and extra-Poisson variation. They corresponded to the 600-m grid cell or the 300 × 300 m subsection (as indexed by k) in which each pixel was located (see ). We used the coarser resolution grid (600 m) for sparsely distributed species where there was limited information about the distribution of these random variables (i.e.,
) at the finer scale (300 m). For the arctic-east site at which there was two years of data, we fit the same intercept and spatial effects but we specified a different
for each grid cell–year combination, thereby accommodating interannual and spatial stochasticity.
For some study area–species combinations, we lacked sufficient detections for fitting a model with all five covariates. In such cases, we either dropped the solar radiation effect or fit an intercept-only model depending on sample sizes (see Supporting Information, Tables S6–S9). We did not estimate density for sites at which the species was not detected.
We described the observed encounter locations as arising from a spatial point process thinned through incomplete detection. The thinned point intensity was the product of the expected point intensity and the detection function
where d is the minimum distance between the route and each pixel and is the scale parameter of a half-normal detection function (Mizel, Schmidt, and Lindberg Citation2018). We expected that the relatively dense vegetation at the arctic-west site would result in lower detectability for shrub-adapted bird species. Among this group of species and where sufficient data existed, we estimated a separate
for the arctic-west site while pooling the other three sites in estimating
.
The observed pixel-level counts followed a multinomial distribution with cell probabilities . The mean plot-level count was found by integrating the intensity function over the plot region using summation,
(Kéry and Royle Citation2016). We accommodated variation around the expected plot-level count in the model for the expected survey-level count
:
where is a vector of
coefficients and
is the corresponding
matrix of survey-level covariates. These covariates included the linear and quadratic effects of Julian date and the effect of temperature, assuming the presence of seasonal and diurnal variation in singing intensity (i.e., availability for detection; Mizel, Schmidt, and McIntyre Citation2021). The mean temperature for each plot visit was extracted from the weather station closest to each study site.
The observed survey-level counts were Poisson random variables, , and the observed pixel-level counts were multinomial random variables conditional on the
,
.
Hindcasting passerine density
For each study site, we compared mean predicted density (males km−2) between 1999 and the survey year (2016–2019). To predict density in both years, we retained the full point intensity function (EquationEquation (1)(1)
(1) ) including all covariates and random effects. The only difference between the two predictions was that the one corresponding to 1999 was given the predicted NDVI values for 1999 in place of those predicted for the survey year with one exception. To minimize the potential for including any spurious changes in our hindcasts, we fixed NDVI at the survey year value for each pixel where we did not detect a significant trend from the linear regressions. We set the significance level at .10 for this filtering process.
Under this hindcasting framework, the effects of elevation and average solar radiation are assumed to be fixed over time. In predicting from EquationEquation (1)(1)
(1) alone, the estimates for both years (1999 and the survey year) reflect the survey-level covariates (survey temperature and date) held at their mean values. Because the baseline models for our hindcasts are estimated from one to two breeding seasons, their intercepts (i.e., the mean number of individuals per pixel) incorporate many factors affecting density, emphasizing our focus on relative changes in density due to NVDI alone.
Implementation
We fit all models in a Bayesian framework using Just Another Gibbs Sampler v4.3.0 (Plummer Citation2003) via the runjags package (Denwood and Plummer Citation2016) in R v3.4 (R Core Team Citation2018). We specified vague normal priors for all regression coefficients and half-Cauchy priors for the hierarchal standard deviation parameters (Gelman Citation2006). We estimated the posterior distribution from four Markov chain Monte Carlo chains run for 20,000 to 60,000 iterations. We assessed convergence visually and using the Gelman-Rubin diagnostic (Brooks and Gelman Citation1998). We scaled continuous covariates (mean = 0, SD = 1) to improve convergence properties. Inferences about changes in passerine density were based on whether 95 percent highest posterior density credible intervals overlapped 0.
Results
NDVI response
Across the four sites, changes in NDVI occurred over different parts of its range and in different directions, implying a varied set of vegetative transitions and marked spatial heterogeneity in the extent of shrub expansion. The subarctic and arctic-west sites exhibited increases in the proportions of their area with high NDVI (0.7–0.9), coupled with decreases in their proportions in the intermediate range (0.5–0.7; ),implying increasing tall shrub cover. These transitions to higher NDVI classes were concentrated on mountain slopes, but increasing NDVI was also observed on dry sites such as stream gravel bars and convex bedrock hills that had low initial NDVI (0.1–0.5; ).
Figure 3. Change in annual maximum NDVI between 1999 and the survey year in the (a) arctic-west, (b) arctic-central, (c), arctic-east, and (d) subarctic study areas.
The arctic-east site showed increases in the proportion of its area with intermediate/high NDVI (0.6–0.8), coupled with roughly equivalent decreases in the proportion of its area in the range of 0.3 to 0.6, implying increases in low shrub and herbaceous cover and modest tall shrub expansion (). Increases in high NDVI were largely restricted to riparian zones including gravel bars and water tracks.
In contrast, the arctic-central site showed decreases in the area of low (0.2–0.5) and intermediate/high NDVI (0.7–0.8) in concert with increases in intermediate NDVI (0.6–0.7), implying a net reduction in the areas of both unvegetated and shrub cover types accompanied by an increase in herbaceous cover (). Pixels that showed negative trends from initially high NDVI were concentrated in wet footslope areas where inspection of high-resolution aerial photographs reveals a loss of shrub cover, perhaps due to increasing wetness (Supporting Information, Figure S2). These losses in the intermediate/high NDVI range that occurred on wet sites were partially offset by gains on gravel bars and hillslopes. Increases in intermediate NDVI were observed at a wide range of mostly well-drained sites.
Spatial variation in passerine density
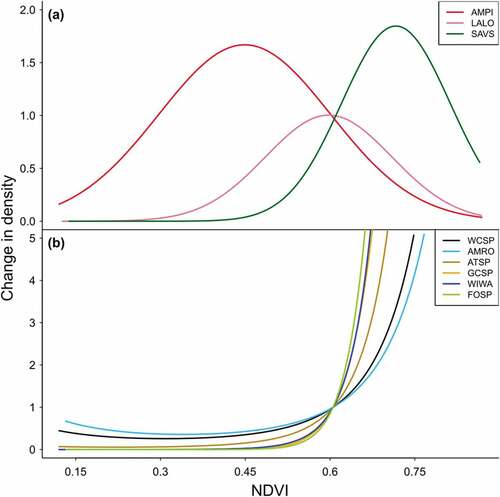
Covariates of distribution (i.e., NDVI, elevation, and solar radiation) and availability (i.e., date and temperature) were well supported across species and sites (Supporting Information, Tables S6–S10). Species were separated into broad habitat associations as inferred by NDVI (). American pipit occupied alpine tundra habitats (low NDVI), Lapland longspur used graminoid-dominated tussock tundra (intermediate NDVI), and savannah sparrow (Passerculus sandwichensis) used environments characterized by low shrubs interspersed with herbs (intermediate/high NDVI). The remaining seven species used high NDVI environments and, to a lesser extent, low and/or intermediate NDVI environments, reflecting an association with open shrublands (). The shapes of these curves varied, indicating differences in thresholds for minimum shrub cover. The two most gradually sloping curves, belonging to white-crowned sparrow and American robin (Turdus migratorius), showed nonnegligible density in low NDVI environments and, therefore, some association with sparsely vegetated cover types. The curve for American tree sparrow (Spizella arborea) had an intermediate slope. The steepest curves, corresponding to golden-crowned sparrow (Zonotrichia atricapilla), Wilson’s warbler (Cardellina pusilla), and fox sparrow (Passerella iliaca), suggest specialized use of more extensive tall shrub thickets typically found in riparian zones ().
Figure 4. Density–NDVI relationships at the arctic-central site for (a) tundra and low shrub–adapted passerines and (b) tall shrub–adapted passerines. Curves represent the expected change in density per unit change of maximum NDVI, while holding the intercept and all other covariates at 0; that is, they are predictions of the exponentiated coefficients for linear and quadratic NDVI. The intercept has been removed to allow plotting the effects from all species on the same scale. Though the arctic-central site was used for display purposes, the shape of these relationships was similar across sites. Species codes in (a): American pipit (AMPI), Lapland longspur (LALO), and Savannah sparrow (SAVS). Species codes in (b): white-crowned sparrow (WCSP), American robin (AMRO), American tree sparrow (ATSP), golden-crowned sparrow (GCSP), Wilson’s warbler (WIWA), and fox sparrow (FOSP).
Passerine hindcasts
Densities of tundra-adapted species (American pipit and Lapland longspur) were predicted to be stable from 1999 to present with the exception of a small predicted increase in Lapland longspur density at the arctic-central site (). Nearly all tall shrub–adapted species were predicted to have increased density at subarctic and arctic-west sites, and the size of these predicted changes tended to increase according to the strength of their association with dense tall shrubs or high NDVI (); Supporting Information, Figures S3–S9). At the arctic-east site, predicted increases in the density of tall shrub–adapted species were less pronounced due to less change in high NDVI () and/or imprecise estimation of change resulting from the low densities of these species at this site (; Supporting Information, Figures S10–S13). Nevertheless, three of five tall shrub–adapted species were predicted to have increased density at the arctic-east site ().
Figure 5. Relative change in density from 1999 to the survey year for passerine species at four sites in Alaska including (a) arctic-west (1999–2017), (b) arctic-central (1999–2016), (c) arctic-east (1999–2018), and (d) subarctic (1999–2019). Species are numbered according to the strength of their association with increasing NDVI; that is, they are ordered according to the average NDVI value (across sites) at which 50 percent of their total expected abundance was reached. Species included (1) American pipit, (2) Lapland longspur, (3) Savannah sparrow, (4) white-crowned sparrow, (5) American robin, (6), American tree sparrow, (7) golden-crowned sparrow, (8) orange-crowned warbler, (9) Wilson’s warbler, and (10) fox sparrow. Missing estimates for some species–study site combinations indicate that the species was absent from the site or had an intercept-only model. Posterior means and 95 percent highest posterior density credible intervals are shown in relation to a horizontal line at 1, which indicates no change.
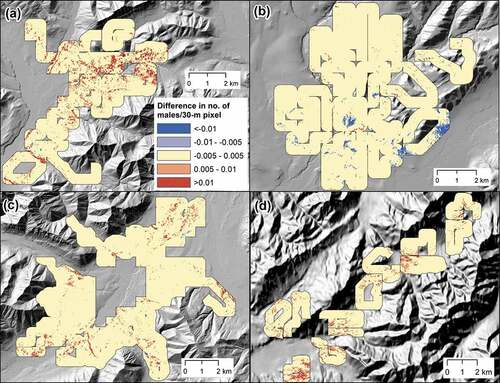
Figure 6. Difference in point intensity (number of males/30-m pixel) for American tree sparrow between 1999 and the survey year within a 300-m sampling strip at four sites in Alaska: (a) arctic-west (1999–2017), (b) arctic-central (1999–2016), (c) arctic-east (1999–2018), and (d) subarctic (1999–2019).
The arctic-central site differed from the overall pattern in that all tall shrub–adapted species were predicted to have either stable or decreasing density, whereas the tundra- and low shrub–adapted species were predicted to have stable or increasing density (; Supporting Information, Figures S10–S16). This individualistic pattern likely reflected the thinning or loss of tall shrub thickets rather than their expansion.
Savannah sparrow, our lone species associated with low stature shrubs, was predicted to have stable mean density at two sites () that masked fine-scale spatial variation in the trajectory of NDVI (). Specifically, its association with intermediate/high NDVI () coincided with the range in which considerable change occurred. At the arctic-west site, these changes appear to have corresponded to a general pattern of greening that resulted in offsetting areas transitioning in and out of this species’ optimal NDVI range (). At the arctic-central site, increasing NDVI on mostly well-drained sites and decreasing NDVI on poorly drained sites also resulted in predictions of offsetting areas of increasing and decreasing density ().
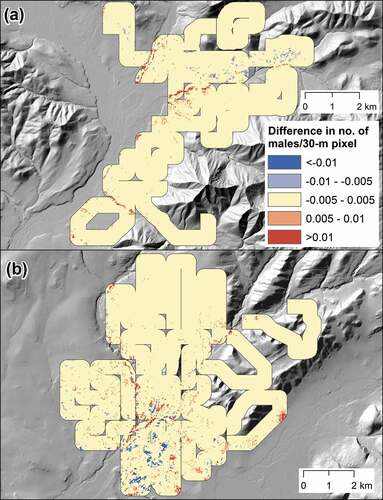
Figure 7. Difference in point intensity (number of males/30-m pixel) for Savannah sparrow between 1999 and the survey year within a 300-m sampling strip at two sites in Arctic Alaska: (a) arctic-west (1999–2017) and (b) arctic-central (1999–2016).
Discussion
By virtue of assessing both NDVI change and variation in passerine density at fine spatial scales, we permitted noncomplementary predictions of habitat change among shrub- and tundra-adapted passerines. Tall shrub–adapted species were predicted to have increased habitat area at arctic-west and subarctic sites, comparatively modest increases at the arctic-east site, and decreasing or stable habitat area at the arctic-central site. Conversely, the habitat area corresponding to tundra-adapted species was predicted to have changed little over the last twenty years. Our hindcasts contrast with predictions made by Boelman et al. (Citation2015), who expected equivalent areal decreases and increases in the habitat of the tundra-adapted Lapland longspur and the tall shrub–adapted white-crowned sparrow, respectively. The disagreement in these predictions appears to be due in some part to the finer spatial scale of our inference, which allowed for portions of the landscape to resist shrub colonization presumably as a function of soil limitations (Tape et al. Citation2012; Swanson Citation2015). The tussock tundra habitat used by Lapland longspur has soil characteristics (e.g., relatively high moisture and acidity) that make them unfavorable for the formation of tall shrub canopies even under warmer conditions (Tape et al. Citation2012; Swanson Citation2015).
Our predictions are consistent with a growing body of evidence of individualistic responses to climate change. Although studies of range dynamics predominantly report a pattern of poleward or upslope movement in response to climate warming (Parmesan Citation2006; Hitch and Leberg Citation2007; Maggini et al. Citation2011), heterogeneity in the response across species and populations is also apparent, with numerous examples of unexpected responses including range stability, isotropic change (e.g., due to habitat fragmentation), and shifts that are opposite of the predicted direction (e.g., Lenoir et al. Citation2010; Tingley et al. Citation2012; Mizel et al. Citation2016). In addition to predicting relatively stable habitat area for the two tundra-adapted species that we considered, our lone species associated with low shrubs, savannah sparrow, showed limited evidence of areal changes in habitat at two of our sites. However, this was an outcome of offsetting areas transitioning in and out of this species’ optimal NDVI range over the study period. Thus, savannah sparrow is indicative of how coarse models of distribution may mask change at fine spatial scales, particularly in species with unimodal or humped responses to environmental variables.
In assuming that density in the past is a deterministic function of changes in NDVI alone, our approach was analogous to predicting areal changes in potential habitat. However, there are limitations to our inferences about habitat change due to the simplicity of our approach, including the fact that it assumes that the NDVI–density relationship is fixed over time. It also ignores potential changes on scales larger than a 30-m pixel that may have impacts on habitat suitability (Henden et al. Citation2013; Boelman et al. Citation2016). Specifically, shrub-adapted species showed use of open shrublands (i.e., intermediate/high NDVI), and continued infilling could result in suboptimal levels of canopy closure at patch scales or larger (Mizel et al. Citation2016), leading to local population declines in the reverse of our hindcasts. Along these lines, Mizel et al. (Citation2016, Citation2021) documented upward shifts in the elevational distributions of nearly all common shrub-adapted species from 1995 to 2019 at the subarctic site using a timeseries of roadside counts, suggesting potential tracking of open shrub canopies over time. In addition, Thompson et al. (Citation2016) found that some tall shrub–adapted species in western Alaska declined in abundance above a threshold level of average shrub height and/or shrub cover within 250-m radius plots. For some shrub-adapted species, openings in the shrub canopy provide herbaceous cover that aids in nest concealment and provides protection against severe weather (Boelman et al. Citation2015). Some shrub tundra species also have foraging tactics adapted for open shrub canopies (Batova Citation2011), and others show associations with structurally diverse shrub communities (Boelman et al. Citation2016).
Although tall shrub expansion was apparent to varying extents at all the study areas, other vegetative transitions were also implied by the observed changes in NDVI. The arctic-central site appears to be relatively resistant to shrub expansion and instead showed decreases in the cover of high NDVI that potentially corresponded to the thinning of shrubs in areas of wet tundra. Simultaneously, increases in intermediate NDVI occurred on sparsely vegetated dry sites, suggesting increasing cover of a mixture of tundra life forms (i.e., graminoids, forbs, dwarf shrubs, and erect shrubs). This is consistent with the observed pattern of increasing graminoid and dwarf shrub cover in the Arctic (Jia, Epstein, and Walker Citation2006; Joly, Cole, and Jandt Citation2007; Munger et al. Citation2008; Tape et al. Citation2012; Fraser et al. Citation2014). Therefore, the low susceptibility of tussock tundra habitats to shrub encroachment coupled with potential increases in low vegetation on barrens suggests that areal changes in the potential habitat of tundra-adapted passerines within our study area are unlikely to simply be the reverse of those corresponding to shrub-adapted species. Our study also emphasizes uncertainty about the future population trajectories and distribution of shrub-adapted species. The association of some of these species with open shrublands suggests vulnerability to continued infilling of shrub canopies and, potentially, the transitory nature of their density trajectories at some sites. In addition, our study stresses the importance of framing inference in terms of the individual encounter in space rather than aggregating counts at the plot level. This approach more fully leverages the spatial information underlying the individual encounters in explaining distribution (Mizel, Schmidt, and Lindberg Citation2018) but is also critical for accommodating spatial heterogeneity in the response of vegetation in predictive models.
Author contributions
JDM conceived and designed the experiments. JDM and DKS analyzed the data and wrote the article.
Supplemental Material
Download Zip (2.9 MB)Acknowledgments
We thank the Nunamiut and Arctic Slope Regional Corporations for access to their lands. We thank the technicians who conducted surveys over the course of this project, particularly Jared Hughey, Sarah Swanson, and Shelli Swanson. We thank Carol McIntyre for help with logistics, Ken Hill and Pamela Sousanes for help acquiring weather data, and Josh Schmidt, Eric Wald, and two anonymous reviewers for comments on drafts of this article.
Disclosure statement
No potential conflict of interest was reported by the authors.
Supplementary material
Supplemental material for this article can be accessed on the publisher’s website.
Additional information
Funding
References
- Bartsch, A., B. Widhalm, M. Leibman, K. Ermokhina, T. Kumpula, A. Skarin, E. J. Wilcox, B. M. Jones, G. V. Frost, A. Höfler, et al. 2020. Feasibility of tundra vegetation height retrieval from Sentinel-1 and Sentinel-2 data. Remote Sensing of Environment 237:111515. doi:10.1016/j.rse.2019.111515.
- Batova, O. N. 2011. Selection of foraging tactics in leaf warblers (Phylloscopus). Biological Bulletin Reviews 38:259–65. doi:10.1134/S1062359011030022.
- Berner, L. T., P. Jantz, K. D. Tape, and S. J. Goetz. 2018. Tundra plant above-ground biomass and shrub dominance mapped across the North Slope of Alaska. Environmental Research Letters 13 (3):035002. doi:10.1088/1748-9326/aaaa9a.
- Blok, D., G. Schaepman-Strub, H. Bartholomeus, M. M. Heijmans, T. C. Maximov, and F. Berendse. 2011. The response of Arctic vegetation to the summer climate: Relation between shrub cover, NDVI, surface albedo and temperature. Environmental Research Letters 6:035502.
- Boelman, N. T., L. Gough, J. C. Wingfield, S. Goetz, A. Asmus, H. E. Chmura, J. S. Krause, J. H. Perez, S. K. Sweet, K. C. Guay, et al. 2015. Greater shrub dominance alters breeding habitat and food resources for migratory songbirds in Alaskan Arctic tundra. Global Change Biology. 21:1508–20. doi:10.1111/gcb.12761.
- Boelman, N. T., J. D. Holbrook, H. E. Greaves, J. S. Krause, H. E. Chmura, T. S. Magney, J. H. Perez, J. U. H. Eitel, L. Gough, K. T. Vierling, et al. 2016. Airborne laser scanning and spectral remote sensing give a bird’s eye perspective on Arctic tundra breeding habitat at multiple spatial scales. Remote Sensing of Environment 184:337–49. doi:10.1016/j.rse.2016.07.012.
- Boggs, K., A. Garibaldi, J. L. Stevens, and J. Grunblatt. 2001. Denali National Park and preserve landcover mapping project volume 2: Landcover classes and plant associations. Natural Resource Technical Report NPS/DENA/NRTR—2001/002. https://irma.nps.gov/DataStore/Reference/Profile/606696.
- Brodie, J. F., C. A. Roland, S. E. Stehn, and E. Smirnova. 2019. Variability in the expansion of trees and shrubs in boreal Alaska. Ecology 100:02660. doi:10.1002/ecy.2660.
- Brooks, S. P., and A. Gelman. 1998. General methods for monitoring convergence of iterative simulations. Journal of Computational and Graphical Statistics 7:434–55.
- Buckland, S. T., D. R. Anderson, K. P. Burnham, J. L. Laake, D. L. Borchers, and L. Thomas. 2001. Introduction to distance sampling. Oxford: Oxford University Press.
- Bunn, A. G., and S. J. Goetz. 2006. Trends in satellite-observed circumpolar photosynthetic activity from 1982 to 2003: The influence of seasonality, cover type, and vegetation density. Earth Interactions 10:1–19. doi:10.1175/EI190.1.
- Christie, K. S., J. P. Bryant, L. Gough, V. T. Ravolainen, R. W. Ruess, and K. D. Tape. 2015. The role of vertebrate herbivores in regulating shrub expansion in the Arctic: A synthesis. BioScience 65:1123–33.
- Clegg, B. F., and F. S. Hu. 2010. An oxygen–isotope record of Holocene climate change in south–central Brooks Range, Alaska. Quaternary Science Reviews 29:928–39. doi:10.1016/j.quascirev.2009.12.009.
- Denwood, M., and M. Plummer. 2016. Package ‘ runjags’. http://runjags.sourceforge.net.
- Fraser, R. H., T. C. Lantz, I. Olthof, S. V. Kokelj, and R. A. Sims. 2014. Warming–induced shrub expansion and lichen decline in the Western Canadian Arctic. Ecosystems 17:1151–68. doi:10.1007/s10021-014-9783-3.
- Frost, G. V., and H. E. Epstein. 2014. Tall shrub and tree expansion in Siberian tundra ecotones since the 1960s. Global Change Biology 20:1264–77. doi:10.1111/gcb.12406.
- Gelman, A. 2006. Prior distributions for variance parameters in hierarchical models (comment on article by Browne and Draper). Bayesian Analysis 1:515–34. doi:10.1214/06-BA117A.
- Goetz, S. J., A. G. Bunn, G. J. Fiske, and R. A. Houghton. 2005. Satellite-observed photosynthetic trends across boreal North America associated with climate and fire disturbance. Proceedings of the National Academy of Science USA 102:13521–25. doi:10.1073/pnas.0506179102.
- Hedley, S. L., and S. T. Buckland. 2004. Spatial models for line transect sampling. Journal of Agricultural, Biological and Environmental Statistics 9:181–91. doi:10.1198/1085711043578.
- Henden, J. A., N. G. Yoccoz, R. A. Ims, and K. Langeland. 2013. How spatial variation in areal extent and configuration of labile vegetation states affect the riparian bird community in Arctic tundra. PLoS One 8:e63312.
- Higuera, P. E., L. B. Brubaker, P. M. Anderson, F. S. Hu, and T. A. Brown. 2009. Vegetation mediated the impacts of postglacial climate change on fire regimes in the south‐central Brooks Range, Alaska. Ecological Monographs 79:201–19. doi:10.1890/07-2019.1.
- Hijmans, R. J., J. van Etten, J. Cheng, M Mattiuzzi, M. Sumner, J. A. Greenberg, O. P. Lamigueiro, A. Bevan, E. B. Racine, and A. Shortridge. 2015. Raster package in R.
- Hitch, A. T., and P. L. Leberg. 2007. Breeding distributions of North American bird species moving north as a result of climate change. Conservation Biology 21:534–39. doi:10.1111/j.1523-1739.2006.00609.x.
- Jia, G. J., H. E. Epstein, and D. A. Walker. 2003. Greening of Arctic Alaska, 1981–2001. Geophysical Research Letters 30:2067. doi:10.1029/2003GL018268.
- Jia, G. J., H. E. Epstein, and D. A. Walker. 2006. Spatial heterogeneity of tundra vegetation response to recent temperature changes. Global Change Biology 12:42–55. doi:10.1111/j.1365-2486.2005.01079.x.
- Jia, G. J., H. E. Epstein, and D. A. Walker. 2009. Vegetation greening in the Canadian Arctic related to decadal warming. Journal of Environmental Monitoring 11:2231–38. doi:10.1039/b911677j.
- Joly, K., M. J. Cole, and R. R. Jandt. 2007. Diets of overwintering caribou, Rangifer tarandus, track decadal changes in Arctic tundra vegetation. Canadian Field-Naturalist 121:379–83. doi:10.22621/cfn.v121i4.509.
- Jorgenson, M. T., M. S. Duffy, G. V. Frost, P. F. Miller, M. J. Macander, A. F. Wells, and E. R. Pullman. 2009. An ecological land survey and landcover map of the Arctic Network. NPS/ARCN/NRTR–2009/270, US Department of the Interior, National Park Service, Fort Collins, CO.
- Kéry, M., and J. A. Royle. 2016. Applied hierarchical modeling in ecology: Analysis of distribution, abundance and species richness in R and BUGS. Volume 1: prelude and static models. London, UK: Academic Press.
- Lenoir, J., J. C. Gégout, A. Guisan, Vittoz, P., T. Wohlgemuth, N. E. Zimmermann, S. Dullinger, H. Pauli, W. Willner, and Svenning, J.C. 2010. Going against the flow: Potential mechanisms for unexpected downslope range shifts in a warming climate. Ecography 33:295–303.
- Link, W. A., and J. R. Sauer. 1997. Estimation of population trajectories from count data. Biometrics 53:488–97. doi:10.2307/2533952.
- Maggini, R., A. Lehmann, M. Kéry, H. Schmid, M. Beniston, L. Jenni, and N. Zbinden. 2011. Are Swiss birds tracking climate change?: Detecting elevational shifts using response curve shapes. Ecological Modelling 222:21–32. doi:10.1016/j.ecolmodel.2010.09.010.
- Mizel, J. D., J. H. Schmidt, and M. S. Lindberg. 2018. Accommodating temporary emigration in spatial distance sampling models. Journal of Applied Ecology 55:1456–64. doi:10.1111/1365-2664.13053.
- Mizel, J. D., J. H. Schmidt, and C. L. McIntyre. 2021. Climate and weather have differential effects in a high latitude passerine community. Oecologia 195:355–65. doi:10.1007/s00442-020-04847-x.
- Mizel, J. D., J. H. Schmidt, C. L. McIntyre, and C. A. Roland. 2016. Rapidly shifting elevational distributions of passerine species parallel vegetation change in the subarctic. Ecosphere 7:e01264. doi:10.1002/ecs2.1264.
- Munger, C. A., D. A. Walker, H. A. Maier, T. D. Hamilton. 2008. Spatial analysis of glacial geology, surficial geomorphology, and vegetation in the Toolik Lake region: Relevance to past and future land–cover changes. In Proceedings of the Ninth International Conference on Permafrost Conference, eds. D. I. Kand, and K. M. Hinkel, 1255–60. University of Alaska Fairbanks, Fairbanks.
- Myers-Smith, I. H., B. C. Forbes, M. Wilmking, M. Hallinger, T. Lantz, D. Blok, K. D. Tape, M. Macias-Fauria, U. Sass-Klaassen, Lévesque, E., and S. Boudreau. 2011. Shrub expansion in tundra ecosystems: Dynamics, impacts and research priorities. Environmental Research Letters 6:045509.
- Oedekoven, C. S., S. T. Buckland, M. L. Mackenzie, K. O. Evans, and L. W. Burger Jr. 2013. Improving distance sampling: Accounting for covariates and non‐independency between sampled sites. Journal of Applied Ecology 50:786–93. doi:10.1111/1365-2664.12065.
- Olofsson, J., L. Oksanen, T. Callaghan, P. E. Hulme, T. Oksanen, and O. Suominen. 2009. Herbivores inhibit climate‐driven shrub expansion on the tundra. Global Change Biology 15:2681–93. doi:10.1111/j.1365-2486.2009.01935.x.
- Parmesan, C. 2006. Ecological and evolutionary responses to recent climate change. Annual Review of Ecology, Evolution, and Systematics 37:637–69. doi:10.1146/annurev.ecolsys.37.091305.110100.
- Pattison, R. R., J. C. Jorgenson, M. K. Raynolds, and J. M. Welker. 2015. Trends in NDVI and tundra community composition in the Arctic of NE Alaska between 1984 and 2009. Ecosystems 18:707–19. doi:10.1007/s10021-015-9858-9.
- Plummer, M. 2003. JAGS: A program for analysis of Bayesian graphical models using Gibbs sampling. http://www.r–project.org/conferences/DSC–2003/Drafts/Plummer.pdf.
- Post, E., M. C. Forchhammer, M. S. Bret–Harte, T. V. Callaghan, T. R. Christensen, B. Elberling, A. D. Fox, O. Gilg, D. S. Hik, T. T. Høye, et al. 2009. Ecological dynamics across the Arctic associated with recent climate change. Science 325:1355–58. doi:10.1126/science.1173113.
- Pouliot, D., R. Latifovic, and I. Olthof. 2009. Trends in vegetation NDVI from 1 km AVHRR data over Canada for the period 1985–2006. International Journal of Remote Sensing 30:149–68.
- PRISM Climate Group. 2020. PRISM climate data. Accessed August 4, 2020. http://prism.oregonstate.edu.
- R Core Team. 2018. R: A language and environment for statistical computing. Vienna, Austria: R Foundation for Statistical Computing.
- Riedel, S. M., H. E. Epstein, and D. A. Walker. 2005. Biotic controls over spectral reflectance of Arctic tundra vegetation. International Journal of Remote Sensing 26:2391–405. doi:10.1080/01431160512331337754.
- Roy, D. P., V. Kovalskyy, H. K. Zhang, E. F. Vermote, L. Yan, S. S. Kumar, and A. Egorov. 2016. Characterization of Landsat–7 to Landsat–8 reflective wavelength and normalized difference vegetation index continuity. Remote Sensing of Environment 185:57–70. doi:10.1016/j.rse.2015.12.024.
- Sauer, B., and J. Dwyer. 2018. U.S. Landsat Analysis Ready Data (ARD) Data Format Control Book (DFCB) (LSDA–1873 version 4.0). US Geological Survey Earth Resources Observation and Science (EROS) Center. https://www.usgs.gov/media/files/landsat–analysis–ready–data–ard–data–format–control–book–dfcb.
- Sturm, M., C. Racine, and K. Tape. 2001. Increasing shrub abundance in the Arctic. Nature 411:546–47. doi:10.1038/35079180.
- Sturm, M., J. Schimel, G. Michaelson, J. M. Welker, S. F. Oberbauer, G. E. Liston, J. Fahnestock, and V. E. Romanovsky. 2005. Winter biological processes could help convert Arctic tundra to shrubland. Bioscience. 55:17–26. doi:10.1641/0006-3568(2005)055[0017:WBPCHC]2.0.CO;2.
- Swanson, D. K. 2013. Three decades of landscape change in Alaska’s Arctic national parks: Analysis of aerial photographs, c. 1980–2010. Natural Resource Technical Report NPS/ARCN/NRTR—2013/668, National Park Service, Fort Collins, CO. https://irma.nps.gov/App/Reference/Profile/2192701.
- Swanson, D. K. 2015. Environmental limits of tall shrubs in Alaska’s Arctic national parks. PLoS One 10:e0138387.
- Swanson, D. K., and P. N. Neitlich. 2016. Terrestrial vegetation monitoring protocol for the Arctic Alaska network: Establishment, sampling, and analysis of permanent monitoring plots. Natural Resource Report NPS/ARCN/NRR—2016/1214, National Park Service. https://irma.nps.gov/DataStore/Reference/Profile/2229705.
- Sweet, S. K., A. Asmus, M. E. Rich, J. Wingfield, L. Gough, and N. T. Boelman. 2015. NDVI as a predictor of canopy arthropod biomass in the Alaskan Arctic tundra. Ecological Applications 25 (3):779–90. doi:10.1890/14-0632.1.
- Tape, K. D., K. Christie, G. Carroll, and J. A. O’Donnell. 2016a. Novel wildlife in the Arctic: The influence of changing riparian ecosystems and shrub habitat expansion on snowshoe hares. Global Change Biology 22:208–19.
- Tape, K. D., D. D. Gustine, R. W. Ruess, L. G. Adams, and J. A. Clark. 2016b. Range expansion of moose in Arctic Alaska linked to warming and increased shrub habitat. PLoS One 11:e0152636. doi:10.1371/journal.pone.0152636.
- Tape, K. D., M. Hallinger, J. M. Welker, and R. W. Ruess. 2012. Landscape heterogeneity of shrub expansion in Arctic Alaska. Ecosystems 15:711–24. doi:10.1007/s10021-012-9540-4.
- Tape, K. D., M. Sturm, and C. Racine. 2006. The evidence for shrub expansion in Northern Alaska and the Pan‐Arctic. Global Change Biology 12:686–702. doi:10.1111/j.1365-2486.2006.01128.x.
- Thompson, S. J., C. M. Handel, R. M. Richardson, and L. B. McNew. 2016. When winners become losers: Predicted nonlinear responses of Arctic birds to increasing woody vegetation. PLoS One 11: e0164755. doi:10.1371/journal.pone.0164755
- Tingley, M. W., M. S. Koo, C. Moritz, A. C. Rush, and S. R. Beissinger. 2012. The push and pull of climate change causes heterogeneous shifts in avian elevational ranges. Global Change Biology 18:3279–90. doi:10.1111/j.1365-2486.2012.02784.x.
- Tucker, C. J., and P. J. Sellers. 1986. Satellite remote sensing of primary production. International Journal of Remote Sensing 7:1395–416. doi:10.1080/01431168608948944.
- U.S. Geological Survey. 2012. USGS EROS archive—Digital elevation—Interferometric Synthetic Aperture Radar (IFSAR)—Alaska. https://www.usgs.gov/centers/eros/science/usgs–eros–archive–digital–elevation–interferometric–synthetic–aperture–radar?qt–science_center_objects=0#qt–science_center_objects.
- Verbyla, D. 2008. The greening and browning of Alaska based on 1982–2003 satellite data. Global Ecology and Biogeography 17:547–55.
- Viereck, L. A., C. T. Dyrness, C. T. Batten, and K. J. Wenzlick. 1992. The Alaska vegetation classification. PNW-GTR-286. U. S. Department of Agriculture, Forest Service, Portland, OR.
- Walker, D. A., M. K. Raynolds, F. J. A. Daniëls, E. Einarsson, A. Elvebakk, W. A. Gould, A. E. Katenin, S. S. Kholod, C. J. Markon, E. S. Melnikov, et al. 2005. The circumpolar Arctic vegetation map. Journal of Vegetation Science. 16 (3):267–82. doi:10.1111/j.1654-1103.2005.tb02365.x.
- Wheeler, H. C., T. T. Høye, and J. C. Svenning. 2018. Wildlife species benefitting from a greener Arctic are most sensitive to shrub cover at leading range edges. Global Change Biology 24:212–23. doi:10.1111/gcb.13837.