
 ?Mathematical formulae have been encoded as MathML and are displayed in this HTML version using MathJax in order to improve their display. Uncheck the box to turn MathJax off. This feature requires Javascript. Click on a formula to zoom.
ABSTRACT
Atmospheric ducts could disturb radar detection and radio communication in the Arctic and risk increasing human activities under Arctic warming. It is an urgent need to understand atmospheric ducts in the Arctic, with distinct atmospheric systems and environment. This study attempts to analyze the surface atmospheric ducts over Svalbard, as a critical region in the Arctic Ocean, and discuss the relation to atmospheric and oceanic conditions, based on observation and reanalysis data. The results show an occurrence of 12.6 percent, mean strength of 1.30 MU, and mean depth of 13 m for the surface duct in Svalbard winter from December 2018 to February 2020. The surface duct is characterized as two types: T-type ducts mainly constructed by temperature inversion and H-type ducts constructed by a humidity gradient. The T-type duct dominates the surface duct in Svalbard winter, with an appearance percentage of 80 percent, indicating an importance of temperature inversion in surface duct construction. The surface duct is closely related to atmospheric and oceanic conditions in Svalbard winter, because the T-type duct occurs in colder, drier, and northeasterly weather and the H-type duct occurs in warmer, wetter, and southeasterly weather with higher sea surface temperature.
Introduction
Atmospheric ducts are refractive layers in the atmosphere, trapping and guiding radio wave propagation along the curvature of Earth. Atmospheric ducts can greatly disturb radar detection with mispositioning and blind spots and also affect radio communication, resulting in low accuracy and efficiency (Mosczkowicz, Ciach, and Krajewski Citation1994; Borsum Citation1995; Mesnard and Sauvageot Citation2010). Surface ducts, an important category of atmospheric ducts, occurring in an atmospheric layer of 101 to 102 m thick on the ground can have great impacts on ground-based radar detection and radio communication (Mosczkowicz, Ciach, and Krajewski Citation1994; Borsum Citation1995; Brooks, Goroch, and Rogers Citation1999; Atkinson and Zhu Citation2006; Mesnard and Sauvageot Citation2010). Surface ducts in various regions worldwide have been detected and studied (Babin and Rowland Citation1992; Babin Citation1996; Brooks, Goroch, and Rogers Citation1999; Mentes and Kaymaz Citation2007; Mesnard and Sauvageot Citation2010; Viher, Prtenjak, and Grisogono Citation2013; Cheng et al. Citation2015; Kaissassou et al. Citation2015; Mai, Sheng, and Shi Citation2020). For example, Brooks, Goroch, and Rogers (Citation1999) captured a thick and strong surface duct over the Persian Gulf in April 1996, with a depth up to 420 m and strength over 70 MU. Cheng et al. (Citation2015) studied the surface duct over the South China Sea with more than ten years of radiosondes data onboard and found annual and winter mean occurrences up to 64 percent and 50 percent, respectively.
The Arctic is experiencing fast warming, with a warming rate more than twice the global mean, and this warming will continue in the twenty-first century (Symon, Arris, and Heal Citation2004; Berkryaev, Polyakov, and Alexeev Citation2010; Cohen et al. Citation2013, Citation2014; Intergovernmental Panel on Climate Change Citation2013; Shepherd Citation2016; Davy and Outten Citation2020; Cai, You, and Wu Citation2021). As a consequence of Arctic warming, sea ice is melting rapidly in the Arctic Ocean, especially in coastal areas (Cosmiso, Parkinson, and Gersten Citation2008; Screen and Simmonds Citation2010; Gao et al. Citation2015; Arthun et al. Citation2021; Cai, Wang, and Beletsky Citation2021), resulting in more efficient and navigable Arctic shipping routes (Barnhart, Miller, and Overeem Citation2015; Chen et al. Citation2019; Yu et al. Citation2020; Cao et al. Citation2021). For instance, Yu et al. (Citation2020) analyzed the sea ice conditions along the Northeast Passage by remote sensing data and found increased navigable days, especially in the Kara Strait, where the navigable days increased from less than 50 days/year before 1990 to more than 100 days/year after 2010. Barnhart, Miller, and Overeem (Citation2015) estimated the navigable area in the Arctic Ocean for next century based on a numerical model and found a six-month navigability on all coastal waters by 2070. Melia, Haines, and Hawkins (Citation2016) predicted trans-Arctic shipping routes in the twenty-first century based on a climate model and found the possibility of available routes across the central Arctic Ocean by mid-century.
The foreseen increasing navigability in the Arctic Ocean requires more attention to navigation safety, especially sea ice detection and emergence supported by radar navigation and radio communication (Cao et al. Citation2021; Li, Ringsberg, and Rita Citation2021). Surface atmospheric ducts over the Arctic Ocean, as an interference in radar and radio operation in Arctic navigation, is important to understand. Studies have been carried out on atmospheric ducts over the Arctic and provided evidence and general knowledge of atmospheric ducts (Engeln and Teixeira Citation2004; Lopez Citation2009; Hao, Li, and Guo Citation2018; Mai, Sheng, and Shi Citation2020). For example, Engeln and Teixeira (Citation2004) and Lopez (Citation2009) studied the duct distribution worldwide based on data analysis and found a winter occurrence of over 40 percent for all duct categories over Greenland and Siberia. Mai, Sheng, and Shi (Citation2020) investigated atmospheric ducts over the Alaska based on twelve-station radiosonde observations and found a surface duct occurrence of about 10 percent on an annual basis and only 5 percent in winter.
The Svalbard Islands (78°13′ N, 15°39′ E) are an important Arctic archipelago, located in the North Atlantic sector of the Arctic Ocean, nearby the gateway of the Northeast Passage. Svalbard and its neighboring seas are a critical region in Arctic warming, with the highest warming rate and sea surface temperature (SST) in the Arctic and complicated regional atmospheric circulation systems (Screen and Simmonds Citation2010; Serreze, Barrett, and Cassano Citation2011; Dai et al. Citation2019; Tomczyk, Lupikasza, and Kendzierski Citation2019; Yamanouchi Citation2019). The atmospheric and ocean conditions in this region can cause atmospheric ducts different from those in other arctic regions. However, atmospheric ducts, especially surface ducts with more impact on navigation, over this region have not been studied, and their characteristics and possible mechanisms still remain unclear. This study attempts to analyze and discuss the features of the surface atmospheric duct over Svalbard and its neighboring seas and its relation to the atmospheric and ocean conditions based on observation and reanalysis data.
Data and methods
Observational radiosonde, cloud, and radiation data at Ny-Ålesund (78.9° N, 11.9° E), located on the coast of Kings Bay connected to the Greenland Sea, Svalbard, were used in this study. The surrounding sea surface is not enclosed by sea ice, with an average ice density about 0.38 in winter (Reynolds et al. Citation2002; Huang et al. Citation2021). The radiosonde data in winter months (December, January, and February) from December 2017 to February 2020 had 421 observed profiles of atmospheric pressure, temperature, relative humidity, and wind (Maturilli Citation2018a), with a vertical resolution of about 10 m, once a day at 12:00 UTC from December 2017 to February 2020, except in February 2018 and February 2020 when it was four times a day at 00:00, 06:00, 12:00 and 18:00 UTC. The downward/upward longwave radiation measured by a pyranometer at 2 m above the ground and the cloud base height measured by a ceilometer, at the same time as radiosonde observation, was also used in this study (Maturilli Citation2018b, Citation2020). ERA-5 reanalysis products from ECMWF (European Centre for Medium-Range Weather Forecasts), (Hersbach et al. Citation2020), with a horizontal resolution of 0.25°×0.25°, at the same time as radiosonde observation, were applied for atmospheric situation analysis. The average SST around Svalbard (11.25–11.75° E, 78.75–79.0° N) was calculated from the NOAA Optimum Interpolation Sea Surface Temperature V2 (NOAA_OI_SST_V2) with a horizontal resolution of 0.25°×0.25° for ocean condition analysis (Reynolds et al. Citation2002; Huang et al. Citation2021).
Analysis and diagnosis of atmospheric ducts are based on calculation and criteria of atmospheric refractivity distribution from pressure, temperature, and humidity profiles (Babin and Rowland Citation1992; Babin Citation1996; Brooks, Goroch, and Rogers Citation1999; Mentes and Kaymaz Citation2007; Cheng et al. Citation2015). Ducts with bottom touching the ground are identified as surface ducts. The occurrence of surface ducts is defined as the ratio of the number of surface duct observations to the total number of observations.
The modified refractivity M is obtained by
where T, P, e, and z are the temperature, pressure, vapor pressure, and elevation, respectively. The vertical gradient of modified refractivity is obtained based on EquationEquation (1)(1)
(1) as
A layer with dM/dz <0 is considered an atmospheric duct. The strength of an atmospheric duct is defined as the absolute value of the difference between the modified refractivity at top and bottom of the duct layer. The duct strength is in units of 10-6, which is also called M-units (MU; Mentes and Kaymaz Citation2007; Mai et al., Citation2020).
Surface duct over Svalbard
Surface duct in winter
shows the monthly occurrence of surface ducts in Svalbard winter. In winter months of December 2017 to February 2020, surface ducts occurred sixty times, which is 12.6 percent of 421 observations at Svalbard. The monthly occurrence was a maximum of 26.7 percent in January 2019 and a minimum of 6.5 percent in December 2019, with large variability. The average monthly occurrence was 10.8 percent in winter 2017–2018, 14.5 percent in winter 2018–2019, and 12.4 percent in winter 2019–2020, with small variability year to year. Within the Arctic, the average occurrence of surface ducts in Svalbard winter was much higher than that in Alaska winter from 1998 to 2008, mostly below 3 percent (Mai, Sheng, and Shi Citation2020), although the winter occurrence was lower than those at lower latitudes in the same season (Mentes and Kaymaz Citation2007; Lenouo Citation2014; Cheng et al. Citation2015). Therefore, the winter occurrence of surface ducts over Svalbard is relatively high in the Arctic, with large monthly variation.
Figure 1. Distribution of surface duct (a) occurrence, (b) strength, and (c) depth during winter months of December 2017 to February 2020. The cyan, red, and blue bars are statistics for ducts in December, January, and February, respectively.
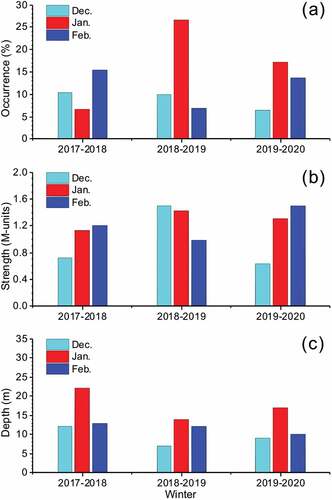
shows the monthly average strength of surface duct in Svalbard winter. The average strength of surface ducts was obtained as 1.26 MU in Svalbard winter from December 2017 to February 2020. The monthly strength had a maximum of 1.49 MU in December 2018 and February 2020 and a minimum of 0.64 MU in December 2019. The average strength of surface ducts was 1.14 MU in winter 2017–2018, 1.35 MU in winter 2018–2019, and 1.33 MU in winter 2019–2020, indicating a small interannual variability in Svalbard winter. The average strength of surface ducts in Svalbard winter was close to that observed in Alaska winter from 1998 to 2008 (Mai, Sheng, and Shi Citation2020) but lower than that at lower latitudes (Mentes and Kaymaz Citation2007; Lenouo Citation2014; Cheng et al. Citation2015). Therefore, the strength of surface ducts in Svalbard winter is similar to that in other arctic regions, with a small interannual variability.
presents the monthly average depth of surface ducts in Svalbard winter. The average depth of surface ducts was 13 m over Svalbard in winter months from December 2017 to February 2020. The monthly average depth was a maximum of 22 m in January 2018 and a minimum of 7 m in December 2018. The average depth was 16 m, 11 m, and 12 m in winter 2017–2018, 2018–2019, and 2019–2020, respectively, with large interannual variability. The depth of surface ducts in Svalbard winter was much smaller than that (about 20 m) observed in Alaska winter from 1998 to 2008 (Mai, Sheng, and Shi Citation2020). Therefore, the depth of surface ducts in Svalbard winter was smaller than that in other arctic regions in the same season.
Based on the above analysis and discussion, the occurrence of surface ducts in Svalbard winter was about 12.6 percent, higher than that in other Arctic regions, with large monthly variability. The strength of surface ducts in Svalbard winter was 1.26 MU, similar to that in Alaska winter, and the depth was 13 m, smaller than that in Alaska winter.
Surface duct characterization
The occurrence and development of surface ducts are determined by atmospheric properties, such as vertical pressure, temperature, and humidity structures (Bean and Dutton Citation1968); therefore, atmospheric ducts, described by refractivity gradients, are determined by gradients of pressure, temperature, and humidity in EquationEquation (2)(2)
(2) . To understand atmospheric impacts on surface ducts, we could separately analyze the three gradient terms in EquationEquation (2)
(2)
(2) and evaluate their contributions to the refractivity gradient. Here, the three gradient terms on the right-hand side of EquationEquation (2)
(2)
(2) are pressure, temperature, and humidity terms, and were calculate their ratios to the refractivity gradient as contributions of pressure, temperature, and humidity structures to duct construction in Svalbard winter from December 2017 to February 2020. The contribution of the pressure term was in the range 5.4 percent to 22.7 percent, with an average of 14.9 percent; the contribution of the temperature term was −19.7 percent to 164.1 percent, with an average of 78.5 percent; and the contribution of the humidity term was −80.4 to 104.1 percent, with an average of 6.6 percent. Because the contribution of the pressure term was much smaller than that of the temperature or humidity terms in all ducts, its contribution was ignored, and only the contributions of temperature and humidity terms on surface ducts were considered (Gossard Citation1977; Zhanyu et al. Citation2000; Mentes and Kaymaz Citation2007; Viher, Prtenjak, and Grisogono Citation2013; Kaissassou et al. Citation2015).
All surface ducts observed in Svalbard winter from December 2017 to February 2020 are plotted in with percentage contributions of temperature and humidity terms. To identify the importance of temperature and humidity structures in constructing surface ducts, we defined two duct types, T and H, as the larger contribution of the temperature term to the refractivity gradient than the humidity term and vice versa, and the division of T-type and H-type is plotted as a dashed line in . This definition determines whether the construction of surface ducts is mainly contributed by a temperature inversion or humidity gradient in lower atmospheric structure. In , forty-eight ducts are identified as T-type, and twelve as H-type, as 80 percent and 20 percent of the total of sixty ducts. The total strength of T-type ducts was 60.96 MU and that of H-type ducts was 14.76 MU. Obviously, T-type surface ducts were the dominant winter duct from December 2017 to February 2020, with greater occurrence and highter strength than H-type ducts, and therefore the temperature inversion could be a main cause of surface ducts in Svalbard winter. T-type and H-type ducts in three winters are compared, and domination of T-type ducts in both numbers and total strengths was found in all winters (). There were eleven strong ducts with strength greater than 2.00 MU, including eight strong T-type ducts and three H-type ducts. Most of the strong T-type ducts were supported by a temperature term except one; however, all of the strong H-type ducts were mainly supported by a humidity term with weak support from the temperature term. Based on the above analysis, T-type ducts were dominant in surface ducts, indicating temperature inversion as the main cause of surface ducts in Svalbard winter.
Table 1. T-type and H-type surface ducts in Svalbard winter, with strength in monitor units.
Figure 2. Percentage contributions of temperature and humidity terms to surface ducts at Svalbard in winter months from December 2017 to February 2020. The duct cases are denoted by solid circles, with sizes for relative strength and color grades for strength. The dashed line denotes the division of 50 percent contributions by temperature and humidity terms.
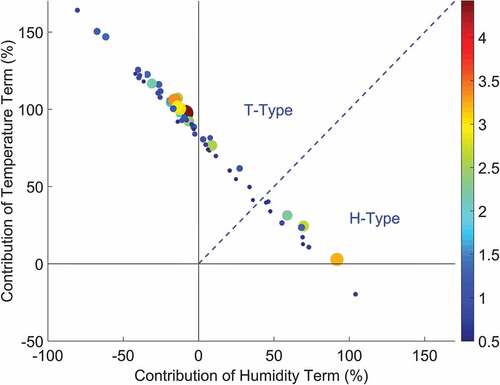
Therefore, the surface duct in Svalbard winter could be characterized as two types according to contributions of temperature and humidity structures. Domination of T-type ducts in number and strength could indicate the importance of temperature inversion in construction of surface ducts in Svalbard winter.
Atmospheric and ocean conditions
As discussed above, the T-type surface duct is mainly attributed to a temperature inversion in the near-surface atmosphere, and H-type ducts are related to a vertical humidity gradient. Atmospheric and ocean conditions benefiting constructions of two type ducts are analyzed and discussed in this section, based on ERA-5 reanalysis and observation data.
T-type surface duct
Average atmospheric situations for Svalbard winter, T-type duct days, and their difference are plotted in , on a 1,000-hPa pressure surface, with geopotential height, temperature, and humidity distributions. On the winter average chart (), a high is located north of Greenland, over 90 m, and a low over the Norwegian Sea, below 0 m. The height contours run from northeast to southwest over Svalbard with a northeasterly geostrophic wind. On the T-type duct chart () the high is enhanced, over 110 m northeast of Greenland, and the low is decreased, below −30 m over the Norwegian Sea. With the enhanced pressure gradient between the high and low, the northeasterly over Svalbard is strengthened. The enhanced northeasterly could bring colder and drier air from the deep Arctic to Svalbard and result in a temperature decrease of more than 4°C and a humidity decrease of more than 0.4 g/kg over Svalbard on the difference charts ().
Figure 3. Atmospheric situations at 1,000 hPa for winter average, T-type duct days, and their difference from December 2018 to February 2020. The plotted area is at latitudes from 70° N to 85° N and longitudes from 120° W to 600° E, with Ny-Ålesund, Svalbard, denoted by a black dot. The contours are geopotential height (m). The color grades are (a)–(c) air temperature (°C) and (d)–(f) air humidity (g/kg). (a), (d) Winter average, (b), (e) T-type duct days, and (c), (f) difference of T-type duct days from winter average.
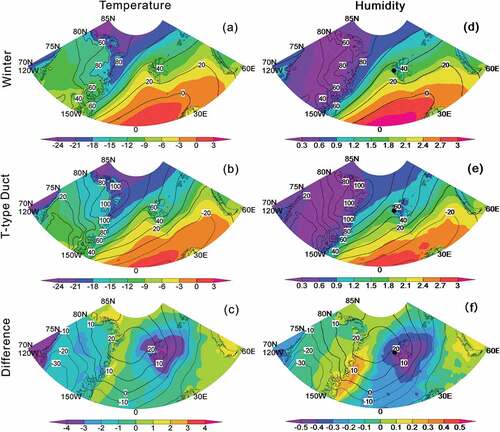
The colder and drier air brought from the deep Arctic on T-type days could decrease the water vapor content and clouds over Svalbard, weaken downward longwave radiation from the atmosphere, and strengthen surface radiative cooling during polar nights without solar radiation (Ruckstuhl et al. Citation2007; Raddatz et al. Citation2013; Yeo et al. Citation2018; Yamanouchi Citation2019). The enhanced surface cooling could induce a strong temperature inversion in the near-surface atmosphere and support construction of T-type ducts (Yamanouchi and Kawaguchi Citation1984; Stull Citation1988; Bradley and Keimig Citation1992).
To prove this process, we retrieved and analyzed radiation, temperature, and cloud data from local observations at Ny-Ålesund. Low cloud days and column water vapor content were obviously decreased on T-type duct days. The frequency of cloudy days was decreased to 21.8 percent on T-type days from 63.4 percent on winter days. The column water vapor content was also decreased to 2.5 kg/m2 on T-type days from 4.1 kg/m2 on winter days. Consequently, the downward longwave radiation decreased to 185.7 W/m2 on T-type days from 227.9 W/m2 on winter days, and the net radiation decreased to −44.4 W/m2 on T-type days from −30.4 W/m2 on winter days, reflecting a more than 30 percent increase of surface radiative cooling. This enhanced surface cooling caused a 5.5°C decrease in surface air temperature to −14.6°C on T-type days from −9.1°C on winter days. The air temperature at 50 m was also decreased due to cold air invasion, but it was much weaker than on the surface. The temperature difference was −2.4°C between 2 m and 50 m aboveground on T-type days, whereas it was only −0.6°C on winter days. Therefore, the enhanced temperature inversion caused by increased surface cooling under the atmospheric conditions could be the main support for the more frequent and stronger T-type surface ducts over Svalbard in winter.
H-type surface duct
Similar to the analysis for T-type ducts, average atmospheric situations for winter days, H-type duct days, and their difference are plotted in , on a 1,000-hPa pressure surface, with geopotential height, temperature, and humidity distributions. Because is same as , the discussion on atmospheric situation on winter days is the same as that for T-type ducts. On the H-type duct chart (), a high over 150 m is located over the Kara Sea and a low below 40 m on south of the Greenland Sea. The geopotential height contours lie from southeast to northwest over Svalbard, indicating southeasterly geostrophic wind over this region, associated with the high and low. The southeasterly on H-type days brings warmer and wetter air from Norwegian Sea, with temperature and humidity increases more than 3°C and 0.5 g/kg over Svalbard on the difference charts ().
Figure 4. Atmospheric situations on 1,000 hPa for winter average, H-type duct days, and their difference from December 2018 to February 2020. The plotted area is at latitudes from 70° N to 85° N and longitudes from 120° W to 60° E, with Ny-Ålesund, Svalbard, denoted by a black dot. The contours are geopotential height (m). The color grades are (a)–(c) air temperature (°C) and (d)–(f) air humidity (g/kg). (a), (d) Winter average, (b), (e) H-type duct days, and (c), (f) difference of H-type duct days from winter average.
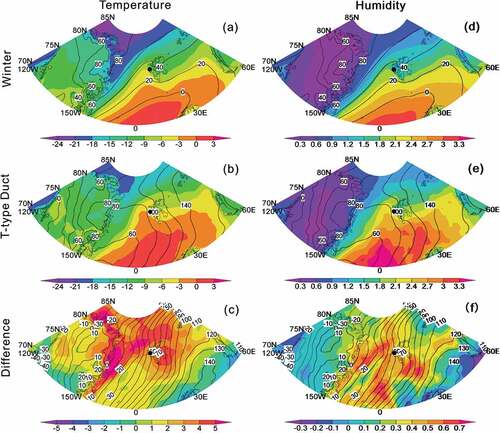
Contrary to the T-type duct days, the atmospheric situation on H-type days could enhance water vapor content and low cloud with higher temperature and therefore increase downward longwave radiation to the surface (Ruckstuhl et al. Citation2007; Raddatz et al. Citation2013; Yeo et al. Citation2018; Yamanouchi Citation2019). The increased downward longwave radiation, as the only radiative heat source during polar nights, could warm the sea around Svalbard and lead to more evaporation on H-type days (Liu, Key, and Wang Citation2009; Eastman and Warren Citation2010; Monroe, Taylor, and Boisvert Citation2021). As result of the enhanced evaporation, the surface air humidity would be increased, and the vertical humidity gradient would be strengthened to support H-type ducts over Svalbard.
Observations at Ny-Ålesund and SST were investigated. The low cloud days and column water vapor content were obviously increased on H-type duct days, comparing to those on winter days. The frequency of low clouds was increased to 83.3 percent on H-type days from 63.4 percent on winter days, and the column water vapor content increased to 5.6 kg/m2 from 4.1 kg/m2. Consequently, the downward longwave radiation was increased to 263.6 W/m2 on H-type days from 227.9 W/m2 on winter days. As the sea heated, SST in the neighboring sea area of Ny-Ålesund was increased 1.2°C to 0.8°C on H-type days from −0.4°C on winter days. The enhanced SST brought a surface air humidity increase of 0.62 g/kg to 2.11 g/kg on H-type days from 1.49 g/kg on winter days and a humidity increase of 0.15 g/kg between 2 m and 50 m aboveground to 0.17 g/kg from 0.02 g/kg. Therefore, the enhanced humidity gradient caused by sea surface warming under the atmospheric condition could be the main support for the H-type surface ducts in Svalbard winter.
Based on the above analysis and discussion, the frequent and strong T-type surface ducts in Svalbard winter are related to atmospheric conditions with colder, drier, and northeasterly weather, and the temperature inversion caused by enhanced surface radiative cooling is the main support for duct construction. The H-type surface duct is related to atmospheric and ocean conditions with warmer, more humid, southeasterly weather and higher SST, and the humidity gradient formed by sea water evaporation is the main support for duct construction. The change in downward longwave radiation is the controlling process in surface duct construction in Svalbard winter.
Conclusions
In this study, surface ducts in Svalbard winter from December 2017 to February 2020 were analyzed and discussed based on observation and reanalysis data. The results are summarized as follows:
The average occurrence of surface ducts was 12.6 percent, with a mean depth of 13 m and strength of 1.30 MU, during the observational period in Svalbard winter. As part of the Arctic, surface ducts in Svalbard winter are more frequent than in other arctic regions, such as Alaska but less frequent and weaker than at lower latitudes.
According to the contribution of atmospheric structure, surface ducts in Svalbard winter could be characterized to two types: T-type ducts mainly supported by temperature inversion and H-type ducts supported by a humidity gradient. T-type ducts were the dominant surface duct in Svalbard winter, comprising 80 percent of all duct cases, indicating the importance of temperature inversion in constructing surface ducts.
Surface ducts in Svalbard winter are closely related to atmospheric conditions. The temperature inversion caused by enhanced surface radiative cooling could be the main support for T-type surface ducts under atmospheric conditions with colder, drier, and northeasterly weather, and the humidity gradient formed by increased evaporation on surrounding water could be the main support for H-type ducts under atmospheric and ocean conditions with warmer, wetter, and southeasterly weather and higher SST.
Acknowledgment
The authors are thankful to the Alfred Wegener Institute for their meteorological observations over Svalbard, PANGAEA for data support, ECMWF for ERA-5 reanalysis products on Climate Data Store, and the NOAA Physical Sciences Laboratory for SST data.
Disclosure statement
No potential conflict of interest was reported by the authors.
Additional information
Funding
References
- Arthun, M., I. H. Onarheim, J. Dorr, T. Eldevik. 2021. The seasonal and regional transition to an ice-free Arctic. Geophysical Research Letters 48 (1):e2020GL090825. doi:10.1029/2020GL090825.
- Atkinson, B. W., and M. Zhu. 2006. Coastal effects on radar propagation in atmospheric ducting conditions. Meteorological Applications 13 (1):53–62. doi:10.1017/S1350482705001970.
- Babin, S. M., and J. R. Rowland. 1992. Observation of a strong surface radar duct using helicopter acquired fine-scale radio refractivity measurements. Geophysical Research Letters 19 (9):917–20. doi:10.1029/92GL00562.
- Babin, S. M. 1996. Surface duct height distributions for Wallops Island, Virginia, 1985-1994. Journal of Applied Meteorology 35 (1):86–93. doi:10.1175/1520-0450(1996)035<0086:SDHDFW>2.0.CO;2.
- Barnhart, K. R., C. R. Miller, I. Overeem. 2015. Mapping the future expansion of Arctic open water. Nature Climate Change 6. doi:10.1038/NCLIMATE2848.
- Bean, B. R., and E. J. Dutton. 1968. Radio Meteorology, 435. New York: Dover Publication Inc.
- Berkryaev, R. V., I. V. Polyakov, and V. A. Alexeev. 2010. Role of polar amplification in long-term surface air temperature variations and modern Arctic warming. Journal of Climate 23 (14):3888–906. doi:10.1175/2010JCLI3297.1.
- Borsum, D. L. 1995. Doppler dilemma delineates danger from dirt. In National Weather Service Western Region technical attachment 95-07, 7. Boise, ID: National Weather Service Field Office. https://www.weather.gov/media/wrh/online_publications/TAs/ta9507.pdf
- Bradley, R. S., and F. T. Keimig. 1992. Climatology of surface-based inversions in the North American Arctic. Journal of Geophysical Research 97 (D14):15699–712. doi:10.1029/92JD01451.
- Brooks, I. M., A. K. Goroch, and D. P. Rogers. 1999. Observations of strong surface radar ducts over the Persian Gulf. Journal of Applied Meteorology 38 (9):1294–310. doi:10.1175/1520-0450(1999)038<1293:OOSSRD>2.0.CO;2.
- Cai, Q., J. Wang, D. Beletsky, J. Overland, M. Ikeda, L. Wan. 2021. Accelerated decline of summer Arctic sea ice during 1850–2017 and the amplified Arctic warming during the recent decades. Environmental Research Letters 16 (3):034015. doi:10.1088/1748-9326/abdb5f.
- Cai, Z., Q. You, F. Wu. 2021. Arctic warming revealed by multiple CMIP6 models: Evaluation of historical simulations and quantification of future projection uncertainties. Journal of Climate 34:4871–92. doi:10.1175/JCLI-D-20-0791.1.
- Cao, Y., M. Yu, F. Hui, J. Zhang, X. Cheng. 2021. Review of navigability changes in trans-Arctic routes. Chinese Science Bulletin 66 (1):21–33. doi:10.1360/TB-2020-0596.
- Chen, S., Y. Cao, F. Hui, X. Cheng. 2019. Observed spatial-temporal changes in the autumn navigability of the Arctic Northeast Route from 2010 to 2017. Chinese Science Bulletin 64(14):1515–25. in Chinese. doi:10.1360/N972018-01083.
- Cheng, Y., S. Zhou, D. Wang, Y. Lu, J. Yao. 2015. Statistical characteristics of the surface ducts over the South China Sea from GPS radiosonde data. Acta Oceanologica Sinica 34 (11):63–70. doi:10.1007/s13131-015-0749-x.
- Cohen, J., J. Jones, J. C. Furtado, and E. Tziperman. 2013. Warm Arctic, cold continents: A common pattern related to Arctic sea ice melt, snow advance, and extreme winter weather. Oceanography 26 (4):150–60. doi:10.5670/oceanog.2013.70.
- Cohen, J., J. A. Screen, J. C. Furtado, M. Barlow, D. Whittleston, D. Coumou, J. Francis, K. Dethloff, D. Entekhabi, J. Overland, et al. 2014. Recent Arctic amplification and extreme mid-latitude weather. Nature Geoscience 7 (9):627–37. doi:10.1038/NGEO2234.
- Cosmiso, J. C., C. L. Parkinson, R. Gersten. 2008. Accelerated decline in the Arctic sea ice cover. Geophysical Research Letters 35:L01703. doi:10.1029/2007GL031972.
- Dai, A., D. Luo, M. Song, J. Liu. 2019. Arctic amplification is caused by sea-ice loss under increasing CO2. Nature Communications 10 (1):121. doi:10.1038/s41467-018-07954-9.
- Davy, R., and S. Outten. 2020. The Arctic surface climate in CMIP6: Status and developments since CMIP5. Journal of Climate 33 (18):8047–68. doi:10.1175/JCLI-D-19-0990.s1.
- Eastman, R., and S. G. Warren. 2010. Interannual variations of Arctic cloud types in relation to sea ice. Journal of Climate 23 (15):4216–32. doi:10.1175/2010JCLI3492.1.
- Engeln, A., and J. Teixeira. 2004. A ducting climatology derived from the European Centre for Medium-Range Weather Forecasts global analysis fields. Journal of Geophysical Research 109 (D18):D18104. doi:10.1029/2003JD004380.
- Gao, Y., J. Sun, L. F, S. He, S. Sandven, Q. Yan, Z. Zhang, K. Lohmann, N. Keenlyside, T. Furevik, et al. 2015. Arctic sea ice and Eurasian climate: A review. Advances in Atmospheric Sciences. 32(1):92–114. doi:10.1007/s00376-014-0009-6.
- Gossard, E. E. 1977. Refractive index variance and its height distribution in different air masses. Radio Science 12 (1):89–105. doi:10.1029/RS012i001p00089.
- Hao, X., Q. Li, L. Guo. 2018. Spatial and temporal features of atmospheric ducts over the North Pole. Chinese Journal of Polar Research 30:349–59. in Chinese
- Hersbach, H., B. Bell, P. Berrisford, S. Hirahara, A. Horányi, J. Muñoz‐Sabater, J. Nicolas, C. Peubey, R. Radu, D. Schepers, et al. 2020. The ERA5 global reanalysis. Quarterly Journal of the Royal Meteorological Society 146 (730):1999–2049. doi:10.1002/qj.3803.
- Huang, B., C. Liu, V. Banzon, E. Freeman, G. Graham, B. Hankins, T. Smith, H.-M. Zhang. 2021. Improvements of the daily optimum interpolation sea surface temperature (DOISST) version 2.1. Journal of Climate 34(8):2923–39. V2.1. doi:10.1175/JCLI-D-20-0166.1.
- Intergovernmental Panel on Climate Change. 2013. Climate change 2013: The physical science basis. Contribution of working group I to The Fifth Assessment Report of the Intergovernmental Panel on Climate Change. T. F. Stocker, eds. Cambridge, United Kingdom and New York, NY, USA: Cambridge University Press. 1535. 10.1017/CBO9781107415324
- Kaissassou, S., A. Lenouo, A. Nzeukou, C. Tchawoua, D. A. Vondou. 2015. Seasonal variations of surface duct conditions in Ngaoundere, North Cameroon. Meteorology and Atmospheric Physics 127 (6):659–74. doi:10.1007/s00703-015-0387-z.
- Lenouo, A. 2014. Climatology of anomalous propagation radar over Douala, Cameroon. Meteorological Applications 21:249–55. doi:10.1002/met.1321.
- Li, Z., J. W. Ringsberg, and F. Rita. 2021. A voyage planning tool for ships sailing between Europe and Asia via the Arctic. Ships and Offshore Structures 15 (1):S10–S19. doi:10.1080/17445302.2020.1739369.
- Liu, Y., J. R. Key, and X. Wang. 2009. Influence of changes in sea ice concentration and cloud cover on recent Arctic surface temperature trends. Geophysical Research Letters 36 (20):L20710. doi:10.1029/2009GL040708.
- Lopez, P. 2009. A 5-yr 40-km-resolution global climatology of superrefraction for ground-based weather radars. Journal of Applied Meteorology and Climatology 48 (1):89–110. doi:10.1175/2008JAMC1961.1.
- Mai, Y., Z. Sheng, H. Shi. 2020. Spatiotemporal distribution of atmospheric ducts in Alaska and its relationship with the Arctic vortex. International Journal of Antennas and Propagation 9673289. doi:10.1155/2020/9673289.
- Maturilli, M. 2018a. Expanded measurements from station Ny-Ålesund. PANGAEA: Alfred Wegener Institute - Research Unit Potsdam. doi:10.1594/PANGAEA.892409.
- Maturilli, M. 2018b. High resolution radiosonde measurements from station Ny-Ålesund. PANGAEA: Alfred Wegener Institute - Research Unit Potsdam. doi:10.1594/PANGAEA.891224.
- Maturilli, M. 2020. Basic and other measurements of radiation at station Ny-Ålesund. Alfred Wegener Institute - Research Unit Potsdam, PANGAEA. doi: 10.1594/PANGAEA.913150.
- Melia, N., K. Haines, and E. Hawkins. 2016. Sea ice decline and 21st century trans-Arctic shipping routes. Geophysical Research Letters 43 (18):9720–28. doi:10.1002/2016GL069315.
- Mentes, S. S., and Z. Kaymaz. 2007. Investigation of surface duct conditions over Istanbul, Turkey. Journal of Applied Meteorology and Climatology 46 (3):318–37. doi:10.1175/JAM2452.1.
- Mesnard, F., and H. Sauvageot. 2010. Climatology of anomalous propagation radar echoes in a coastal area. Journal of Applied Meteorology and Climatology 49 (11):2285–300. doi:10.1175/2010JAMC2440.1.
- Monroe, E. E., P. C. Taylor, and L. N. Boisvert. 2021. Arctic cloud response to a perturbation in sea ice concentration: The North Water polynya. Journal of Geophysical Research: Atmospheres 126 (16):e2020JD034409. doi:10.1029/2020JD034409.
- Mosczkowicz, S., G. J. Ciach, and W. F. Krajewski. 1994. Statistical detection of anomalous propagation in radar reflectivity patterns. Journal of Atmospheric and Oceanic Technology 11 (4):1026–34. doi:10.1175/1520-0426(1994)011<1026:SDOAPI>2.0.CO;2.
- Raddatz, R. L., M. G. Asplin, T. Papakyriakou, L. M. Candlish, R. J. Galley, B. Else, D. G. Barber. 2013. All-sky downwelling longwave radiation and atmospheric-column water vapour and temperature over the western maritime Arctic. Atmosphere-Ocean 51 (2):145–52. doi:10.1080/07055900.2012.760441.
- Reynolds, R. W., N. A. Rayner, T. M. Smith, D. C. Stokes, W. Wang. 2002. An improved in situ and satellite SST analysis for climate. Journal of Climate. 15(13):1609–25. doi:10.1175/1520-0442(2002)015<1609:AIISAS>2.0.CO;2.
- Ruckstuhl, C., R. Philipona, J. Morland, A. Ohmura. 2007. Observed relationship between surface specific humidity, integrated water vapor, and longwave downward radiation at different altitudes. Journal of Geophysical Research 112 (D3):D03302. doi:10.1029/2006JD007850.
- Screen, J. A., and I. Simmonds. 2010. The central role of diminishing sea ice in recent Arctic temperature amplification. Nature 464 (7293):1334–37. doi:10.1038/nature09051.
- Serreze, M. C., A. P. Barrett, and J. J. Cassano. 2011. Circulation and surface controls on the lower tropospheric air temperature field of the Arctic. Journal of Geophysical Research 116 (D7):D07104. doi:10.1029/2010JD015127.
- Shepherd, T. G. 2016. Effects of a warming Arctic. Science 353 (6303):989–90. doi:10.1126/science.aag2349.
- Stull, R. B. 1988. An introduction to boundary layer meteorology, 666. Dordrecht, Boston and London: Kluwer Academic Publishers. doi:10.1007/978-94-009-3027-8.
- Symon, C., L. Arris, and B. Heal. 2004. Arctic climate impact assessment. New York: Cambridge Univ. Press.
- Tomczyk, A. M., E. B. Lupikasza, and S. Kendzierski. 2019. Warm winter and cold summer spells in Spitsbergen and their circulation conditions. Polish Polar Research 40:339–59. doi:10.24425/ppr.2019.130902.
- Viher, M., M. T. Prtenjak, and B. Grisogono. 2013. A multi-year study of the anomalous propagation conditions along the coast of the Adriatic Sea. Journal of Atmospheric and Solar-Terrestrial Physics 97:75–84. doi:10.1016/j.jastp.2013.01.014.
- Yamanouchi, T., and S. Kawaguchi. 1984. Longwave radiation balance under as strong surface inversion in the Katabatic Wind Zone, Antarctica. Journal of Geophysical Research 89 (D7):11771–78. doi:10.1029/JD089iD07p11771.
- Yamanouchi, T. 2019. Arctic warming by cloud radiation enhanced by moist air intrusion observed at Ny-Ålesund, Svalbard. Polar Science 21:110–16. doi:10.1016/j.polar.2018.10.009.
- Yeo, H., S.-J. Park, B.-M. Kim, M. Shiobara, S.-W. Kim, H. Kwon, J.-H. Kim, J.-H. Jeong, S. S. Park, T. Choi, et al. 2018. The observed relationship of cloud to surface longwave radiation and air temperature at Ny-Ålesund, Svalbard. Tellus B: Chemical and Physical Meteorology 70 (1):1–10. doi:10.1080/16000889.2018.1450589.
- Yu, M., P. Lu, Z. Li, D. Balk, C. Corbane, V. Syrris, and A. J. Florczyk. 2020. Sea ice conditions and navigability through the Northeast Passage in the past 40 years based on remote-sensing data. International Journal of Digital Earth 13 (1):22–44. doi:10.1080/17538947.2020.1860144.
- Zhanyu, Y., Z. Bolin, L. Wanbiao, Z. Yuanjing, D. Jinlin, and D. Fushan. 2000. The analysis on characteristics of atmospheric duct and its effects on the propagation of electromagnetic wave. Acta Meteorologica Sinica 58 (5): 605–15. doi:10.11676/qxxb2000.062. in Chinese.