
ABSTRACT
Climate warming in the North could lead to lichen decline within critical woodland caribou habitat. We used repeat measurements of sixty-nine plots over ten years (2007–2008 and 2017–2018) to assess lichen biomass changes under a warming climate along a latitudinal/climatic gradient in northwestern Canada. We compared lichen biomass on sensitive landscape features, including peat plateaux (permafrost-containing bogs), areas of permafrost thaw within the peat plateaux (collapse scars), and low-productivity upland forests occurring on mineral soils. Field-based measures of lichen cover and height were coupled with samples of lichen biomass to develop biomass prediction equations. The optimal model incorporated both cover and height, with landscape feature as a covariate. Although height significantly improved the equation fit, models were successfully developed with cover alone. Modeled lichen biomass differed significantly between landscape features, declining from peat plateau (502 g m−2) to upland forest (54.0 g m−2) and collapse scar (0.690 g m−2) environments. In the absence of permafrost collapse at any monitoring location, lichen biomass declined significantly over the ten years for peat plateaux (−75.6 g m−2) and upland forests (−17.5 g m−2). These results will be important for quantifying landscape-level lichen biomass changes under climate warming in boreal and subarctic environments.
Introduction
Climate change has been referred to as the defining issue of our time (National Academy of Sciences Citation2014; United Nations Citation2020). Arguably, nowhere is this more relevant than in northern regions, where increases in the global mean surface temperature since the late nineteenth century have been particularly pronounced (Intergovernmental Panel on Climate Change Citation2013). There is evidence that this rapid warming in the North is already affecting vegetation, with widespread greening of the Arctic attributed to increases in deciduous shrubs, along with increased height or abundance of other vascular plant layers (Sturm, Racine, and Tape Citation2001; Pouliot, Latifovic, and Olthof Citation2009; Elmendorf et al. Citation2012; Fraser et al. Citation2014). This increased vascular plant abundance has, in turn, been linked to declines in abundance and diversity of lichens (Cornelissen et al. Citation2001; Lang et al. Citation2012; Fraser et al. Citation2014) with implications for wildlife. Monitoring vegetation changes in boreal and subarctic ecosystems, and how these vary in space and time, is critical for understanding the impact of climate change on these ecosystems and the species that depend upon them.
Lichens are an integral component of many circumboreal forest and tundra communities (Ahti and Oksanen Citation1990; Crittenden Citation2000) and have long been known as sensitive environmental indicators (Richardson Citation1975; Kauppi and Halonen Citation1992). Lichens occur at greatest abundance in dry or low-productivity habitats where there is limited competition from vascular plants (Beckingham and Archibald Citation1996; Keim et al. Citation2017). They are ecologically important as pioneer species in primary succession (Plitt Citation1927; Jun, Clément, and Rozé Citation2004; Nascimbene et al. Citation2017), and within the boreal and subarctic forests of North America, lichens are commonly associated with mature jack pine (Pinus banksiana) or black spruce (Picea mariana) forests, as well as peatlands with dry, raised surfaces (Johnson Citation1981; Morneau and Payette Citation1989; Ahti and Oksanen Citation1990; Bradshaw et al. Citation1995; Harris et al. Citation2018). More sparse forest canopies in northern regions (Lesmerises, Ouellet, and St-Laurent Citation2011; Loranty et al. Citation2018) and surficially dry, open-canopied forests (Keim et al. Citation2017) are commonly associated with high ground lichen cover. In northern regions, permafrost-containing bogs, known as peat plateaux, are nutrient-poor environments, with open forest canopies that commonly have ground layers dominated by terrestrial lichens (Zoltai Citation1993; Piercey-Normore Citation2010). Terrestrial lichens contribute up to 83 percent of the winter diet (Thomas, Edmonds, and Brown Citation1996; Thompson et al. Citation2015) of the boreal woodland caribou (Rangifer tarandus caribou), which is listed as threatened under the Species at Risk Acts of Canada and the Northwest Territories (NWT; Environment Canada Citation2012; Conference of Management Authorities Citation2017). The level of habitat disturbance has been identified as the primary factor affecting the sustainability of a boreal woodland caribou population (Environment Canada Citation2012); thus, the effect of climate change on lichen biomass is clearly an important factor in the management of caribou populations.
Quantifying changes in lichen forage due to climate warming requires accurate repeated measurements of ground lichen biomass. Because the destructive sampling used to measure lichen biomass is labor intensive, many previous studies have focused on predicting lichen biomass from a combination of cover, height, and/or volume of the lichen layer (Arseneault et al. Citation1997; Kumpula, Colpaert, and Nieminen Citation2000; Dunford et al. Citation2006; Moen, Danell, and Holt Citation2007; McMullin et al. Citation2011; Rosso et al. Citation2014; Greuel et al. Citation2021). However, lack of consistent methods and the use of various equation forms have resulted in no standard model for estimating lichen biomass across a range of species or habitats. A widely applicable relationship allowing for the estimation of lichen biomass from simple field measurements would be extraordinarily useful for wildlife biologists and land managers. A recent study (Greuel et al. Citation2021) has begun to explore lichen biomass relationships across a climatic gradient from northern Saskatchewan to central NWT. Relationships between lichen volume and biomass did not vary substantially by forest type or ecoprovince when species were pooled; however, when groups of similar species were considered separately, there were indications that relationships may vary by ecoprovince (Greuel et al. Citation2021). Thus, greater variability is expected in predictive relationships developed across a wide range of species, vegetation types, and ecoclimatic gradients.
Despite substantial evidence for the impact of climate change on arctic vegetation, plot-based vegetation monitoring studies have yielded disparate functional group responses; for example, arctic tundra vegetation most commonly displayed stable trends over a median period of twenty years (Bjorkman et al. Citation2020). Vegetation responses to changing climate are not uniform, being dependant on climatic, edaphic, and ecosystem factors. In the Arctic, vegetation changes are more evident in the less harsh climates of the low to mid-Arctic and responses differ along gradients in soil moisture and permafrost conditions (Cornelissen et al. Citation2001; Elmendorf et al. Citation2012; Bjorkman et al. Citation2018). The responses of boreal and subarctic forest and peatland ecosystems are further complicated by the strong influence of long-term autogenic processes; these systems have considerable ecologic inertia, which, in the absence of disturbance, is likely to result in lagged responses to changing climate conditions (Camill and Clark Citation2000; Vanderwel and Purves Citation2014). An example of this concept was outlined by Shur and Jorgenson (Citation2007), who described “ecosystem-driven” and “ecosystem-protected” permafrost systems where internal, autogenic processes (such as the development of insulating soil and vegetation layers) may dominate, or at least strongly modify, the influence of external, allogenic climatic factors.
In discontinuous permafrost environments of the boreal and subarctic forests, the effects of warming climate are commonly mediated through changes to the underlying permafrost conditions, which may affect the physical soil structure as well as both local and regional hydrology (Robinson Citation2002; Quinton, Hayashi, and Chasmer Citation2011; Quinton and Baltzer Citation2013). Ice-rich permafrost environments are most vulnerable to destabilization upon thaw, and in the Mackenzie Valley of northwestern Canada, much of the permafrost occurs as ice-rich peat plateaux (permafrost-containing peatlands). Permafrost thaw within peat plateaux results in the physical collapse of the ground surface, causing a dramatic change to the local environment with a transition from lichen-dominated ground vegetation to very wet, moss- and sedge-dominated collapse scar features (Zoltai Citation1993; Vitt, Halsey, and Zoltai Citation1994; Robinson and Moore Citation2000). This dramatic response to warming climates is particularly relevant in the Mackenzie Valley of the NWT, which is not only predicted to be one of the regions exhibiting the greatest temperature increases in Canada (Plummer et al. Citation2006; Price et al. Citation2011) but, due to the presence of large areas of ice-rich permafrost, is also a region where the consequences of this warming may be most dramatically evident (Kettles and Tarnocai Citation1999; Tarnocai Citation2006) and will directly affect the abundance of lichen across the landscape.
At present, the direct impacts of climate change on boreal woodland caribou habitat are poorly understood, and the proposed action plan for woodland caribou recovery in Canada specifically identifies the need for research on the predicted impacts of climate change on critical habitat (Environment and Climate Change Canada Citation2017). The research presented herein specifically targeted sensitive landscape features, such as low-productivity black spruce forests and lichen-rich peat plateaux. These landscape features incorporate biophysical attributes identified for all types of critical habitat (broad scale, calving, post-calving, rutting, winter) within the Taiga Plains Ecozone and form the basis of the NT1 Boreal Woodland Caribou Range in the NWT (Environment Canada Citation2012). The most northerly, and second largest, woodland caribou population in Canada resides within the NT1 range that has some of the lowest levels of anthropogenic disturbance (Environment Canada Citation2012) but lies within one of the areas most sensitive to climate warming in Canada (Kettles and Tarnocai Citation1999; Tarnocai Citation2006). The range of climate and permafrost conditions across this landscape, which is sensitive to climate disturbances, makes it an ideal location to study climate change impacts on caribou habitat, particularly with respect to changing lichen biomass across the landscape.
Our overarching goals were to quantify lichen biomass variation along a North–South gradient for upland forest and peatland environments of the Mackenzie Valley, northwestern Canada, and to determine whether lichen biomass has changed over ten years of warming climate conditions. To achieve this, we first developed a predictive model to estimate lichen biomass using in-plot measurements of lichen cover and the height of the lichen layer.
We hypothesized that (1) we can predict lichen biomass using lichen cover and can improve the prediction ability by incorporating either the height of the lichen layer or by using genus-specific cover-biomass relationships; (2) these predictive relationships for lichen biomass vary by topographic feature along a latitudinal/climatic gradient as expressed through ecoclimatic region or permafrost zone; (3) estimated lichen biomass is greatest in peat plateau environments and lowest in collapse scar environments; in peat plateau and upland forest environments, lichen biomass is greater in the northern portions of the Mackenzie Valley because of more open forest canopies; and (4) in the absence of dramatic permafrost thaw, lichen biomass did not change significantly over the last ten years in undisturbed forest and peatland environments of the Mackenzie Valley of the NWT.
Materials and methods
Study area and plot network
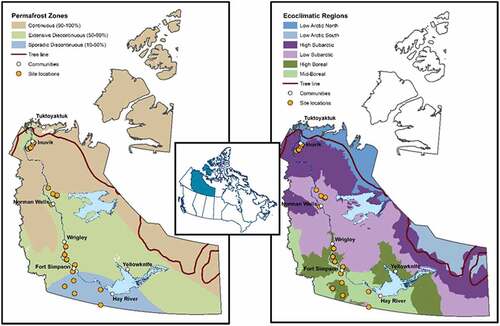
Our research utilizes a network of twenty-five sites, comprising sixty-nine plots, within the Mackenzie Valley region of Canada’s NWT (). The Mackenzie Valley Permanent Monitoring Plot Network lies almost entirely within the Taiga Plains Ecozone (Ecological Stratification Working Group Citation1996) and spans a climatic gradient from −8.8°C to −2.9°C in mean annual temperature and from 248.4 mm to 369.0 mm in mean annual precipitation (Environment Canada Citation2002; Errington, Bhatti, and Li Citation2018). This climatic gradient is reflected in three permafrost zones and four ecoclimatic regions (level III ecoregions of the Ecosystem Classification Group Citation2007, Citation2008; ). Indicative of the amount of ground surface underlain by permafrost, network sites extend, south to north, from the sporadic discontinuous through to the extensive discontinuous and continuous permafrost zones, where permafrost underlies 10 to 50 percent, 50 to 90 percent, and 90 to 100 percent of the terrain, respectively (Heginbottom, Dubreuil, and Parker Citation1995). Reflecting the climatic variation and its impact on regional vegetation, ecoclimatic regions of the plot network encompass mid-boreal, high boreal, low subarctic, and high subarctic environments ().
Figure 1. Site locations of the Mackenzie Valley Permanent Monitoring Plot Network with respect to permafrost zones (Heginbottom, Dubreuil, and Parker Citation1995) and level II ecoregions (Ecosystem Classification Group Citation2007, Citation2008, Citation2010) in the Northwest Territories, Canada.
Because regional climatic gradients are modified by the influence of local factors on vegetation structure and permafrost conditions, plots at each network site were situated along a local topographic gradient (). Plots at each site were located in peat plateau, collapse scar, and nearby upland forest environments that were selected to be free of recent disturbance and having mature forest canopies, when treed. Tree ages (mean ± standard error [SE], maximum; based on cores at 1.3 m height) were as follows: peat plateau = 92 ± 4 years, 151 years; upland forest 129 ± 10 years, 241 years (for detailed stand characteristics, see Errington, Bhatti, and Li Citation2020). The six most northern sites lacked plots representing collapse scar environments because climatic limitations in the high subarctic continuous permafrost zone prevent the formation of comparable collapse features on the landscape.
Figure 2. Sample site layout encompassing upland forest, peat plateau, and collapse scar environments along a topographic gradient. Soils and active layer depths vary along this gradient, with a transition from mineral (white) soils in the upland to organic (gray) soils in the peat plateau and collapse scar. The shallowest active layer depths are found in the peat plateaux, with permafrost (hatched) absent from collapse scars and may or may not be present at depth in upland forests. Figure has been adapted from Errington, Bhatti, and Li (Citation2018).
Sample collection and processing
With few modifications, generally due to spatial constraints of collapse scar features, each plot was laid out as a 20 × 20 m square with understory vegetation recorded in eight 1 × 1 m subplots systematically oriented within the larger plot area (Errington, Bhatti, and Li Citation2018; ). Plots were established in the summers of 2007 and 2008 with repeated measurements conducted ten years later, in 2017 and 2018. Although sites are located within a region of rapidly warming climate conditions and widespread thermokarst within peat plateau environments (Gibson et al. Citation2021), permafrost was detected at all peat plateau subplots at both measurement times. At both sampling times, within the vegetation subplots, all ground lichens were identified to species level and cover was visually estimated to the nearest percent with cover values of 0.5 percent and ‘+’ (present but at lower than 0.5 percent cover) also recorded. For quantitative analysis, ‘+’ was interpreted as a cover value of 0.05 percent. Although it is recognized that it is not possible to achieve percent-level accuracy by eye and that at best these percentages can be thought of as ±5 to 10 percent (Milberg et al. Citation2008; Vittoz et al. Citation2010), recording values to the nearest percent prevents further errors inherent in generalization to categories (Vittoz and Guisan Citation2007). A single, well-experienced, observer (Errington) conducted all estimates of percent cover, in all four field seasons, in order to maximize estimation consistency within the data set (Vittoz and Guisan Citation2007). Though lichen species were largely identified in the field, because some species can be difficult to identify without chemical analysis, unknown species and reference specimens were collected and identified in the laboratory.
Figure 3. Plot-level layout and sampling design, showing the eight 1 × 1 m vegetation quadrats within the larger 20 × 20 m permanent monitoring plot (PMP) and the four 0.25 × 0.25 m clip plots located outside the PMP boundaries. Quadrats were located in PMP corners and at the midpoints between the corners and the plot center (PC). Clip plots were located according to a stratified random design with respect to four classes of total lichen cover (<25 percent, 25–49 percent, 50–75 percent, >75 percent). Hollow circles in the expanded inset diagrams indicate the locations of lichen height measurements.
In order to estimate lichen biomass within the permanent monitoring plots, in-plot measurements (2007–2008 and 2017–2018) were coupled with destructive sampling outside of the plot boundaries (2007–2008). Each vegetation subplot was divided into a 25 × 25 cm grid and lichen canopy height was measured at the center point of all sixteen grid squares (). In areas of sparse lichen coverage, the height of the closest piece of lichen to each center point was recorded, with no measurement collected if no lichen was present in the grid square. This differs from several other studies using height to predict lichen biomass, where height was recorded at a fixed point and zero values were recorded if no lichen was present (Moen, Danell, and Holt Citation2007; Rosso et al. Citation2014). The use of zero values to represent absence results in a height variable that incorporates cover (Moen, Danell, and Holt Citation2007), whereas our method provides a more independent estimate of height. Because height measurements were systematically located within subplots, they characterized the overall height of lichen within the subplot but were not species specific.
Destructive sampling for lichen biomass was conducted within four 25 × 25 cm lichen clip plots located outside of each 20 × 20 m permanent plot (). These were placed using a stratified random approach to ensure that a full range of lichen cover was sampled, with each clip plot randomly placed in an area with one of four lichen percent cover classes (<25 percent, 25–49 percent, 50–75 percent, >75 percent). This design ensured that the regression equations were developed based on a wide range of lichen covers, making them more broadly useful and avoiding the common bias of focusing sampling on areas with high lichen cover. However, for plots with low lichen abundance, it was occasionally only possible to locate clip plots representative of the lower cover classes. Within each clip plot, lichen canopy height was measured in the center of each of four quadrants, as with the vegetation subplot grids (). For each lichen clip plot, percent cover was also estimated for the following common species/groups: Cladonia uncialis, Cladonia (other) spp., Cladina mitis, Cladina rangiferinia, Cladina stygia, Cladina stellaris, Flavocetraria nivalis, Flavocetraria cucullata, Cetraria spp., Peltigera spp., and “other.” Current taxonomy incorporates the Cladina spp. as a subgenus within Cladonia (Ahti and DePriest Citation2001; Esslinger Citation2019), but because of clear morphological distinctions between the species groups, we follow the older distinction of Cladina (the classic “reindeer lichen” species) as a separate genus (Ahti Citation1984) for the purpose of this analysis. Following height measurements and cover estimation, all living lichen within the clip plot frame were pulled from the underlying soil, collected in paper bags, and kept in a dry, well-aerated location and encouraged to air-dry during transport to the laboratory. In the laboratory, lichen samples were misted with water to facilitate handling without breakage and were then cleaned of non-lichen debris and dead lichen fragments (fragments and portions of thallus that lacked structural integrity), sorted by genus, and dried at 60°C ± 5°C to a stable weight to determine the biomass. Although cover was recorded to the species level for several common species, clip plot samples were only sorted to genus (Allectoria, Cetraria, Cladina, Cladonia, Flavocetraria, Nephroma, Peltigera, and Stereocaulon) to maintain reasonable sample sizes and to allow for a less specialized classification that would be more widely useable in the future.
Statistical methods
As the first step of our analyses, we used clip plot data to develop a series of lichen biomass models. The best possible model of lichen biomass was then applied to data from the permanent monitoring plot network vegetation subplots to examine variation in biomass along ecoclimatic and topographic gradients and change over the ten-year period. The process of building a series of predictive models of lichen biomass using the clip plot data involved five sets of models, based on two related data sets.
Model sets 1 and 2: cover and height models
The first two sets of models utilized the total clip plot data set, which included total lichen biomass, total lichen cover (all species values summed), and height from each clip plot. For the first set of models, lichen biomass was the dependent variable, lichen cover was the predictor variable, and plot type (peat plateau, upland forest, collapse scar), ecoclimatic region, and permafrost zone were considered as possible covariates. The second set of models elaborated on these by including height as an additional predictor variable. Percent cover was used as the predictor variable in the first set of models because it was thought to be the most common variable recorded in other vegetation studies and would be most conducive to scaling up using remote sensing procedures (e.g., Arseneault et al. Citation1997; Nelson et al. Citation2013). We chose height of the lichen layer as an additional possible predictor variable because it has been established as another important predictor of lichen biomass (Kumpula, Colpaert, and Nieminen Citation2000; Moen, Danell, and Holt Citation2007; Rosso et al. Citation2014). For these two sets of models, the sample size was 200; however, because samples were not entirely independent, we included plot as a random term to account for clip plots nested within plots.
Model sets 3 and 4: cover and genus models
The third and fourth (and fifth) sets of models utilized the genus clip plot data set, which included lichen biomass and lichen cover for each genus separately within each clip plot. Because height was measured at the clip plot level and was not associated with particular lichen genera, this data set did not include height and our data structure did not allow for direct comparison of height versus genus as predictor variables. In the third set of models, the dependent variable was lichen biomass (measured separately by genus) and lichen cover (estimated separately for each genus) was the predictor variable. As above, plot type (peat plateau, upland forest, collapse scar), ecoclimatic region, and permafrost zone were considered as possible covariates. The fourth set of models elaborated on these by including genus as an additional predictor variable. Because these models included estimates of cover and measures of biomass separately by genus in each clip plot, a given clip plot might appear more than once in the data set (once for each genus); thus, the sample size for the data set was 483. Again, these samples were not independent and we, therefore, included clip plot nested within plot as a random term, accounting for samples doubly nested within clip plots and then within plots.
Model set 5: individual genus models
In the fifth set of models, which was intended as a complement to the fourth set of models, separate models were developed for each of the four most common lichen genera in our data set (Cladina, Cladonia, Flavocetraria, and Peltigera). Because each genus was modeled separately, this allowed for more flexibility, in terms of model form, between genera. Using the same data set as for the third and fourth sets of models, the dependent variable was lichen biomass (for a given genus) and lichen cover (for that genus) was the predictor variable. As above, plot type (peat plateau, upland forest, collapse scar), ecoclimatic region, and permafrost zone were considered as possible covariates. Because separate models were developed for each genus, a given clip plot would appear only once in the data set for each model. We thus included plot as a random term, to account for the clip plot samples nested within the plots.
Model development and selection
A mixed modeling approach using the nlme package (Pinheiro et al. Citation2021) in R (R Core Team Citation2019) was used to develop all lichen biomass models. Fixed and random factors were included as identified above. Incorporation of site as a random, blocking, factor did not improve the model structure (assessed using the Akaike information criterion [AIC]; Zuur et al. Citation2009) and was therefore not included. For a given set of models, we began with four models: the base model (just the predictor(s)), one including the predictor(s) and the climatic covariates (ecoclimatic region, permafrost zone), one including the predictor(s) and the topographic covariate (plot type), and a full model with all predictor(s) and covariates. In each case, interactions were included between all continuous variables (cover and height) and between all continuous and categorical variables (ecoclimatic region, permafrost zone, topographic feature, and genus). Backwards selection, using likelihood ratio tests (α = 0.05), was then used to determine the most parsimonious structure for each of these four models (Zuur et al. Citation2009). AIC was used to compare among the four reduced models to determine the best model in a given set. For all models within a given set where ΔAIC relative to the minimum AIC of models within that set was less than two (Burnham and Anderson Citation2004), the most parsimonious model was determined as the best model within that set. Finally, the AIC and, where possible, likelihood ratio tests (LRTs; α = 0.05) were used to compare the reduced models of set 1 to those of set 2 and the reduced models of set 3 to those of set 4 to determine whether the addition of height or genus improved the model. Once this model-building exercise was complete, the best model was then used to predict lichen biomass within the permanent monitoring plots for both the 2007–2008 and 2017–2018 measurement periods. Lichen biomass was predicted at the subplot level and then averaged to the plot level for analyses.
Biomass comparison
A two-way analysis of variance (ANOVA) was used to test for plot-level differences in lichen biomass between permafrost zones and topographic features in 2007–2008. Subsequently, biomass change was calculated as the difference between the 2017–2018 and 2007–2008 data sets at the plot level, and a two-way ANOVA was used to determine whether these biomass changes varied by permafrost zone or topographic feature. Significant increases or decreases in lichen biomass over the ten-year period were detected when 95 percent confidence intervals for the change in biomass excluded zero. When there was a significant interaction detected in the ANOVA, Tukey’s post hoc tests were used to compare all combinations of permafrost zone and topographic feature. Natural log transformations of lichen biomass and variance weighting (Zuur et al. Citation2009) by topographic plot type (ten-year change) or topographic plot type × permafrost zone (2007–2008 analysis) were used to meet assumptions of normality and equal variances. Least squares means, standard errors, and Tukey’s post hoc comparisons were generated using the emmeans package (Lenth Citation2019) with ANOVAs calculated from gls models within the nlme package, using the Anova function from the CAR package (Fox and Weisberg Citation2019). The Anova function in the CAR package uses Type II sum of squares to conduct marginal, nonsequential testing (Fox and Weisberg Citation2011). For clarity of presentation, least squares means, standard errors, and associated 95 percent confidence intervals were back-transformed to the original biomass units of grams per square meter.
Results
Biomass prediction
Linear regressions between the natural log of lichen cover and the natural log of biomass demonstrated good fits, with reasonably high marginal R2 values for both the overall (model 4; mR2 = 0.72; model sets 1 and 2) and genus-level (model 12; mR2 = 0.78; model sets 3 and 4) data sets (). However, in both cases the models were significantly improved through the addition of either height (LRT; model 4 vs. 8; p < 0.001; model sets 1 and 2) or genus (LRT; model 12 vs. 16; p < 0.001; model sets 3 and 4). Although the backwards selection procedure did find that both covariates contributed significantly to models in which they were tested, the range in AIC values between full, reduced, and base models was negligible when both cover and height (, Appendix I; AIC difference range = 3) were incorporated in the base model (set 2). For model sets in which cover was the only predictor (sets 1 and 3) or that had both cover and genus (set 4), the AIC range was slightly greater (AIC difference range = 8–9), but in all three instances the base model did not have the lowest AIC. In all instances, the incorporation of plot type into the model improved the model more than adding either ecoclimatic region or permafrost zone (, Appendixes I and II). For the subsequent purpose of biomass prediction, we used model 6 for plots where both cover and height of lichen were available and model 2 for the few instances where height data were missing (). These models were selected as best within model set 2 and model set 1, respectively, being the most parsimonious model with an AIC within 2 of the lowest AIC of the relevant model set (, Appendix I). The best model for biomass prediction when cover data are available by genus (model 14, ) is shown in Appendix III (Figure A1).
Table 1. Models predicting lichen biomass as developed using various combinations of cover and height of the lichen layer, along with topographic plot type (type: peat plateau, collapse scar, upland forest) and the regional variables of permafrost zone (pfzone) and ecoclimatic region (eco).
Table 2. Models predicting lichen biomass as developed using various combinations of cover and genus, along with topographic plot type (type: peat plateau, collapse scar, upland forest), as well as the regional variables of permafrost zone (pfzone) and ecoclimatic region (eco).
Figure 4. Models used to predict lichen biomass within the Mackenzie Valley Permanent Monitoring Plot Network. Model 6 () is shown as two components: (a) holding the lichen height constant (at the overall mean) and (b) holding the lichen cover constant (at the overall mean). Model 2 () is depicted in (c). Topographic plot types are shown for all models as collapse scars (solid line, hollow triangles), peat plateaux (dashed line, gray squares), and upland forests (doubly dashed line, black diamonds). Both models were developed with ln-transformed data but have been back-transformed to original units for ease of interpretation.
Separate genus-level models also demonstrated significant relationships between the natural log of lichen cover and the natural log of biomass, with less consistent significance detected for the topographic plot type and climatic covariates. Backward selection procedures, coupled with the comparison of AIC values, indicated that the best lichen biomass models for individual genera displayed strong relationships for Cladina, Flavocetraria, and Peltigera, with a weaker relationship found for Cladonia (, Appendix IV).
Table 3. Models predicting lichen biomass for several common genera, using cover as the only predictive variable.
Lichen biomass in the Mackenzie Valley
The significant interaction () between permafrost zone and topographic plot type for lichen biomass in 2007–2008 was largely due to differences within the upland forests and peat plateaux. Lichen biomass, as estimated using models 2 and 6, was highest in peat plateaux (mean = 502 g m−2, 95 percent confidence interval [CI] [435–577]), lowest in collapse scars (mean = 0.69 g m−2, 95 percent CI [−0.01–1.89]), and intermediate in the upland forests (mean = 54.0 g m−2, 95 percent CI [31.0–93.6]). Within each topographic feature there were no differences between the three permafrost zones. However, the slightly greater biomass in upland forests of the continuous permafrost zone (mean = 129 g m−2, 95 percent CI [56.8–290]) did not significantly differ from that of the peat plateaux in either the continuous (mean = 453 g m−2, 95 percent CI [366–562]) or sporadic discontinuous (mean = 519 g m−2, 95 percent CI [376–716]) permafrost zones ().
Figure 5. Lichen biomass in 2007–2008 modeled for the three topographic plot types (collapse scar, upland forest, and peat plateau) within the three permafrost zones: continuous (black), extensive discontinuous (light gray), and sporadic discontinuous (dark gray). Values represent least squares means with bars indicating standard error. Letters denote statistically significant groupings among means.
Table 4. ANOVA results (p value) for estimated lichen biomass in 2007–2008 and change in lichen biomass over the ten-year period.
Ten-year biomass changes
Over the ten years from 2007–2008 to 2017–2018, lichen biomass significantly declined in both peat plateaux (−75.6 ± 25.5 g m−2; mean ± SE) and upland forests (−17.5 ± 6.3 g m−2), with a slight increase seen in collapse scars that was not significantly different from zero (10.5 ± 5.9 g m−2; ). These reflect declines of 15 percent and 32 percent for peat plateaux and upland forests, respectively. This biomass change did not vary by permafrost zone, and no interaction was found between topographic plot type and permafrost zone ().
Figure 6. Change in lichen biomass from 2007–2008 to 2017–2018 for three topographic plot types (peat plateau, upland forest, and collapse scar). Values represent least squares means and error bars depict 95 percent confidence intervals. Bars with different letters had significantly different means.
Discussion
As hypothesized, lichen biomass was successfully predicted using cover of the lichen layer, and those predictions were significantly improved through inclusion of height or genus. For individual genera, best relationships were achieved with Cladina, Flavocetraria, and Peltigera. These relationships varied only slightly according to topographical or climatic gradients, particularly when both cover and height were included in the model; this indicates the widespread utility of these basic models. As anticipated, lichen biomass was greatest in the peat plateaux, lowest in the collapse scars, and intermediate in the upland forests. There was less variation than expected along latitudinal gradients, with no plot types differing significantly by permafrost zone. Despite the relatively short (ten-year) time period between sampling events, we did find significant declines in lichen biomass for both upland forest and peat plateau environments.
Lichen biomass models
One of the aims of developing these models was to provide more broadly applicable relationships than have been previously published. We believe the equations developed here to be an improvement over many others in the literature because these models reflect relationships developed over a large geographic area, across multiple habitat types, and incorporate a range of lichen species and genera. In particular, these models were developed to ensure that different allometric relationships were considered for the dramatically modified conditions occurring upon permafrost thaw within peat plateaux, a critical habitat type for boreal woodland caribou. We also believe that the suite of models developed provides valuable insights with respect to the relative usefulness of both lichen cover and lichen height as predictors of lichen biomass.
We found cover to be fundamental to the prediction of lichen biomass and the addition of height to improve this relationship. This is generally in agreement with the literature, in which multiple studies have successfully predicted lichen biomass using only cover (Dunford et al. Citation2006; McMullin et al. Citation2011) or using a combination of height and cover (Kumpula, Colpaert, and Nieminen Citation2000; Moen, Danell, and Holt Citation2007; Odland et al. Citation2014; Rosso et al. Citation2014; Greuel et al. Citation2021). In particular, Greuel et al. (Citation2021) and Rosso et al. (Citation2014) found the use of both height and cover to be a better predictor of lichen biomass than cover alone. However, different results have been obtained by several investigators due to different methodologies and site conditions. For example, Rosso et al. (Citation2014) found cover to be a worse predictor than height. Given that Rosso et al. (Citation2014) only incorporated areas of continuous (averaging ~80 percent) lichen cover, much of the variation due to cover was already eliminated from the data set. Additionally, the method used by Rosso et al. (Citation2014) to measure lichen height allowed for a value of zero to be recorded when lichen was absent at a measurement point, thus incorporating an aspect of lichen cover into the height metric (Rosso et al. Citation2014). Odland et al. (Citation2014) also found cover alone to be a poor predictor of lichen biomass, largely due to the nonlinear relationship, instead preferring to use the more linear relationships of biomass with volume or height alone. Some sites in that study were affected by heavy reindeer grazing, and the authors mentioned that relationships of biomass with cover were particularly poor in these areas where high cover values were commonly associated with low lichen heights (Odland et al. Citation2014). In contrast, Dunford et al. (Citation2006) and McMullin et al. (Citation2011) were able to successfully model lichen biomass from cover alone in treed bogs of Alberta and coniferous forests of Ontario, respectively, where caribou grazing pressure is low. We feel that our independent estimation of cover and height, coupled with the broad range of cover values used within the mixed species communities represented in our data set, resulted in more robust relationships that could be widely applicable across boreal and subarctic forest and peatland environments.
In this study, despite sampling 200 clip plots across three distinct vegetative communities (upland forests, peat plateaux, and collapse scars), for an ecoclimatic gradient from mid-boreal through to high subarctic, and representing three of the four possible permafrost zones, we only had sufficient data to develop genus-specific models for four genera: Cladina, Cladonia, Flavocetraria, and Peltigera. The optimal model varied by both genus and topographic plot type but not by ecoclimatic or permafrost gradients. Only when Cladonia species were considered alone was ecoclimatic region a significant predictor. This is consistent with Greuel et al. (Citation2021), who did find an interaction between ecoprovince and lichen area or volume for some Cladina and Cladonia species groups but not when all species were combined. Although Cladina and Cladonia species are those most commonly included in studies modeling lichen biomass (Kumpula, Colpaert, and Nieminen Citation2000; Dunford et al. Citation2006; Moen, Danell, and Holt Citation2007; McMullin et al. Citation2011; Rosso et al. Citation2014; Greuel et al. Citation2021) and are the most common ground lichen species identified in the diet of woodland caribou (Thomas, Edmonds, and Brown Citation1996; Johnson, Parker, and Heard Citation2001; Thompson et al. Citation2015), other genera may be important locally, such as Thamnolina (Johnson, Parker, and Heard Citation2001), Flavocetraria (Johnson, Parker, and Heard Citation2001; Odland et al. Citation2014), Cetraria (Thomas, Edmonds, and Brown Citation1996; Johnson, Parker, and Heard Citation2001; Moen, Danell, and Holt Citation2007; Rosso et al. Citation2014), Stereocaulon (Johnson, Parker, and Heard Citation2001), Peltigera (Thomas, Edmonds, and Brown Citation1996), Alectoria (Rosso et al. Citation2014), and Bryocaulon (Rosso et al. Citation2014). Additionally, of the four genera included in this study, reasonable models (marginal R2 > 0.77) were only able to be developed for three of them: Cladina, Flavocetraria, and Peltigera. The Cladonia model performed poorly, in comparison; this highlights problems with using a genus comprised of diverse growth forms. Even in the strict sense (Ahti Citation1984), Cladonia species range from the more branched, fruticose species such as C. uncialis and C. amaurocraea to the simpler cupping forms of C. gracilis subsp. turbinata or C. sulphurina and, in some areas, simply consist of foliose basal squamules. Because of these limitations, various authors have simplified lichen biomass models to single species relationships (Dunford et al. Citation2006; Moen, Danell, and Holt Citation2007; McMullin et al. Citation2011) or used species groupings; for instance, including the fruticose Cladonia uncialis with species of Cladina (Kumpula, Colpaert, and Nieminen Citation2000), considering Cladina stellaris separately from other fruticose species of Cladina/Cladonia (Rosso et al. Citation2014), or only pooling species with very similar growth forms such as C. rangiferina with C. stygia and Cladina mitis with C. arbuscula (Greuel et al. Citation2021). We recommend the use of models incorporating both cover and height, where data are available. However, use of genus-level models could be valuable if height data are not available or when there is particular interest in certain genera, such as Cladina species important for caribou forage (i.e., Thompson et al. Citation2015).
Although we were not able to directly compare models incorporating height with those containing genus, because we lacked genus-level height measurements, we consider height to be a better predictor than genus for several reasons. Firstly, there was less variability, in terms of AIC, among the suite of models incorporating both cover and height than was present for the set of models based on cover and genus. This indicates that there was less variation in lichen biomass remaining after both cover and height were included that was then able to be accounted for by environmental (regional or site type) variables. In contrast, when biomass was predicted using cover and genus, more variability was present that could be explained by these regional and site factors. Secondly, height is a continuous variable, and though prediction of biomass outside the range of sampled heights could be a problem, this is much less likely to be an issue than that associated with poor representation or low sample size of less common genera. It is likely that height is one of the major factors differentiating lichen genera and that there is some redundancy in these variables; however, it is also likely that other factors, such as differing growth structures and densities, would result in the addition of genus improving models that already incorporate height and cover. Unfortunately, a different sampling design would be required to develop a data set on which this could be tested.
Where height data and cover by genus information are lacking, cover alone may be used to predict lichen biomass, particularly when stratified by plot type and where caribou grazing pressure is low. We believe the relationships developed for peat plateaux and collapse scars may be applicable to these habitat types across a large area of continental western Canada, and perhaps beyond. We do recognize, however, that the upland forests in our study were predominantly low-productivity environments, commonly dominated by black spruce (Picea mariana; Errington, Bhatti, and Li Citation2020), and thus they do not fully represent the range of boreal and subarctic forest environments. Though we still expect that these cover–biomass relationships would provide a coarse estimate of lichen biomass in other forest environments, for more precise estimation we recommend the use of height data or development of local or forest type–specific relationships. Incorporating regional-scale variables (i.e., ecoclimatic region or permafrost zone) offered negligible improvements to the cover models, as well as those incorporating either genus or height, indicating that these relationships are likely to be robust across the boreal and subarctic forest regions and the associated range of permafrost zones. Similar results were found by Greuel et al. (Citation2021), who determined that lichen biomass allometric relationships (for pooled species) did not vary by ecoprovince in western Canada. These robust biomass relationships across climatic gradients indicate that climate conditions have minimal influence on the developed biomass relationships and imply that changing climate conditions are unlikely to strongly influence these relationships unless climate conditions shift dramatically outside the range in which they were developed. As such, our use of relationships developed from 2007–2008 data can be reasonably expected to be reliable when used to predict biomass in 2017–2018.
Lichen biomass on the landscape
Values of lichen biomass modeled in this study lie well within the ranges reported in the literature for forests, tundra, and peatlands. Although we could find no studies that specifically measured lichen biomass on peat plateau environments, the mean lichen biomass we recorded for peat plateaux (502 g m−2) was quite comparable to that found in southern Norway where lichen biomass ranged from 154 g m−2 to 802 g m−2 in various ungrazed tundra environments (Odland et al. Citation2014). Lichen biomass for peat plateaux was also comparable to the low end of the range for northwestern Alaska where Rosso et al. (Citation2014) reported lichen biomass values ranging from 435 ± 88 g m−2 to 1,509 ± 113 g m−2 (mean ± SE) for various tundra types having more than 80 percent lichen cover. Mature, poorly drained spruce stands in the NWT and northern Saskatchewan, which likely incorporated a mix of peat pleataux along with low productivity upland forests, were found to have a comparable lichen biomass of 260 g m−2 (Greuel et al. Citation2021). The lichen biomass reported for peatlands of northeastern Alberta of 66 ± 6 g m−2 (mean ± SE; Dunford et al. Citation2006) was considerably lower than that found in our peat plateau environments and was comparable with upland forests of our study where we found a mean lichen biomass of 54 g m−2 (CI [31 to 94]).
The range of lichen biomass reported within forested environments is highly variable, with some of the highest values of lichen biomass reported from Scots pine (Pinus sylvestris)–lichen forests of northern Finland and Russia (790 ± 130 g m−2 [mean ± SE]; Väre, Ohtonen, and Mikkola Citation1996; Kumpula, Colpaert, and Nieminen Citation2000) and mature jack pine (Pinus banksiana) and black spruce forests of Ontario (700 g m−2, 850 ± 66 g m−2 [mean ± SD]; McMullin et al. Citation2011) and northern Quebec (801 ± 104 g m−2 [mean ± SE]; Arseneault et al. Citation1997). These values far exceed those we recorded for both upland forests and peat plateaux of the Mackenzie Valley. Given that we did not specifically select our sites to be high in lichen, as is commonly the bias for studies examining lichen biomass, it would not be surprising for our lichen biomass values to lie toward the lower end of expected biomass ranges. However, much lower levels of lichen biomass have also been reported in continental western Canada, with areas identified as feeding habitats for woodland caribou having lichen biomass values ranging from approximately 236 to 549 g m−2 (Miller Citation1976; Edmonds and Bloomfield Citation1984) and random forest environments having lichen biomass values ranging from 87 to 99 g m−2 (Scotter Citation1965; Edmonds and Bloomfield Citation1984). In Alaska, comparable values have also been reported within winter ranges of the migratory caribou herds, with values of 301 and 105 g m−2 for sites used by caribou and a range of 26 to 87 g m−2 for random sites in the area (Joly, Chapin, and Klein Citation2010; Collins et al. Citation2011). These western Canadian and Alaskan values are much more in line with our values for peat plateaux (caribou-selected sites) and upland forests (random forest sites). Given the overlap of our sampling sites with known caribou ranges, it is safe to assume that the lichen present within our study was periodically foraged by boreal woodland caribou, thus representing a realistic biomass within a natural ecosystem. Because boreal woodland caribou live in small, well-dispersed groups rather than large herds, we do not expect the substantial declines in lichen abundance that have been associated with high grazing pressures of reindeer and barren-ground caribou (Väre, Ohtonen, and Mikkola Citation1996; Joly, Jandt, and Klein Citation2009; Bernes et al. Citation2015; Sundqvist et al. Citation2019).
The large and significant differences of lichen biomass between collapse scars, peat plateaux, and upland forests but general invariability among permafrost zones indicates consistency between regions for lichen biomass based on topographic feature. Therefore, measurements of lichen biomass per area from a peat plateau in the mid-boreal can be considered to provide reasonable estimates of lichen biomass for a peat plateau in the high subarctic. However, additional caution should be applied to extrapolation of upland forest values, because most of the upland forest sites sampled in this study were mature, low-productivity black spruce forests (Errington, Bhatti, and Li Citation2020); thus, these results do not necessarily apply to a wider range of forest types and stand ages.
Lichen biomass change over time
Our results suggest there was a decline in lichen biomass over a ten-year period, particularly in peat plateaux, where mean lichen biomass decreased from 502 g m−2 to 427 g m−2. Though we expect warming climates to reduce lichen biomass on the landscape by accelerating the process of permafrost thaw and increasing the area of lichen-poor collapse scar features (Beilman and Robinson Citation2003; Camill Citation2005; Tarnocai Citation2009; Quinton, Hayashi, and Chasmer Citation2011; Baltzer et al. Citation2014; Gibson et al. Citation2021), the decline in lichen biomass we detected was not due to this dramatic transition from peat plateau to collapse scar. This observed decline in lichen biomass may indicate a gradual change across the landscape resulting from more subtle ecological processes, such as competition from vascular plant components that may have increased in response to factors such as warmer summer temperatures, deepening active layers, and increased nutrient cycling (e.g., Mekonnen et al. Citation2021). This is in accordance with several studies of sensitive tundra environments that have shown lichen abundance declining as vascular plant cover increases in association with warmer climate conditions (Cornelissen et al. Citation2001; Lang et al. Citation2012; Fraser et al. Citation2014). Though we plan to more fully explore this relationship between the vascular plant and lichen communities in separate publications, the three genera comprising 94 percent of the biomass in our clip plot data set (Cladina, Cladonia, and Flavocetraria) can be considered as stress tolerators (Grime Citation1977) thriving in high-light, surficially dry, nutritionally poor environments (Ahti and Oksanen Citation1990; Crittenden Citation2000; Payette and Delwaide Citation2018) and can be expected to be outcompeted by a more dense forest canopy or by a more lush understory of vascular plants (Kershaw Citation1977; Crittenden Citation2000).
Two mechanisms appear immediately evident as potential causes of the abovementioned declines in lichen biomass over time: autogenic successional processes as the stands age or allogenic processes resulting from warming climate conditions. Lichen cover and biomass have been seen to decline as stands age, with this decline generally associated with stands greater than 130 to 150 years old (Maikawa and Kershaw Citation1976; Coxson and Marsh Citation2001), although Carroll and Bliss (Citation1982) did detect this trend beginning at an age of 90 years in lowland environments. However, this tendency toward lichen decline is associated with closure of the tree canopy and in many regions, open canopy spruce–lichen stands have been seen to persist with high or increasing lichen cover for more than 200 years following disturbance (Morneau and Payette Citation1989; Zouaoui et al. Citation2014). Though our upland forest stands had a mean breast height age of 129 and might have been influenced by succession toward a closed canopy–feather moss system (Carroll and Bliss Citation1982; Coxson and Marsh Citation2001), we feel this is unlikely in the peat plateau environments that have a younger average age (92 years at breast height in the boreal regions) or very open canopy environments in the few older, subarctic stands (Errington, Bhatti, and Li Citation2020). As such, we feel that the lichen biomass decline we observed is much more likely to reflect allogenic processes, particularly in peat plateau environments. We, thus, interpret this decline to reflect processes similar to those seen in tundra areas where factors such as warmer air and soil temperatures (Cornelissen et al. Citation2001; Lang et al. Citation2012; Berner et al. Citation2020), increased growing season length, active layer depth, and increased soil microbial activity (Sturm et al. Citation2005) favor vascular plant growth.
This gradual decline of lichen biomass in peat plateaux and upland forests must also be considered alongside the rapidly deteriorating permafrost-affected peatland complexes in the southern NWT. Recent mapping by Gibson et al. (Citation2021) indicated that 50 percent to 60 percent (median) of these peatland complexes in the more southerly regions of the NWT had already thawed. Though this proportion is much lower (<20 percent) in the central Mackenzie Valley, substantial lichen biomass is being lost from the NWT landscape as the lichen-rich peat plateau environments transition to the lichen-poor collapse scar features. An increase in fire frequency and severity is likely to exacerbate this issue by accelerating the collapse of peat plateau permafrost (Gibson et al. Citation2018) and, because lichen biomass is greatest in older stands (Greuel et al. Citation2021), a transition to forests with a younger age class structure and fewer peat plateau environments will result in a landscape with lower lichen biomass.
Summary and conclusions
In conclusion, this study addresses a fundamental need for the estimation of lichen biomass in boreal and subarctic forests and peatlands, critical habitats of the boreal woodland caribou. We successfully developed a series of models for the prediction of lichen biomass from the simple, and easily collected, data of percent cover and height of the ground lichen layer. To enable widespread prediction of lichen biomass using preexisting data sets that may not have been originally collected for the purposes of lichen biomass estimation, we also developed models that did not require measurements of lichen height. These reduced relationships allow for the estimation of lichen biomass from data sets with only genus-level cover data or simply total lichen cover. Relationships varied only slightly according to topographical or climatic gradients, particularly when both cover and depth were included, indicating a widespread utility of these basic models.
Greatest lichen biomass was found in peat plateau environments, where values were generally lower than those recorded for lichen-dominated arctic tundra environments but were comparable to sites identified as feeding habitats for boreal woodland caribou in continental western Canada. Although we cannot claim to have sampled all upland forest types found in the region, even in the more northerly forest sites, where tree canopies are more open (Errington, Bhatti, and Li Citation2020), lichen biomass was substantially less than that found in peat plateaux.
Declines in lichen biomass that were detected in the upland forest and peat plateau environments indicate that even over a period of ten years, gradual environmental changes may have a negative effect on lichen biomass, likely via climate warming-induced shifts in the plant community. On a landscape level, this gradual decline is compounded by a more dramatic loss in lichen biomass as permafrost thaw, and subsequent collapse, shifts the lichen-rich peat plateau communities to lichen-poor collapse scar environments. Given the possibility of lagged responses to warming climate conditions (Camill and Clark Citation2000; Vanderwel and Purves Citation2014), observed changes could become more pronounced as ecosystems continue to equilibrate to the new reality of a warmer climate. Future work will investigate more detailed mechanisms of this biomass decline and its relationship to the vascular plant and bryophyte communities.
Supplemental Material
Download Zip (64.9 KB)Acknowledgments
Many people contributed to the success of this project, and we would like to thank Martin Callaghan, Jules Fournel, Steve Gooderham, Mike Gravel, Tom Lakusta, Jakub Olesinski, and Paul Rivard of the Forest Management Division, Government of the Northwest Territories for helping to coordinate field logistics and financial support. We would also like to acknowledge the valuable field and laboratory assistance of Alyssa Bergeron, George Brunin, Isaac Lennie, Edith Li, Claire Marchildon, Valerie Mucciarelli, Kelby Ogryzlo, Michelle Riopel, Nancey Stevens-Whiteman, and Peter Sugawara.
Disclosure statement
No potential conflict of interest was reported by the authors.
Supplementary material
Supplemental material for this article can be accessed on the publisher’s website.
Additional information
Funding
References
- Ahti, T. 1984. The status of Cladina as a genus segregated from Cladonia. Nova Hedwigia 79:25–61.
- Ahti, T., and J. Oksanen. 1990. Epigeic lichen communities of taiga and tundra regions. Vegetatio 86 (1):37–70.
- Ahti, T., and P. T. DePriest. 2001. New combinations of Cladina epithets in Cladonia (Ascomycotina: Cladoniaceae). Mycotaxon 78:499–502.
- Arseneault, D., N. Villeneuve, C. Boismenu, Y. Leblanc, and J. Deshaye. 1997. Estimating lichen biomass and caribou grazing on the wintering grounds of northern Quebec: An application of fire history and landsat data. Journal of Applied Ecology 34 (1):65–78. doi:10.2307/2404848.
- Baltzer, J. L., T. Veness, L. E. Chasmer, A. E. Sniderhan, and W. L. Quinton. 2014. Forests on thawing permafrost: Fragmentation, edge effects, and net forest loss. Global Change Biology 20 (3):824–34. doi:10.1111/gcb.12349.
- Beckingham, J. D., and J. H. Archibald. 1996. Field guide to ecosites of Northern Alberta. Natural Resources Canada, Canadian Forest Service, Special Report 5, Northern Forestry Centre, Edmonton, Alberta.
- Beilman, D. W., and S. D. Robinson. 2003. Peatland permafrost thaw and landform type along a climatic gradient. Proceedings of the 8th International Conference on Permafrost, Zurich, Balkema Publishers, Vol. 1, p. 61–65.
- Berner, L. T., R. Massey, P. Jantz, B. C. Forbes, M. Macias-Fauria, I. Myers-Smith, T. Kumpula, G. Gauthier, L. Andreu-Hayles, B. V. Gaglioti, et al. 2020. Summer warming explains widespread but not uniform greening in the Arctic tundra biome. Nature Communications 11 (1):4621. doi:10.1038/s41467-020-18479-5.
- Bernes, C., K. A. Bråthen, B. C. Forbes, J. D. M. Speed, and J. Moen. 2015. What are the impacts of reindeer/caribou (Rangifer tarandus L.) on Arctic and alpine vegetation? A systematic review. Environmental Evidence 4 (1):4. doi:10.1186/s13750-01-4-0030-3.
- Bjorkman, A. D., I. H. Myers-Smith, S. C. Elmendorf, S. Normand, N. Ruger, P. S. A. Beck, A. Blach-Overgaard, D. Blok, J. H. C. Cornelissen, B. C. Forbes, et al. 2018. Plant functional trait change across a warming tundra biome. Nature 562 (7725):57–62. doi:10.1038/s41586-018-0563-7.
- Bjorkman, A. D., M. G. Criado, I. H. Myers-Smith, V. Ravolainen, I. S. Jónsdóttir, K. B. Westergaard, J. P. Lawler, M. Aronsson, B. Bennett, H. Gardfjell, et al. 2020. Status and trends in Arctic vegetation: Evidence from experimental warming and long-term monitoring. Ambio 49 (3):678–92. doi:10.1007/s13280-019-01161-6.
- Bradshaw, C. J. A., S. Boutin, D. M. Hebert, and A. B. Rippin. 1995. Winter peatland habitat selection by woodland caribou in northeastern Alberta. Canadian Journal of Zoology 73 (8):1567–74. doi:10.1139/z95-185.
- Burnham, K. P., and D. R. Anderson. 2004. Multimodel inference: Understanding AIC and BIC in model selection. Sociological Methods & Research 33 (2):261–304. doi:10.1177/0049124104268644.
- Camill, P., and J. S. Clark. 2000. Long-term perspectives on lagged ecosystem responses to climate change: Permafrost in boreal peatlands and the grassland/woodland boundary. Ecosystems 3 (6):534–44. doi:10.1007/s100210000047.
- Camill, P. 2005. Permafrost thaw accelerates in boreal peatlands during late-20th century climate warming. Climatic Change 68 (1–2):135–52. doi:10.1007/s10584-005-4785-y.
- Carroll, S. B., and L. C. Bliss. 1982. Jack pine – Lichen woodland on sandy soils in northern Saskatchewan and northeastern Alberta. Canadian Journal of Botany 60 (11):2270–82. doi:10.1139/b82-278.
- Collins, W. B., B. W. Dale, L. G. Adams, D. E. McElwain, and K. Joly. 2011. Fire, grazing history, lichen abundance, and winter distribution of caribou in Alaska’s taiga. The Journal of Wildlife Management 75 (2):369–77. doi:10.1002/jwmg.39.
- Conference of Management Authorities. 2017. Recovery strategy for the boreal caribou (Rangifer tarandus caribou) in the Northwest Territories. Species at Risk (NWT) Act Management Plan and Recovery Strategy Series. Environment and Natural Resources, Government of the Northwest Territories, Yellowknife, NT. 57.
- Cornelissen, J. H. C., T. V. Callaghan, J. M. Alatalo, A. Michelsen, E. Graglia, A. E. Hartley, D. S. Hik, S. E. Hobbie, M. C. Pres, C. H. Robinson, et al. 2001. Global change and Arctic ecosystems: Is lichen decline a function of increases in vascular plant biomass? Journal of Ecology 89 (6):984–94. doi:10.1111/j.1365-2745.2001.00625.x.
- Coxson, D. S., and J. Marsh. 2001. Lichen chronosequences (postfire and postharvest) in lodgepole pine (Pinus contorta) forests of northern interior British Columbia. Canadian Journal of Botany 79 (12):1449–64. doi:10.1139/b01-127.
- Crittenden, P. D. 2000. Aspects of the ecology of mat-forming lichens. Rangifer 20 (2–3):127–39. doi:10.7557/2.20.2-3.1508.
- Dunford, J. S., P. D. McLoughlin, F. Dalerum, and S. Boutin. 2006. Lichen abundance in the peatlands of northern Alberta: Implications for boreal caribou. Ecoscience 13 (4):469–74. doi:10.2980/1195-6860(2006)13[469:LAITPO]2.0.CO;2.
- Ecological Stratification Working Group (Canada), Center for Land, Biological Resources Research (Canada), & Canada. State of the Environment Directorate. 1996. A national ecological framework for Canada. Centre for Land and Biological Resources Research; Hull, Quebec: State of the Environment Directorate.
- Ecosystem Classification Group. 2007. Ecological regions of the Northwest Territories – Taiga Plains. Dep. Environ. Nat. Resour., Gov. Northwest Territ., Yellowknife, NT. 173 p. plus map. https://www.enr.gov.nt.ca/en
- Ecosystem Classification Group. 2008. Ecological regions of the Northwest Territories – Taiga Shield. Dep. Environ. Nat. Resour., Gov. Northwest Territ., Yellowknife, NT. 146 p. plus map. https://www.enr.gov.nt.ca/en
- Ecosystem Classification Group. 2010. Ecological regions of the Northwest Territories – Cordillera. Dep. Environ. Nat. Resour., Gov. Northwest Territ., Yellowknife, NT. 245 p. plus map. https://www.enr.gov.nt.ca/en
- Edmonds, E., and M. Bloomfield. 1984. A study of woodland caribou (Rangifer tarandus caribou) in west-central Alberta, 1979–1983. Report AFW-84-045. Edmonton, Alberta: Alberta Energy and Natural Resources Fish andWildlife Division.
- Elmendorf, S. C., G. H. R. Henry, R. D. Hollister, R. G. Björk, N. Boulanger-Lapointe, E. J. Cooper, J. H. C. Cornelissen, T. A. Day, E. Dorrepaal, T. G. Elumeeva, et al. 2012. Plot-scale evidence of tundra vegetation change and links to recent summer warming. Nature Climate Change 2 (6):453–57. doi:10.1038/NCLIMATE1465.
- Environment and Climate Change Canada. 2017. Action Plan for the Woodland Caribou (Rangifer tarandus caribou), Boreal Population, in Canada - Federal Actions [Proposed]. Species at Risk Act Action Plan Series. Environment and Climate Change Canada, Ottawa. vii + 24pp.
- Environment Canada. 2002. Canadian climate normals 1971–2000 [online]. Meteorological Service of Canada. [Accessed December 3, 2008] https://climat.meteo.gc.ca/climate_normals/results_e.html?searchType=stnProv&lstProvince=NB&txtCentralLatMin=0&txtCentralLatSec=0&txtCentralLongMin=0&txtCentralLongSec=0&stnID=6250&dispBack=0&
- Environment Canada. 2012. Recovery strategy for the woodland caribou (Rangifer tarandus caribou), Boreal population, in Canada. Species at Risk Act Recovery Strategy Series. Environment Canada, Ottawa. Xi +, 138.
- Errington, R. C., J. S. Bhatti, and E. H. Y. Li. 2018. Mackenzie Valley Permanent Monitoring Plot Network: Site locations and descriptions. Natural Resources Canada, Canadian Forest Service, AB Information Report NOR-X-426. Edmonton: Northern Forestry Centre. 92 pp.
- Errington, R. C., J. S. Bhatti, and E. H. Y. Li. 2020. Mackenzie Valley Permanent Monitoring Plot Network: A database of stand characteristics. Natural Resources Canada, Canadian Forest Service, AB Information Report NOR-X-428. Edmonton: Northern Forestry Centre. 181 pp.
- Esslinger, T. L. 2019. A cumulative checklist for the lichen-forming, lichenicolous and allied fungi of the continental United States and Canada, Version 23. Opuscula Philolichenum 18:102–378.
- Fox, J., and S. Weisberg. 2011. An R Companion to applied regression. Second ed. Thousand Oaks, CA: Sage.
- Fox, J., and S. Weisberg. 2019. An {R} Companion to applied regression. Third ed. Thousand Oaks, CA:Sage. https://socialsciences.mcmaster.ca/jfox/Books/Companion/.
- Fraser, R. H., T. C. Lantz, I. Olthof, S. V. Kokelj, and R. A. Sims. 2014. Warming-induced shrub expansion and lichen decline in the Western Canadian Arctic. Ecosystems 17 (7):1151–68. doi:10.1007/s10021-014-9783-3.
- Gibson, C. M., L. E. Chasmer, D. K. Thompson, W. L. Quinton, M. D. Flannigan, and D. Olefeldt. 2018. Wildfire as a major driver of recent permafrost thaw in boreal peatlands. Nature Communications 9 (1):3041. doi:10.1038/s41467-018-05457-1.
- Gibson, C., K. Cottenie, T. Gingras-Hill, S. V. Kokelj, J. L. Baltzer, L. Chasmer, and M. R. Turetsky. 2021. Mapping and understanding the vulnerability of northern peatlands to permafrost thaw at scales relevant to community adaptation planning. Environmental Research Letters 16 (5):055022. doi:10.1088/1748-9326/abe74b.
- Greuel, R. J., G. É. Degré‐Timmons, J. L. Baltzer, J. F. Johnstone, E. J. B. McIntire, N. J. Day, S. J. Hart, P. D. McLoughlin, F. K. A. Schmiegelow, M. R. Turetsky, et al. 2021. Predicting patterns of terrestrial lichen biomass recovery following boreal wildfires. Ecosphere 12 (4):e03481. doi:10.1002/ecs2.3481.
- Grime, J. P. 1977. Evidence for the existence of three primary strategies in plants and its relevance to ecological and evolutionary theory. The American Naturalist 111 (982):1169–94. doi:10.1086/283244.
- Harris, L. I., T. R. Moore, N. T. Roulet, A. J. Pinsonneault, and J. Lee. 2018. Lichens: A limit to peat growth? Journal of Ecology 106 (6):2301–19. doi:10.1111/1365-2745.12975.
- Heginbottom, J. A., M.-A. Dubreuil, and P. A. Parker. 1995. Canada – Permafrost. Plate 2.1 in National atlas of Canada, 5th Ed. Natural Resources Canada, Ottawa, ON. (MCR 4177; scale1: 7 500 000).
- Intergovernmental Panel on Climate Change [IPCC]. 2013. Climate Change 2013: The Physical Science Basis [online]. In Working Group I Contribution to the Fifth Assessment Report of the Intergovernmental Panel on Climate Change, edited by T.F. Stocker, D. Qin, G.K. Plattner, M.M.B. Tignor, S.K. Allen, J.Qin, G.K. Plattner, M.M.B. Tignor, S.K. Allen, J. Boschung, A. Nauels, Y. Xia, V. Bex, and P.M. Midgley. Cambridge University Press: New York, 1585 pp. http://www.ipcc.ch/report/ar5/wg1/
- Johnson, E. A. 1981. Vegetation organization and dynamics of lichen woodland communities in the Northwest Territories, Canada. Ecology 62 (1):200–15. doi:10.2307/1936682.
- Johnson, C. J., K. L. Parker, and D. C. Heard. 2001. Foraging across a variable landscape: Behavioral decisions made by woodland caribou at multiple spatial scales. Oecologia 127 (4):590–602. doi:10.1007/s004420000573.
- Joly, K., R. R. Jandt, and D. R. Klein. 2009. Decrease of lichens in Arctic ecosystems: The role of wildfire, caribou, reindeer, competition and climate in north-western Alaska. Polar Research 28 (3):433–42. doi:10.1111/j.1751-8369.2009.00113.x.
- Joly, K., F. S. Chapin III, and D. R. Klein. 2010. Winter habitat selection by caribou in relation to lichen abundance, wildfires, grazing, and landscape characteristics in northwest Alaska. Écoscience 17 (3):321–33. doi:10.2980/17-3-3337.
- Jun, R., B. Clément, F. Rozè. 2004. Primary succession of bryophyte and lichen communities in non-forested Atlantic coastal dunes: The example of the Pointe d’Arcay (France). Nova Hedwigia 78 (3–4):453–68. doi:10.1127/0029-5035/2004/0078-0453.
- Kauppi, M., and P. Halonen. 1992. Lichens as indicators of air pollution in Oulu, northern Finland. Annales Botanici Fennici 29 (1):1–9.
- Keim, J. L., P. D. DeWitt, J. J. Fitzpatrick, and N. S. Jenni. 2017. Estimating plant abundance using inflated beta distributions: Applied learnings from a lichen-caribou ecosystem. Ecology and Evolution 7 (2):486–93. doi:10.1002/ece3.2625.
- Kershaw, K. A. 1977. Studies on lichen-dominated systems. XX. An examination of some aspects of the northern boreal lichen woodlands in Canada. Canadian Journal of Botany 55 (4):393–410. doi:10.1139/b77-050.
- Kettles, I. M., and C. Tarnocai. 1999. Development of a model for estimating the sensitivity of Canadian peatlands to climate warning. Géographie physique et Quaternaire 53 (3):323–38. doi:10.7202/004838ar.
- Kumpula, J., A. Colpaert, and M. Nieminen. 2000. Condition, potential recovery rate, and productivity of lichen (Cladonia spp.) ranges in the Finnish reindeer management area. Arctic 53 (2):152–60. doi:10.14430/arctic845.
- Lang, S. I., J. H. C. Cornelissen, G. R. Shaver, M. Ahrens, T. V. Callaghan, U. Molau, C. J. F. Ter Braak, A. Hölzer, and R. Aerts. 2012. Arctic warming on two continents has consistent negative effects on lichen diversity and mixed effects on bryophyte diversity. Global Change Biology 18 (3):1096–107. doi:10.1111/j.1365-2486.2011.02570.x.
- Lenth, R. 2019. emmeans: Estimated Marginal Means, aka Least-Squares Means. R package version 1.3.5.1. https://CRAN.R-project.org/package=emmeans.
- Lesmerises, R., J.-P. Ouellet, and M.-H. St-Laurent. 2011. Assessing terrestrial lichen biomass using ecoforest maps: A suitable approach to plan conservation areas for forest-dwelling caribou. Canadian Journal of Forest Research. 41 (3):632–42. doi:10.1139/X10-229.
- Loranty, M. M., L. T. Berner, E. D. Taber, H. Kropp, S. M. Natali, H. D. Alexander, S. P. Davydov, N. S. Zimov, and R. Rinnan. 2018. Understory vegetation mediates permafrost active layer dynamics and carbon dioxide fluxes in open-canopy larch forests of northeastern Siberia. PLoS ONE 13 (3):e0194014. doi:10.1371/journal.pone.0194014.
- Maikawa, E., and K. A. Kershaw. 1976. Studies on lichen-dominated systems. XIX. The postfire recovery sequence of black spruce – lichen woodland in the Abitau Lake Region, N.W.T. Canadian Journal of Botany 54 (23):2679–87. doi:10.1139/b76-288.
- McMullin, R. T., I. D. Thompson, B. W. Lacey, and S. G. Newmaster. 2011. Estimating the biomass of woodland caribou forage lichens. Canadian Journal of Forest Research 41 (10):1961–69. doi:10.1139/X11-108.
- Mekonnen, Z. A., W. J. Riley, L. T. Berner, N. J. Bouskill, M. S. Torn, G. Iwahana, A. L. Breen, I. H. Myers-Smith, M. Garcia Crado, Y. Liu, et al. 2021. Arctic tundra shrubification: A review of mechanisms and impacts on ecosystem carbon balance. Environmental Research Letters 16:053001. doi:10.1088/1748-9326/abf28b.
- Milberg, P., J. Bergstedt, J. Fridman, G. Odell, and L. Westerberg. 2008. Observer bias and random variation in vegetation monitoring data. Journal of Vegetation Science 19 (5):633–344. doi:10.3170/2008-8-18423.
- Miller, D. R. 1976. Wildfire and caribou on the taiga ecosystem of north-central Canada. PhD Thesis, University of Idaho, Moscow.
- Moen, J., Ö. Danell, and R. Holt. 2007. Non-destructive estimation of lichen biomass. Rangifer 27 (1):41–46.
- Morneau, C., and S. Payette. 1989. Postfire lichen–spruce woodland recovery at the limit of the boreal forest in northern Quebec. Canadian Journal of Botany 67 (9):2770–82. doi:10.1139/b89-357.
- Nagelkerke, N. J. D. 1991. A note on a general definition of the coefficient of determination. Biometrika 78 (3):691–92. doi:10.1093/biomet/78.3.691.
- Nascimbene, J., H. Mayrhofer, M. Dainese, and P. O. Bilovitz. 2017. Assembly patterns of soil-dwelling lichens after glacier retreat in the European Alps. Journal of Biogeography 44 (6):1393–404. doi:10.1111/jbi.12970.
- National Academy of Sciences. 2014. Climate change: Evidence and causes. Washington, DC: The National Academies Press. doi:10.17226/18730.
- Nelson, P. R., C. Roland, M. J. Macander, and B. McCune. 2013. Detecting continuous lichen abundance for mapping winter caribou forage at landscape spatial scales. Remote Sensing of Environment 137:43–54. doi:10.1016/j.rse.2013.05.026.
- Odland, A., S. M. Sandvik, D. K. Bjerketvedt, and L. L. Myrvold. 2014. Estimation of lichen biomass with emphasis on reindeer winter pastures at Hardangervidda, S Norway. Rangifer 34 (1):95–110. doi:10.7557/2.34.1.2852.
- Payette, S., and A. Delwaide. 2018. Tamm review: The North-American lichen woodland. Forest Ecology and Management 417:167–83. doi:10.1016/j.foreco.2018.02.043.
- Piercey-Normore, M. D. 2010. Lichens from the Hudson Bay Lowlands: Northwestern interior treeline peatlands of Wapusk National Park in Manitoba. Botany 88 (10):923–29. doi:10.1139/B10-059.
- Pinheiro, J., D. Bates, S. DebRoy, and D. Sarkar. 2021. nlme: Linear and Nonlinear Mixed Effects Models. Version 3.1–152. https://CRAN.R-project.org/package=nlme
- Plitt, C. C. 1927. Succession in lichens. The Bryologist 30 (1):1–4. doi:10.1639/0007-2745(1927)30[1:SIL]2.0.CO;2.
- Plummer, D. A., D. Caya, A. Frigon, H. Côté, M. Giguère, D. Paquin, S. Biner, R. Harvey, and R. de Elia. 2006. Climate and climate change over North America as simulated by the Canadian RCM. Journal of Climate 19 (13):3112–32. doi:10.1175/JCLI3769.1.
- Pouliot, D., R. Latifovic, and I. Olthof. 2009. Trends in vegetation NDVI from 1 km AVHRR data over Canada for the period 1985–2006. International Journal of Remote Sensing 30 (1):149–68. doi:10.1080/01431160802302090.
- Price, D. T., D. W. McKenney, L. A. Joyce, R. M. Siltanen, P. Papadopol, and K. Lawrence. 2011. High resolution interpolation of IPCC AR4 GCM climate scenarios for Canada. Natural Resources Canada, Canadian Forest Service, Northern Forestry Centre. Information Report NOR-X-421.
- Quinton, W. L., M. Hayashi, and L. E. Chasmer. 2011. Permafrost-thaw-induced land-cover change in the Canadian subarctic: Implications for water resources. Hydrological Processes 25 (1):152–58. doi:10.1002/hyp.7894.
- Quinton, W. L., and J. L. Baltzer. 2013. The active-layer hydrology of a peat plateau with thawing permafrost (Scotty Creek, Canada). Hydrogeology Journal 21 (1):201–20. doi:10.1007/s10040-012-0935-2.
- R Core Team. 2019. R: A language and environment for statistical computing. Vienna, Austria: R Foundation for Statistical Computing. https://www.R-project.org/.
- Richardson, D. H. S. 1975. The vanishing lichens; their history, biology and importance, 231. West Vancouver, B.C.: Douglas David & Charles Limited.
- Robinson, S. D., and T. R. Moore. 2000. The influence of permafrost and fire upon carbon accumulation in High Boreal peatlands, Northwest Territories, Canada. Arctic, Antarctic, and Alpine Research 32 (2):155–66. doi:10.1080/15230430.2000.12003351.
- Robinson, S. D. 2002. Peatlands of the Mackenzie Valley: Permafrost, fire, and carbon accumulation. Pages 21-24 in Z.C. Yu, J.S. Bhatti, and M.J. Apps, technical coordinators. Long-term dynamics and contemporary carbon budget of northern peatlands. Proceedings of the international workshop on carbon dynamics of forested peatlands: Knowledge gaps, uncertainty, and modeling approaches, 23-24 March 2001, Edmonton, AB: Natural Resources Canada, Canadian Forestry Service, Northern Forestry Centre, Edmonton, AB. Information Report NOR-X-383.
- Rosso, A., P. Neitlich, R. J. Smith, and H. T. Lumbsch. 2014. Non-destructive lichen biomass estimation in northwestern Alaska: A comparison of methods. PLoS One 9 (7):e103739. doi:10.1371/journal.pone.0103739.
- Scotter, G. W. 1965. Study of the winter range of barren-ground caribou with special reference to the effects of forest fires. Wildlife Management Series Progress Report No. 3. Ottawa, Ontario: Canadian Wildlife Service, 81 pp.
- Shur, Y. L., and M. T. Jorgenson. 2007. Patterns of permafrost formation and degradation in relation to climate and ecosystems. Permafrost and Periglacial Processes 18 (1):7–19. doi:10.1002/ppp.582.
- Sturm, M., C. Racine, and K. Tape. 2001. Increasing shrub abundance in the Arctic. Nature 411 (6837):546–47. doi:10.1038/35079180.
- Sturm, M., J. Schimel, G. Michaelson, J. M. Welker, S. F. Oberbauer, G. E. Liston, J. Fahnestock, and V. E. Romanovsky. 2005. Winter biological processes could help convert Arctic tundra to shrubland. BioScience 55 (1):17–26. doi:10.1641/0006-3568(2005)055[0017:WBPCHC]2.0.CO;2.
- Sundqvist, M. K., J. Moen, R. G. Björk, T. Vowles, -M.-M. Kytöviita, M. A. Parsons, J. Olofsson, and R. Aerts. 2019. Experimental evidence of the long-term effects of reindeer on Arctic vegetation greenness and species richness at a larger landscape scale. Journal of Ecology 107 (6):2724–36. doi:10.1111/1365-2745.13201.
- Tarnocai, C. 2006. The effect of climate change on carbon in Canadian peatlands. Global and Planetary Change 53 (4):222–32. doi:10.1016/j.gloplacha.2006.03.012.
- Tarnocai, C. 2009. The impact of climate change on Canadian peatlands. Canadian Water Resources Journal 34 (4):453–66. doi:10.4296/cwrj3404453.
- Thomas, D. C., E. J. Edmonds, and W. K. Brown. 1996. The diet of woodland caribou populations in west-central Alberta. Rangifer 16 (4):337–42. doi:10.7557/2.16.4.1275.
- Thompson, I. D., P. A. Wiebe, E. Mallon, A. R. Rodgers, J. M. Fryxell, J. A. Baker, and D. Reid. 2015. Factors influencing the seasonal diet selection by woodland caribou (Rangifer tarandus tarandus) in boreal forests in Ontario. Canadian Journal of Zoology 93 (2):87–98. doi:10.1139/cjz-2014-0140.
- United Nations. 2020. Climate Change. Available from https://www.un.org/en/sections/issues-depth/climate-change/ [Accessed November 3, 2020].
- Vanderwel, M. C., and D. W. Purves. 2014. How do disturbances and environmental heterogeneity affect the pace of forest distribution shifts under climate change? Ecography 37 (1):1–20. doi:10.1111/j.1600-0587.2013.00345.x.
- Väre, H., R. Ohtonen, and K. Mikkola. 1996. The effect and extent of heavy grazing by reindeer in oligotrophic pine heaths in northeastern Fennoscandia. Ecography 19 (3):245–53. doi:10.1111/j.1600-0587.1996.tb01251.x.
- Vitt, D. H., L. A. Halsey, and S. C. Zoltai. 1994. The bog landforms of continental western Canada in relation to climate and permafrost patterns. Arctic and Alpine Research 26 (1):1–13. doi:10.2307/1551870.
- Vittoz, P., and A. Guisan. 2007. How reliable is the monitoring of permanent vegetation plots? A test with multiple observers. Journal of Vegetation Science 18 (3):413–22. doi:10.1111/j.1654-1103.2007.tb02553.x.
- Vittoz, P., N. Bayfield, R. Brooker, D. A. Elston, E. I. Duff, J.-P. Theurillat, and A. Guisan. 2010. Reproducibility of species lists, visual cover estimates and frequency methods for recording high-mountain vegetation. Journal of Vegetation Science 21 (6):1035–47. doi:10.1111/j.1654-1103.2010.01216.x.
- Zoltai, S. C. 1993. Cyclic development of permafrost in the peatlands of northwestern Alberta, Canada. Arctic and Alpine Research 25 (3):240–46. doi:10.2307/1551820.
- Zouaoui, S., C. Boudreault, P. Drapeau, and Y. Bergeron. 2014. Influence of time since fire and micro-habitatavailability on terricolous lichen communities in black spruce (Picea mariana) boreal forests. Forests 5 (11):2793–809. doi:10.3390/f5112793.
- Zuur, A., E.N. Ieno, N. Walker, A.A. Saveliev, and G.M. Smith. 2009. Mixed effects models and extensions in ecology with R. New York, NY: Springer.