
ABSTRACT
Northeast Greenland is the place where the Greenland Ice Sheet (GrIS) experienced the largest areal changes since the Last Glacial Maximum. However, the age constraints of the last deglaciation are in some areas sparse. In this study, we use forty-seven new 10Be cosmogenic exposure ages to constrain the deglaciation of the present-day ice-free areas in Northeast Greenland. Our results show that the outer coast region was deglaciated between 12.8 ± 0.6 and 11.5 ± 0.2 ka and the region close to the present ice margin was deglaciated 2 to 4 ka later between 9.2 ± 0.3 to 8.6 ± 0.3 ka. By combining our new results with previously published data from North and Northeast Greenland, we find that the ice sheet advanced to the shelf edge between 26 and 20 cal. ka BP. The outer coast was deglaciated between 12.8 and 9.7 ka and the present ice extent was reached between 10.8 to 5.8 ka. The ice margin continued to retreat farther inland during the Middle Holocene before it readvanced toward its Little Ice Age position. The deglaciation was probably forced by a combination of increased atmospheric and ocean temperatures, but local topography also played an important role. These results add to the growing knowledge about the glaciation history of the GrIS and add useful constraints for future ice sheet models.
Introduction
The glacial history of the Greenland Ice Sheet (GrIS) since the Last Glacial Maximum (LGM) has been well constrained in many parts of Greenland (Funder et al. Citation2011; Vasskog et al. Citation2015; Sinclair et al. Citation2016). However, there are still areas where there is less information about the maximum extent of the ice sheet during LGM and the timing of the subsequent deglaciation. One of the more debated topics in recent years has been the maximum extent of the ice sheet during LGM in Northeast Greenland (e.g., Funder et al. Citation2011). Traditionally, the maximum extent was primarily based on evidence from land that showed that the GrIS only expanded to the present coastline during LGM (Funder, Hjort, and Landvik Citation1994; Funder et al. Citation1998). However, in recent years, multibeam swath bathymetry data have outlined a whole suite of glacial landforms including glacial lineations, suggesting that the LGM ice sheet margin extended to the shelf edge in Northeast Greenland (Evans et al. Citation2009; Winkelmann et al. Citation2010; Arndt et al. Citation2015; Arndt, Jokat, and Dorschel Citation2017). This revised understanding of the glacial history leaves an open question about when the outer coast of Northeast Greenland was deglaciated. Until recently, the deglaciation history on land had been constrained only by minimum-limiting radiocarbon (14C) ages of marine shells found in raised marine deposits, driftwood, and basal ages of lake records (e.g., Bennike and Björck Citation2002; Funder et al. Citation2011).
With the introduction of cosmogenic nuclide exposure dating (10Be dating) it is possible to directly constrain the deglaciation by dating scoured bedrock, moraines, or erratic boulders left by an ice sheet (Dunai Citation2010). This methodological advancement has reinvigorated the exploration of the glaciation history of the GrIS. However, so far it has only been used in relatively few sites in the vast North and Northeast Greenland (L. Håkansson, Briner et al. Citation2007, Citation2007; Larsen et al. Citation2018, Citation2020; Biette et al. Citation2020; Skov et al. Citation2020). These studies have provided new information about the deglaciation, but not without problems. Some of the 10Be ages have been either younger than the assumed deglaciation age because of postglacial exhumation or older because of nuclide inheritance (M. A. Kelly et al. Citation2008; Larsen et al. Citation2014, Citation2021; Corbett et al. Citation2015; Søndergaard et al. Citation2019; Ceperley et al. Citation2020).
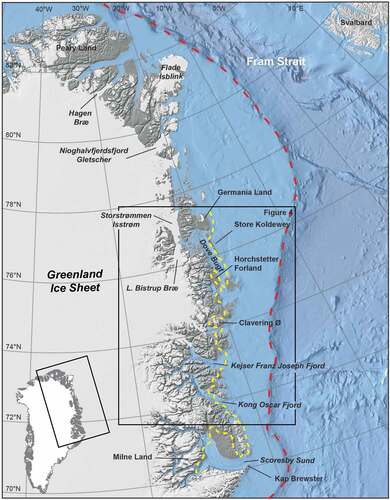
The aim of this study is to constrain the deglaciation history of Northeast Greenland from 72 to 77°N using 10Be dating (). Samples from the outer coast and from outside the present ice margin have been collected and dated. In addition, we have compiled the existing data from Northeast Greenland and reviewed the deglaciation history from LGM to present. Finally, we compare and discuss our reconstruction of the ice-marginal variations with established local and regional climate records.
Figure 1. Map of Northeast and North Greenland with place names mentioned in the text. Yellow hatched line: Milne Land Stage moraines (Funder et al. Citation2011). The LGM extent is marked by a red hatched line.
Study area
Geology and geography of Northeast Greenland
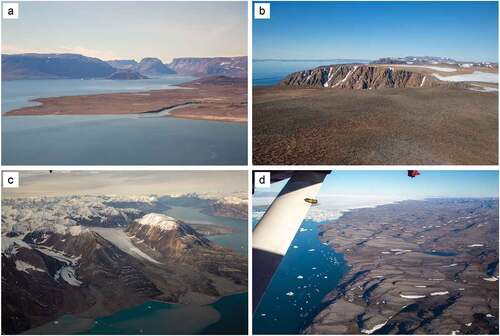
The bedrock in Northeast Greenland (72–77°N) consists of Precambrian and Caledonian basement overlain by Paleozoic, Mesozoic, and Cenozoic sedimentary and volcanic rocks (Henriksen et al. Citation2009). The fjord landscape is characterized by deep, relatively narrow fjords in between mountainous areas with elevations up to 3,694 m.a.s.l. (). Some of the fjords are up to 1,450 m deep and follow preexisting faults in the bedrock. The fjord formation probably began in the Mesozoic and Early Cenozoic as fluvial valleys and was later, with the inception of the GrIS, overdeepened by glacial erosion (Dam, Sønderholm, and Sørensen Citation2020). There is abundant evidence of glacial erosion in the lower elevations of the landscape in the form of glacial abrasion marks, whalebacks, and roche moutonnées. In contrast, there is often very little evidence of glacial activity at higher elevations, except for erratic boulders in blockfields indicating that the GrIS during peak glaciations overrode most of the higher elevations (; Funder Citation1989; L. Håkansson, Graf et al. Citation2007; Skov et al. Citation2020).
Figure 2. Glacial landscapes in Northeast Greenland. (a) Hvalrosodden in the foreground with deeply incised fjords (Mørkefjord) and plateau-like mountains in the background. (b) Blockfield on Store Koldewey. (c) Alpine topography and deep fjords in the inner parts of Kong Oscars Fjord. (d) Ice-scoured bedrock in front of Storstrømmen Isstrøm.
Late Pleistocene glacial history of Northeast Greenland
In Northeast Greenland the first comprehensive Quaternary stratigraphic framework was proposed by Funder and Hjort (Citation1973). According to their reconstruction, the GrIS reached its maximum extent during the Early Weichselian, followed by less extensive advances during the Middle and Late Weichselian, where the ice margin only reached the present coastline. Subsequent investigations generally confirmed this chronology (Funder Citation1978; Hjort Citation1979, Citation1981). Later investigations at Horchstetter Forland led to the discovery of marine interstadial deposits from the Early and Middle Weichselian (Hjort and Björck Citation1984). These results led to revision of the stratigraphy where the Early Weichselian ice advance was subsequently stratigraphically moved to the penultimate Saalian glaciation (Funder Citation1989; Funder, Hjort, and Kelly Citation1991).
A major step forward in the understanding of the glaciation history in Northeast Greenland arose from the PONAM (Polar North Atlantic Margins; Late Cenozoic Evolution) project in the early 1990s (Funder, Hjort, and Landvik Citation1994; Funder et al. Citation1998). Here several groups worked both on land and offshore in fjords and on the shelf in Northeast Greenland (e.g., Dowdeswell et al. Citation1994; Houmark-Nielsen et al. Citation1994; Landvik Citation1994). One of the major steps forward in the PONAM project was the use of luminescence, amino acid, and radiocarbon dating that enabled establishment of a firm chronology of the glacial and interglacial deposits and determined the glacial history of the GrIS in the area. During the penultimate Saalian glaciation (374–128 ka), two separate ice advances were identified in Marine Isotope Stage (MIS) 7 (Lollandselv glaciation) and MIS 6 (Scoresby Sund glaciation). The latter is believed to be the most extensive glaciation and covered most of the mountains in East Greenland and expanded all the way to the shelf edge (Möller et al. Citation1994; Nam et al. Citation1995). It was followed by interglacial marine deposits (Langelandselv interglaciation) from MIS 5e (Lyså and Landvik Citation1994; Mangerud and Funder Citation1994). In the Early Wechselian there were two glacial advances (Aucellaelv and Jyllandselv stades) with limited extent inside the present coastline. The glacial deposits are interlayered and overlain by interstadial marine deposits (Hugin Sø and Mønselv interstades; Landvik Citation1994; Lyså and Landvik Citation1994; Tveranger et al. Citation1994; Hansen et al. Citation1999).
It was originally believed that the GrIS made a short-lived advance (Flakkerhuk stade) to a location close to the present coastline or on the inner shelf during the LGM (Funder, Hjort, and Landvik Citation1994). This was later revised based on observations from several sites in and around Scoresby Sund and Hochstetter Forland that indicated that the GrIS occupied the fjords in East Greenland for ~65 ka during MIS 4–2 (Funder et al. Citation1998; Hansen et al. Citation1999). Recent radiocarbon ages of reworked marine shells in lateglacial moraines, however, suggest that the Northeast Greenland Ice Stream was more dynamic and inside its present extent during parts of MIS 3 (Larsen et al. Citation2018). The concept of the limited LGM ice extent was upheld until the early 2000s when new offshore acoustic and seismic surveys demonstrated that the GrIS expanded all the way to the shelf edge (Evans et al. Citation2002, Citation2009; Ó Cofaigh et al. Citation2004; Winkelmann et al. Citation2010; Arndt et al. Citation2015; Arndt, Jokat, and Dorschel Citation2017; Laberg, Forwick, and Husum Citation2017; Olsen et al. Citation2020). It is assumed that the well-preserved glacial landforms were formed during the LGM because they appear fresh and are not draped with significant sediment cover.
The offshore deglaciation chronology is based on basal ages from marine sediment cores collected on the shelf and by identifying peak ice-rafted debris (IRD) pulses in the sediment cores from the continental slope. A reduction in IRD and lower sedimentation rates in marine sediment cores from the slope suggest that deglaciation from the shelf began ~20 to 17 cal. ka BP (Nam et al. Citation1995; Stein et al. Citation1996; Evans et al. Citation2002; Nørgaard-Pedersen, Mikkelsen, and Kristoffersen Citation2008). According to the limited number of offshore age constraints, the middle and inner part of the shelf was deglaciated prior to c. 15.5 to 12.3 cal. ka BP (Nam et al. Citation1995; Evans et al. Citation2002). From terrestrial sites along the coast the deglaciation has been constrained using 14C dating of raised marine sediments and basal layers from lakes as well as 10Be dating. The results indicate that ice retreated off the shelf and to the coastline ~12 to 9 cal. ka BP (Bennike and Björck Citation2002; Funder et al. Citation2011; Sinclair et al. Citation2016). On land the GrIS left several prominent moraines in Northeast Greenland (70–77°N) during the Milne Land stade (Funder Citation1970; Hjort Citation1981; Landvik Citation1994; Funder et al. Citation2011). The Milne Land stade moraines have been dated by a combination of 14C and 10Be dating and indicate that the GrIS and local glaciers receded during the Younger Dryas but underwent a readvance or stillstand during Preboreal time (Hall, Baroni, and Denton Citation2008, Citation2010; M. A. Kelly et al. Citation2008; Levy et al. Citation2016). During the Early Holocene the GrIS retreated to the present extent, and investigations at the Northeast Greenland Ice Stream show that the ice stream was smaller than present ~7.8 to 1.2 cal. ka BP based on radiocarbon dating of reworked shells in Little Ice Age (LIA) moraines (Weidick et al. Citation1996; Bennike and Weidick Citation2001; Larsen et al. Citation2018).
Methods
In this study, we use 10Be dating to constrain the deglaciation in Northeast Greenland, between 72 and 77°N, from Kong Oscar Fjord in the south to Germania Land in the north (). The fieldwork was conducted during two field campaigns in 2015 and 2016. Samples for 10Be dating were mainly collected at two geographical areas to constrain the deglaciation of the ice-free areas: (1) the outer coast and (2) outside the present ice margin (). Most samples were selected at low elevation, in or adjacent to glacial valleys where glacial erosion is expected to be higher than at higher elevations, to minimize potential problems with nuclide inheritance (Briner et al. Citation2006). In total, forty-seven samples from fourteen different sites were collected, all being above the local marine limit of the individual sample areas (; Funder et al. Citation2011; Lecavalier et al. Citation2014). We sampled two to four erratic boulders from each of the sample sites. All boulders were resting on bedrock and situated in a geological setting without any glacial landforms such as meltwater channels or moraines. The only exception is the ten boulders sampled on two prominent moraines on Store Koldewey (GL1558-1567). Boulders were >0.5 m in height and diameter to reduce the influence of shielding from snow cover on the resulting 10Be ages (Gosse and Phillips Citation2001). All samples were collected using a rock saw, hammer, and chisel. We measured shielding and recorded the coordinates (latitude and longitude and elevation) using a Garmin E-trex 30 handheld Global Positioning System with an uncertainty of <10 m.
All boulder samples were processed in the Cosmogenic Nuclide Laboratory at Department of Geoscience, Aarhus University following methods adapted from Corbett, Bierman, and Rood (Citation2016a). Sample thicknesses were measured using a caliper before crushing and sieving the samples. We used the 250–700 μm fraction to isolate quartz and extract beryllium. Sample 10Be/9Be ratios were measured at the Aarhus AMS Center (Heinemeier et al. Citation2015) and 10Be ages () were calculated using the online exposure age calculator formerly known as the CRONUS-Earth online exposure calculator v.3 (Balco et al. Citation2008), the Arctic production rate (Young et al. Citation2013b), and the St production scaling scheme (Lal Citation1991; Stone Citation2000). Samples were measured using the beryllium standard 07KNSTD (Nishiizumi et al. Citation2007). We made no correction for potential snow cover or surface erosion and used a rock density of 2.65 g cm−3. The study area has undergone glacial isostatic uplift since deglaciation, and this may potentially influence the 10Be ages; however, previous studies have found that this correction is within 1σ of the AMS sample uncertainties (Young et al. Citation2011, Citation2013a; Larsen et al. Citation2018). Further, this effect is partly counteracted by atmospheric pressure changes in ice-marginal settings (Young et al. Citation2020). Therefore, we present 10Be ages without correcting for glacial isostatic uplift, similar to other 10Be studies from Greenland (Rinterknecht et al. Citation2009; L. Håkansson et al. Citation2014; Larsen et al. Citation2014; Young and Briner Citation2015; Levy et al. Citation2016; Sinclair et al. Citation2016; Corbett, Bierman, and Rood Citation2016b; Young et al. Citation2020). All 10Be ages are presented with their 1σ analytical uncertainties, including the uncertainty of the blank correction (). When we compare our 10Be ages with other ages or climate records, we include the production rate uncertainty (Young et al. Citation2013b). Statistical outliers are identified and excluded based on a χ2 test (95 percent confidence interval; italics in ).
Table 1. 10Be ages from Northeast Greenland.
All reported 10Be ages from previously published studies have been recalculated as described above (Supplementary Table 1). The 14C ages from previously published studies were calibrated in Oxcal 4.4 using the IntCal20 curve for terrestrial samples (Reimer et al. Citation2020) and Marine20 calibration curve for marine samples using a ΔR value of −25 ± 76 14C years (Heaton et al. Citation2020; Supplementary Table 2).
Results
In the following section, we present our 10Be data according to their location: (1) at the outer coast, (2) at an intermediate position between the outer coast and the present ice margin, and (3) outside the present ice margin.
Outer coast sites
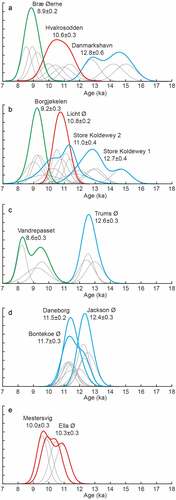
Samples were collected from seven sites at the outer coast (). Four sites are located in the northern part of the study area around Store Koldewey 77–76°N (Danmarkshavn, Store Koldewey 1, Store Koldewey 2, and Trums Ø) and in the southern part of the study area and three sites are located between Daneborg and Kong Oscar Fjord 74.5–73°N (Daneborg, Jackson Ø, and Bontekoe Ø). At Danmarkshavn the 10Be ages range from 15.0 to 12.8 ka. After excluding one outlier (12.77 ka, GL1549) the mean age is 14.6 ± 0.5 ka (n = 2). Two distinct moraines from the Nanok stadial (Hjort Citation1981) were dated on Store Koldewey (). Five boulders on the outer moraine (SK1) yielded ages between 7.6 and 14.7 ka, and after excluding two outliers (14.72 ka, GL1558; 7.59 ka, GL1562) the mean age is 12.7 ± 0.4 ka (n = 3). At the inner moraine (SK2), boulders gave ages between 9.7 and 13.0 ka, and after excluding one outlier (13.01 ka, GL1565) the mean age is 11.0 ± 0.4 ka (n = 4). At Trums Ø the 10Be ages range from 12.5 to 13.0 ka with a mean age of 12.6 ± 0.3 ka (n = 3). At Daneborg the 10Be ages range from 11.2 to 12.0 ka with a mean age of 11.5 ± 0.2 ka (n = 4). At Jackson Ø the 10Be ages range from 9.8 to 12.5 ka, and after excluding one outlier (9.82 ka, NE1602) the mean age is 12.4 ± 0.3 ka (n = 2). At Bontekoe Ø the 10Be ages range from 11.2 to 12.3 ka with a mean age of 11.7 ± 0.3 ka (n = 3).
Figure 3. New 10Be ages from this study in Northeast Greenland. The 10Be ages are divided into three categories: outer coast sites (blue dots), intermediate sites (red dots), and ice margin sites (green dots). The LGM extent is marked by a red hatched line. The yellow hatched line and numbering indicate the geographical subdivision used in .
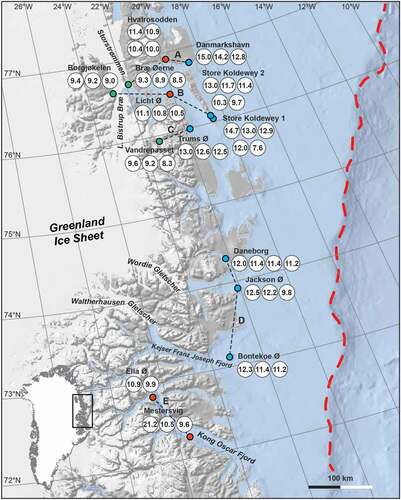
Figure 4. Sample collection in Northeast Greenland. (a) Trums Ø with Store Koldewey in the background, (b) Mestersvig, (c) Licht Ø, and (d) Nanok inner moraine (SK2) on Store Koldewey. See people for scale on the moraine. (e) Detailed map of the Nanok moraines with 10Be ages from the southern tip of Store Koldewey.
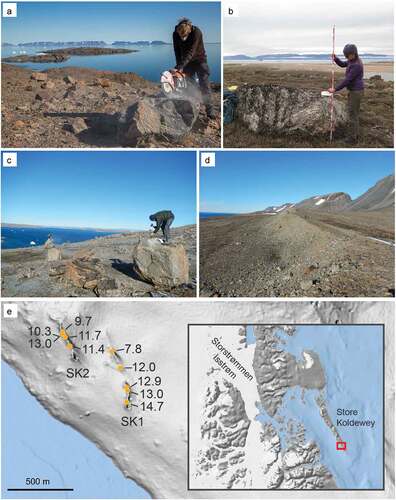
Figure 5. Probability distribution function of the 10Be ages divided into three categories from north to south: outer coast sites (blue), intermediate sites (red), and outside the present ice margin sites (green; for location, see ). Outliers identified using a χ2 test have been excluded in the plots (see ), with the exception of Danmarkshavn, where the two oldest ages are interpreted to be outliers and the youngest age as the most reliable estimate of the deglaciation age (see text for more explanation).
Intermediate sites
From the intermediate area halfway between the outer coast and the present ice margin we have data from four sites (). In the north around Dove Bugt there are data from two sites. At Hvalrosodden the 10Be ages range from 10.0 to 11.4 ka with a mean age of 10.6 ± 0.3 ka (n = 4). At Licht Ø the 10Be ages range from 10.5 to 11.1 ka with a mean age of 10.8 ± 0.2 ka (n = 3). In the south, in Kong Oscars Fjord, we have additional data from two sites. At Mestersvig, approximately halfway between the outer coast and the present-day ice margin, the 10Be ages range from 9.6 to 21.2 ka, and after excluding one outlier (21.24 ka, GL1507) the mean age is 10.0 ± 0.3 ka (n = 2). Further in the fjord at Ella Ø the 10Be ages range from 9.9 to 10.9 ka with a mean age of 10.3 ± 0.3 ka (n = 2).
Ice margin sites
From just outside the present ice margin, we have data from three sites in the northern part of the study area around Dove Bugt (). At Bræ Øerne a few kilometers outside the present ice margin of Storstrømmen, the 10Be ages range from 8.5 to 9.3 ka with a mean age of 8.9 ± 0.2 ka (n = 3). Close by, at Borgjøkelen, which is located between the Storstrømmen and Lars Bistrup Bræ, the 10Be ages range from 9.0 to 9.4 ka with a mean age of 9.2 ± 0.3 ka (n = 3). Farther south, at Vandrepasset the 10Be ages range from 8.3 to 9.6 ka with a mean age of 8.6 ± 0.3 ka (n = 3).
Discussion
Summary of new results
Overall, the new 10Be ages from Northeast Greenland are consistent, with only six out of forty-seven (~13 percent) ages being statistical outliers (, ). We find no relation between the sample setting and number of outliers. Most of the outliers are a few thousand years too old and most likely reflect nuclide inheritance because of insufficient erosion during the LGM. The number of outliers is less than that seen in studies from North Greenland (Corbett et al. Citation2015; Søndergaard et al. Citation2019; Ceperley et al. Citation2020; Larsen et al. Citation2020) but comparable to what is generally reported elsewhere in Greenland (Sinclair et al. Citation2016). This might reflect that we have been more focused on sampling areas with high erosion—that is, at low elevation adjacent to fjords—compared to the previous studies in North Greenland. However, in a similar study using the same approach adjacent to the largest fjord systems in North Greenland the number of outliers were nearly three times higher (~37 percent) than in the present study (Larsen et al. Citation2020), suggesting that glacial erosion generally is less effective at higher latitudes.
Our data show that the outer coastal sites were deglaciated between 12.8 ± 0.4 and 11.5 ± 0.2 ka. This age constraint is slightly older than existing 14C ages that indicate a deglaciation of the outer coast between 12.0 and 10.4 cal. ka BP (). The difference between the two dating methods is expected because the 14C ages represent minimum ages of the deglaciation, whereas the 10Be ages date the actual deglaciation (Sinclair et al. Citation2016). One exception is Danmarkshavn, which, according to our results, deglaciated by 14.6 ± 0.5 ka (n = 2), although one outlier suggests that it occurred later at 12.8 ka. The early deglaciation of Danmarkshavn seems inconsistent with 10Be ages from the northern part of Store Koldewey located on the other side of a fjord ~20 km to the south that show deglaciation at 12.2 ± 0.7 ka (n = 4; Skov et al. Citation2020). These results suggest that the youngest 10Be age from Danmarkshavn is probably the most likely estimate of the deglaciation of this area. In the following discussion, we will therefore use the youngest estimate of deglaciation from Danmarkshavn; that is, 12.8 ka. The new 10Be ages show that the Nanok-stadial moraines (SK1 and SK2) on the southern tip of Store Koldewey were formed during two events of stillstand or readvance at 12.7 ± 0.4 ka (SK1) and 11.0 ± 0.4 ka (SK2; ). L. Håkansson, Graf et al. (Citation2007) also reported one 10Be age (13.7 ka) from the moraines on Store Koldewey. However, it is unclear which of the moraines were dated and we therefore do not include these in the further discussion.
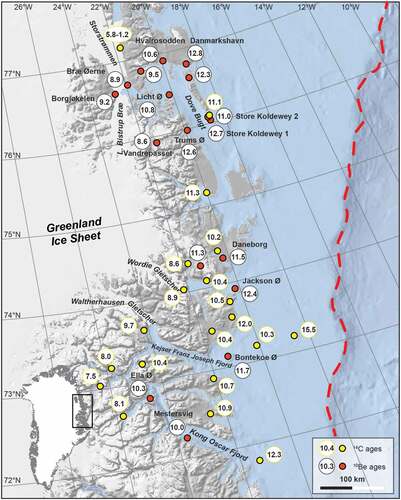
Figure 6. Map of Northeast Greenland showing the new 10Be ages (indicated with place names), as well as previously published 14C and 10Be ages concerning the deglaciation (S. Håkansson Citation1974, Citation1975; Weidick Citation1977; Björck et al. Citation1994; Landvik Citation1994; Nam et al. Citation1995; Weidick et al. Citation1996; Wagner et al. Citation2000, Citation2010; Bennike and Björck Citation2002; Christiansen et al. Citation2002; Evans et al. Citation2002; Wagner and Melles Citation2002; Klug et al. Citation2009; Bennike and Wagner Citation2012; Biette et al. Citation2020; Skov et al. Citation2020). Red hatched line indicates the maximum ice extent during the LGM. Note that at Danmarkshavn and Clavering Ø the most likely deglaciation 10Be ages are shown, whereas the oldest 10Be ages have been omitted (see text for further discussion).
The deglaciation of the intermediate sites in Northeast Greenland occurred between 10.8 ± 0.2 and 10.0 ± 0.3 ka, whereas the ice-marginal sites were deglaciated between 9.2 ± 0.3 and 8.6 ± 0.3 ka. This is to a large degree consistent with the existing minimum limiting 14C ages from close to the present ice margin that indicate deglaciation between 9.7 and 7.5 cal. ka BP (). It is only on Clavering Ø that there is an obvious discrepancy in the deglaciation chronology. Here, 10Be dating of moraines in front of three local valley glaciers on Theodolit Plateau suggests that the area was deglaciated by 16.2 ± 0.6 ka (n = 2) with readvances at 11.3 ± 0.3, 10.8 ± 0.6, 3.3 ± 0.2, 1.2 ± 0.1, and 0.37 ± 0.05 ka (Biette et al. Citation2020). The very early deglaciation at ~16.2 ka is not supported by other 10Be ages or minimum-limiting 14C ages in the area. At the two nearest sites at the outer coast north and south of Clavering Ø, our 10Be ages show that the area remained glaciated until ~12.4 ka (Jackson Ø, ~265 m.a.s.l.) and ~11.5 ka (Daneborg, ~100 m.a.s.l.; ). One possibility is that the outer coast remained glaciated until the Early Holocene while the higher elevation valleys farther inland on Clavering Ø became ice-free. However, because the samples on Clavering Ø were collected around 600 m.a.s.l., it seems unlikely that it was ice-free at the same time as the outer coastal sites 40 to 60 km away and at slightly lower elevations were glaciated. Instead, we suggest that the 10Be ages from the outer moraine (~16.2 ka) at Clavering Ø overestimate the actual deglaciation age because of nuclide inheritance, something that is often seen in moraines in front of local glaciers and ice caps in Greenland (M. A. Kelly et al. Citation2008; Søndergaard et al. Citation2019; Larsen et al. Citation2021). The other age estimates from the younger moraines on Clavering Ø (between 11.3 ± 0.3 and 0.37 ± 0.05 ka) are more consistent with the general deglaciation chronology.
Review of the last glaciation and deglaciation of North and Northeast Greenland
In the following we discuss the new results in relation to previous investigations in North and Northeast Greenland concerning the glacial history from LGM to the present () and compare our reconstruction of the ice-marginal variations with local and regional climate records (). The variability of the age constraints for when the ice margin receded to the outer coast, outside the present ice margin, and when it was inside its present extent is often relatively large (2–3 ka). Some of the variability may reflect actual differences in the timing of deglaciation, controlled by, for example, topography (e.g., Larsen et al. Citation2020), whereas other variations might reflect the lack of datable material from the actual deglaciation. This is particularly the case at some sites close to the present ice margin in the southern part of the study area where the age constraints are based primarily on a minimum-limiting 14C chronology. Here it would be an advantage to obtain more 10Be ages to constrain the deglaciation.
Figure 7. A data-based model of the evolution of the Greenland Ice Sheet in Northeast and North Greenland from the LGM to present. (a) LGM ice extent, (b) timing of deglaciation from shelf edge to coastline, (c) timing of deglaciation from coastline to present ice margin, and (d) timing of ice retreat inside the present ice extent. These reconstructions are based on new and existing 10Be (black font) and 14C (red font) ages (S. Håkansson Citation1974, Citation1975; Weidick Citation1976, Citation1977, Citation1978; Funder Citation1978, Citation1982, Citation1990; M. R. Kelly and Bennike Citation2008; Björck et al. Citation1994; Landvik Citation1994; Nam et al. Citation1995; Stein et al. Citation1996; Weidick et al. Citation1996; Hjort Citation1997; Wagner et al. Citation2000, Citation2010; Bennike and Weidick Citation2001; Bennike and Björck Citation2002; Christiansen et al. Citation2002; Evans et al. Citation2002; Wagner and Melles Citation2002; Nørgaard-Pedersen et al. Citation2003; L. Håkansson, Briner et al. Citation2007; Nørgaard-Pedersen, Mikkelsen, and Kristoffersen Citation2008; Klug et al. Citation2009; Bennike and Wagner Citation2012; Larsen et al. Citation2016, Citation2018, Citation2020; Biette et al. Citation2020; Skov et al. Citation2020).
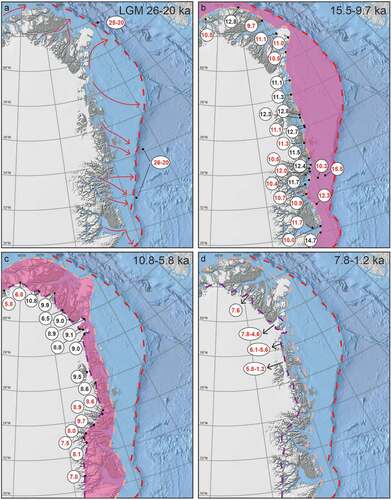
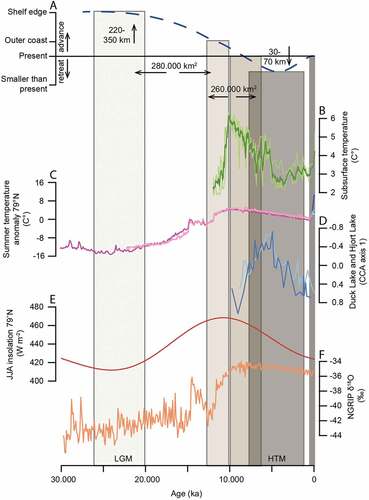
Figure 8. Ice margin fluctuations and climate variability the last 30,000 years. (a) Reconstruction of ice-marginal position from the LGM to present based on new 10Be data and existing chronologies (see text for more information). Vertical bars indicate when the ice margin was located at the shelf edge, outer coast, and present-day ice margin and was inside its present extent. The late glacial and Holocene deglaciation of the continental shelf and present-day ice-free area coincides with (b) peak subsurface temperatures based on planktic foraminiferal fauna assemblages (Werner et al. Citation2016) and (c) increased summer temperatures (Buizert et al. Citation2018). (d) The timing of maximum mid-Holocene ice retreat coincides with local chironomid-based temperature maxima at Duck (light blue) and Hjort (blue) lakes on Store Koldewey in Northeast Greenland (Schmidt et al. Citation2011). (e) Summer insolation at 79°N. (f) Ice core δ18O record from NGRIP (Andersen et al. Citation2004).
During the LGM the GrIS expanded to the shelf edge in North and Northeast Greenland (). This is evident from the offshore acoustic and seismic surveys demonstrating that late Pleistocene glacial landforms are scattered on the inner and outer shelves, indicating that the GrIS expanded all the way to the shelf edge (Evans et al. Citation2002, Citation2009; Ó Cofaigh et al. Citation2004; Winkelmann et al. Citation2010; Arndt et al. Citation2015; Arndt, Jokat, and Dorschel Citation2017; Laberg, Forwick, and Husum Citation2017; Olsen et al. Citation2020). A peak IRD signal from 26 to 20 cal. ka BP recorded in marine sediment cores from the continental margin slope is thought to record the timing of maximum ice extent during the LGM in Northeast Greenland (Stein et al. Citation1996; Nørgaard-Pedersen et al. Citation2003; Nørgaard-Pedersen, Mikkelsen, and Kristoffersen Citation2008). The deglaciation of the shelf area is constrained by radiocarbon dating of marine deposits above glacial till deposits but only from a few cores. In the northern part of Northeast Greenland (76–80°N) the shelf deglaciation is unconstrained. The shelf in the southern part of Northeast Greenland was deglaciated by 12.3 cal. ka BP (Kong Oscars Fjord) and 15.5 cal. ka BP (Kejser Franz Joseph Fjord; Nam et al. Citation1995; Evans et al. Citation2002). The GrIS then continued to retreat, and it reached the outer coast between 12.8 and 9.7 ka (), except for Kap Brewster in Scoresby Sund, where the outer coast most likely deglaciated already by 14.7 ka (n = 1; L. Håkansson, Briner et al. Citation2007). Thus, the ~280,000 km2 continental shelf area in North and Northeast Greenland was deglaciated mainly between ~20 and 12.8 to 10.1 ka. The breakup of the ice sheet on the shelf was probably driven by the gradual rise in late glacial atmospheric temperatures (Buizert et al. Citation2018; ), but it was most likely also affected by other factors such as sea level change and ocean warming, shelf bathymetry, and drainage and sea ice conditions (cf. Funder et al. Citation2011).
At the outer coast or the fjord heads the GrIS left the prominent but discontinuous Milne Land stade moraines in Northeast Greenland (Hjort Citation1981). Our new results from Store Koldewey suggest that the Nanok-stadial moraines (SK1 12.7 and SK2 11.0 ka) were formed at the same time as the Milne Land moraines in Scoresby Sund during the late Allerød to early Younger Dryas and Preboreal time (M. A. Kelly et al. Citation2008; Levy et al. Citation2016) and thereby confirm that the moraines most likely can be correlated along an ~800-km stretch in Northeast Greenland (Funder et al. Citation2011). Accordingly, it seems unlikely that outlet glaciers from the GrIS readvanced to an outer coast or mid-shelf location at Scoresby Sund, Kong Oscar Fjord, and Kejser Franz Joseph Fjord as suggested by Arndt (Citation2018) because these fjord systems host the late Allerød to Preboreal Milne Land stade moraines ruling out the possibility of a major Younger Dryas readvance onto the shelf (see Funder et al. [Citation2021] for further discussion). The synchronous formation of the Milne Land and Nanok moraines suggests that they were formed in response to a regional climatic forcing rather than local topographical constraints. It furthermore shows that the GrIS receded—not advanced—during the Younger Dryas cooling in Northeast Greenland (M. A. Kelly et al. Citation2008; Levy et al. Citation2016) as recorded in the rest of Greenland (Funder et al. Citation2021), except one place on the north coast of Peary Land (Larsen et al. Citation2016). The overall recession of the GrIS during the Younger Dryas was probably driven by a combination of strong seasonality with anomalously warm summers and extremely cold winters (Björck et al. Citation2002; Denton et al. Citation2005) and increased advection of warm subsurface water (Knutz et al. Citation2011; Jennings et al. Citation2017; Funder et al. Citation2021).
Following the deglaciation of the outer coast during the period 12.8 to 9.7 ka, the GrIS variably attained ice-marginal positions equivalent to the modern ice margin between 10.8 and 5.8 ka (). During this period the present-day ice-free land (~260,000 km2) was deglaciated. The retreat to the present ice margin through the various fjord systems varied in time, but because of insufficient data coverage in many fjords we are unable to determine whether the local bathymetry had any effect on the rate of ice retreat. One exception is that the deep fjords in North Greenland were deglaciated faster than the shallower fjords and the land-based parts of the study area (Larsen et al. Citation2020). Here the rapid deglaciation of the deeper fjord systems was probably triggered by higher summer surface temperatures and subsurface ocean temperatures (cf. Larsen et al. Citation2020).
It has been established at a few locations that the GrIS receded farther inland than its present extent during the Early and Middle Holocene based on the presence of reworked marine mollusks in LIA moraines adjacent to large outlet glaciers (). A single radiocarbon date of marine shells at the mouth of a major valley ~6 km inland of the present extent at Hagen Bræ indicates that Hagen Bræ was smaller than present ~7.6 cal. ka BP (Funder Citation1982). At Nioghalvfjerdsfjord Gletscher, 14C dates of reworked marine shells and whale bones show that the floating ice margin retreated at least 70 km behind its present extent 7.8 to 4.6 cal. ka BP (Bennike and Weidick Citation2001). Farther south at Søndre Mellemland, the ice margin was behind its present extent at least from 6.1 to 5.6 cal. ka BP (Bennike and Weidick Citation2001). Adjacent to Storstrømmen Isstrøm, reworked shells in LIA moraines demonstrate that it was smaller than present 5.8 to 1.2 cal. ka BP (Weidick et al. Citation1996). Based on a simple extrapolation, it has been suggested that the ice margin in northern Northeast Greenland only retreated 30 to 40 km inside its present extent during the Holocene Thermal Maximum except in areas with deep fjords where the ice margin probably retreated farther inland (Larsen et al. Citation2020). This is in line with the Huy3 ice sheet model, which suggests that the ice margin was located close to its present ice extent during the Holocene Thermal Maximum in North and Northeast Greenland (Lecavalier et al. Citation2014). The period with smaller than present ice extent coincides with a local chironomid-based temperature maximum ~8 to 5 cal. ka BP from Store Koldewey (Schmidt et al. Citation2011) and warm subsurface temperatures in Fram Strait (Werner et al. Citation2016). Since then, the ice sheet advanced toward its LIA extent in the nineteenth century (Weidick et al. Citation1996; Bennike and Weidick Citation2001), where it remained until it began to retreat in the twentieth century (Kjeldsen et al. Citation2015).
Conclusion
In this study we present forty-seven new 10Be ages from Northeast Greenland (72–77°N) that were collected to determine the timing of deglaciation of the GrIS from the outer coast to the present ice margin. Our data show that the outer coast was deglaciated between 12.8 ± 0.6 and 11.5 ± 0.2 ka and that the ice margin reached positions equivalent to the present ice sheet margin between 9.2 ± 0.3 to 8.6 ± 0.3 ka. We furthermore combine our new results with previously published data from North and Northeast Greenland (72–82°N) and review the ice sheet history from the LGM until today. During LGM, the GrIS advanced to the shelf edge, where it remained at least from 26 to 20 cal. ka BP. The onset of deglaciation of the ~280,000 km2 shelf area is very uncertain, but it is well-constrained that the ice margin reached the outer coast between 12.8 and 9.7 ka and the present ice extent between 10.8 and 5.8 ka. Then followed a period where the ice retreated inside its present extent and reached a minimum extent during the Middle Holocene before the ice readvanced toward its LIA position. Overall, the late glacial and Holocene deglaciation in North and Northeast Greenland was driven by a combination of increased atmospheric and ocean temperatures. However, our results also indicate that local topography played an important role in the deglaciation, where the deep fjords were deglaciated faster than the shallower fjords and land-based parts of the area.
Supplemental Material
Download Zip (86.5 KB)Acknowledgments
We thank the personnel at Station Nord, Danmarkshavn, Daneborg, and Mestersvig for great hospitality during our field campaigns in 2015 and 2016. We also thank Thorsten Nagel for help with the fieldwork in 2015. Finally, we thank laboratory technicians Birte Lindahl Eriksen and Rikke Brok Jensen for help processing the samples in the cosmo-lab. We thank the editor Anne E. Jennings and the two journal reviewers (Jason Briner and anonymous) for constructive feedback.
Disclosure statement
No potential conflict of interest was reported by the authors.
Supplementary material
Supplemental material for this article can be accessed on the publisher’s website.
Additional information
Funding
Related Research Data
References
- Andersen, K. K., N. Azuma, J. M. Barnola, M. Bigler, P. Biscaye, N. Caillon, J. Chappellaz, H. B. Clausen, D. DahlJensen, H. Fischer, et al. 2004. High-resolution record of Northern Hemisphere climate extending into the last interglacial period. Nature 431:147–51.
- Arndt, J. E., W. Jokat, B. Dorschel, R. Myklebust, J. A. Dowdeswell, and J. Evans. 2015. A new bathymetry of the Northeast Greenland continental shelf: Constraints on glacial and other processes. Geochemistry, Geophysics, Geosystems 16 (10):3733–53. doi:10.1002/2015GC005931.
- Arndt, J. E., W. Jokat, and B. Dorschel. 2017. The last glaciation and deglaciation of the Northeast Greenland continental shelf revealed by hydro-acoustic data. Quaternary Science Reviews 160:45–56. doi:10.1016/j.quascirev.2017.01.018.
- Arndt, J. E. 2018. Marine geomorphological record of Ice Sheet development in East Greenland since the Last Glacial Maximum. Journal of Quaternary Science 33 (7):853–64. doi:10.1002/jqs.3065.
- Balco, G., J. O. Stone, N. A. Lifton, and T. J. Dunai. 2008. A complete and easily accessible means of calculating surface exposure ages or erosion rates from 10Be and 26Al measurements. Quaternary Geochronology 3 (3):174–95. doi:10.1016/j.quageo.2007.12.001.
- Bennike, O., and A. Weidick. 2001. Late Quaternary history around Nioghalvfjerdsfjorden and Jøkelbugten, North-East Greenland. Boreas 30 (3):205–27. doi:10.1080/030094801750424139.
- Bennike, O., and S. Björck. 2002. Chronology of the last recession of the Greenland Ice Sheet. Journal of Quaternary Science 17 (3):211–19. doi:10.1002/jqs.670.
- Bennike, O., and B. Wagner. 2012. Deglaciation chronology, sea-level changes and environmental changes from Holocene lake sediments of Germania Havn Sø, Sabine Ø, northeast Greenland. Quaternary Research 78 (1):103–09. doi:10.1016/j.yqres.2012.03.004.
- Biette, M., V. Jomelli, M. Chenet, R. Braucher, V. Rinterknecht, T. Lane, and A. Team. 2020. Mountain glacier fluctuations during the Lateglacial and Holocene on Clavering Island (northeastern Greenland) from 10Be moraine dating. Boreas 49 (4):873–85. doi:10.1111/bor.12460.
- Björck, S., B. Wohlfarth, O. Bennike, C. Hjort, and T. Persson. 1994. Revision of the early Holocene lake sediment based chronology and event stratigraphy on Hochstetter Forland, NE Greenland. Boreas 23 (4):513–23. doi:10.1111/j.1502-3885.1994.tb00619.x.
- Björck, S., O. Bennike, P. Rosen, C. S. Andresen, S. Bohncke, E. Kaas, and D. Conley. 2002. Anomalously mild Younger Dryas summer conditions in southern Greenland. Geology 30 (5):427–30. doi:10.1130/0091-7613(2002)030<0427:AMYDSC>2.0.CO;2.
- Briner, J. P., G. H. Miller, P. T. Davis, and R. C. Finkel. 2006. Cosmogenic radionuclides from fiord landscapes support differential erosion by overriding ice sheets. Geological Society of America Bulletin 118 (3–4):406–20. doi:10.1130/B25716.1.
- Buizert, C., B. Keisling, J. E. Box, F. He, A. E. Carlson, G. Sinclair, and L. R. Deconto. 2018. Greenland-wide seasonal temperature reconstructions for the last deglaciation. Geophysical Research Letters 45 (4):1905–14. doi:10.1002/2017GL075601.
- Ceperley, E. G., S. A. Marcott, M. M. Reusche, A. M. Barth, A. C. Mix, E. J. Brook, and M. Caffee. 2020. Widespread early Holocene deglaciation, Washington Land, northwest Greenland. Quaternary Science Reviews 231:106181. doi:10.1016/j.quascirev.2020.106181.
- Christiansen, H. H., O. Bennike, J. Bocher, B. Elberling, O. Humlum, and B. H. Jakobsen. 2002. Holocene environmental reconstruction from deltaic deposits in northeast Greenland. Journal of Quaternary Science 17 (2):145–60. doi:10.1002/jqs.665.
- Corbett, L. B., P. R. Bierman, G. E. Lasher, and D. H. Rood. 2015. Landscape chronology and glacial history in Thule, northwest Greenland. Quaternary Science Reviews 109:57–67. doi:10.1016/j.quascirev.2014.11.019.
- Corbett, L. B., P. R. Bierman, and D. H. Rood. 2016a. An approach for optimizing in situ cosmogenic 10Be sample preparation. Quaternary Geochronology 33:24–34. doi:10.1016/j.quageo.2016.02.001.
- Corbett, L. B., P. R. Bierman, and D. H. Rood. 2016b. Constraining multi-stage exposure-burial scenarios for boulders preserved beneath cold-based glacial ice in Thule, northwest Greenland. Earth and Planetary Science Letters 440:147–57. doi:10.1016/j.epsl.2016.02.004.
- Dam, G., M. Sonderholm, and E. V. Sorensen. 2020. Inherited basement canyons: Impact on sediment distribution in the North Atlantic. Terra Nova 32 (4):272–80. doi:10.1111/ter.12459.
- Denton, G. H., R. B. Alley, G. C. Comer, and W. S. Broecker. 2005. The role of seasonality in abrupt climate change. Quaternary Science Reviews 24 (10–11):1159–82. doi:10.1016/j.quascirev.2004.12.002.
- Dowdeswell, J., G. Uenzelmannneben, R. J. Whittington, and P. Marienfeld. 1994. The Late Quaternary sedimentary record in Scoresby Sund, East Greenland. Boreas 23 (4):294–310. doi:10.1111/j.1502-3885.1994.tb00602.x.
- Dunai, T. J. 2010. Cosmogenic nuclides: Principles, concepts and applications in the earth surface sciences. Cambridge: Cambridge University Press.
- Evans, J., J. A. Dowdeswell, H. Grobe, H. Hubberten, F. Niessen, R. Stein, R. J. Whittington. 2002. Late Quaternary sedimentation in Kejser Franz Josephs Fjord and the continental margin of East Greenland. In Glacier-influenced Sedimentation on High-Latitude Continental Margins, ed. J. A. Dowdeswell and C. Ó Cofaigh, 149–79. Special Publication-Geological Society of London 203.
- Evans, J., C. Ó. Cofaigh, J. A. Dowdeswell, and P. Wadhams. 2009. Marine geophysical evidence for former expansion and flow of the Greenland Ice Sheet across the north-east Greenland continental shelf. Journal of Quaternary Science 24 (3):279–93. doi:10.1002/jqs.1231.
- Funder, S. 1970. Notes on the glacial geology of eastern Milne Land, Scoresby Sund, East Greenland. Grønlands Geologiske Undersøgelse Rapport 30:37–42. doi:10.34194/rapggu.v30.7243.
- Funder, S., and C. Hjort. 1973. Aspects of the Weichselian chronology in central East Greenland. Boreas 2:69–84.
- Funder, S. 1978. Holocene stratigraphy and vegetation history in the Scoresby Sund area, East Greenland. Bulletin Grønlands Geologiske Undersøgelse 129:1–66. doi:10.34194/bullggu.v129.6671.
- Funder, S. 1982. C-14 dating of samples collected during the 1979 expedition to North Greenland. Grønlands Geologiske Undersøgelse Rapport 110:9–14. doi:10.34194/rapggu.v110.7787.
- Funder, S. 1989. Quaternary geology of the ice-free areas and adjacent shelves of Greenland. In Quaternary geology of Canada and Greenland. Geological Survey of Canada, Geology of Canada, and R. J. Fulton, 743–92. Ottawa, Canada.
- Funder, S. 1990. Descriptive text to Quaternary map of Greenland 1: 500,000, Scoresby Sund, Sheet 12. Grønlands Geologiske Undersøgelse 24 pp.
- Funder, S., C. Hjort, and M. Kelly. 1991. Isotope stage 5 (130-74 ka) in Greenland, a review. Quaternary International 10-12:107–22. doi:10.1016/1040-6182(91)90044-O.
- Funder, S., C. Hjort, and J. Y. Landvik. 1994. The Last Glacial Cycles in East Greenland, an overview. Boreas 23 (4):283–93. doi:10.1111/j.1502-3885.1994.tb00601.x.
- Funder, S., C. Hjort, J. Y. Landvik, S. I. Nam, N. Reeh, and R. Stein. 1998. History of a stable ice margin East Greenland during the Middle and Upper Pleistocene. Quaternary Science Reviews 17 (1–3):77–123. doi:10.1016/S0277-3791(97)00082-6.
- Funder, S., K. K. Kjeldsen, K. H. Kjær, and C. Ó Cofaigh. 2011. The Greenland Ice Sheet during the last 300,000 years: A review. Developments in Quaternary Science 15:699–713.
- Funder, S., A. H. L. Sørensen, N. K. Larsen, A. A. Bjørk, J. P. Briner, J. Olsen, A. Schomacker, L. B. Levy, and K. H. Kjær. 2021. Younger Dryas ice margin retreat in Greenland: New evidence from southwestern Greenland. Clim Past 17 (2):587–601. doi:10.5194/cp-17-587-2021.
- Gosse, J. C., and F. M. Phillips. 2001. Terrestrial in situ cosmogenic nuclides: Theory and application. Quaternary Science Reviews 20 (14):1475–560. doi:10.1016/S0277-3791(00)00171-2.
- Håkansson, S. 1974. University of Lund radiocarbondates VII. Radiocarbon 16:307–30.
- Håkansson, S. 1975. University of Lund Radiocarbon dates VIII. Radiocarbon 17 (2):174–95. doi:10.1017/S0033822200002034.
- Håkansson, L., J. Briner, H. Alexanderson, A. Aldahan, and G. Possnert. 2007. 10Be ages from central east Greenland constrain the extent of the Greenland Ice Sheet during the Last Glacial Maximum. Quaternary Science Reviews 26 (19–21):2316–21. doi:10.1016/j.quascirev.2007.08.001.
- Håkansson, L., A. Graf, S. Strasky, S. Ivy-Ochs, P. W. Kubik, C. Hjort, and Schluchter. 2007. Cosmogenic 10Be-ages from the Store Koldewey Island, NE Greenland. Geografiska Annaler: Series A, Physical Geography 89A (3):195–202. doi:10.1111/j.1468-0459.2007.00318.x.
- Håkansson, L., J. P. Briner, C. S. Andresen, E. K. Thomas, and O. Bennike. 2014. Slow retreat of a land based sector of the West Greenland Ice Sheet during the Holocene Thermal Maximum: Evidence from threshold lakes at Paakitsoq. Quaternary Science Reviews 98:74–83. doi:10.1016/j.quascirev.2014.05.016.
- Hall, B. L., C. Baroni, and G. H. Denton. 2008. The most extensive Holocene advance in the Stauning Alper, East Greenland, occured in the Little Ice. Age Polar Research 27 (2):128–34. doi:10.1111/j.1751-8369.2008.00058.x.
- Hall, B. L., C. Baroni, and G. H. Denton. 2010. Relative sea-level changes, Schuchert Dal, East Greenland, with implications for ice extent in late-glacial and Holocene times. Quaternary Science Reviews 29 (25–26):3370–78. doi:10.1016/j.quascirev.2010.03.013.
- Hansen, L., S. Funder, A. S. Murray, and V. Mejdahl. 1999. Luminescence dating of the last Weichselian Glacier advance in East Greenland. Quaternary Science Reviews 18 (2):179–90. doi:10.1016/S0277-3791(98)00051-1.
- Heaton, T. J., P. Kohler, M. Butzin, E. Bard, R. W. Reimer, W. E. N. Austin, C. B. Ramsey, P. M. Grootes, K. A. Hughen, and B. Kromer, et al. 2020. Marine20—the marine radiocarbon age calibration curve (0-55,000 cal BP). Radiocarbon 62 (4):779–820. doi:10.1017/RDC.2020.68.
- Heinemeier, J., J. Olsen, M. Klein, and D. Mous. 2015. The new extended HVE 1 MV multi-element AMS system for low background installed at the Aarhus AMS Dating Centre. Nuclear Instruments and Methods in Physics Research Section B: Beam Interactions with Materials and Atoms 361:143–48. doi:10.1016/j.nimb.2015.05.039.
- Henriksen, N., A. K. Higgins, F. Kalsbeek, and T. C. R. Pulvertaft. 2009. Greenland from Archean to Quaternary. Descriptive text to the 1995 geological map of Greenland, 1:2.500.000, 2nd edition. Geological Survey of Denmark and Greenland, Bulletin 18:126. doi:10.34194/geusb.v18.4993.
- Hjort, C. 1979. Glaciation in Northern East Greenland during the Late Weichselian and Early Flandrian. Boreas 8 (3):281–96. doi:10.1111/j.1502-3885.1979.tb00812.x.
- Hjort, C. 1981. A glacial chronology for northern East Greenland. Boreas 10 (3):259–74. doi:10.1111/j.1502-3885.1981.tb00487.x.
- Hjort, C., and S. Björck. 1984. A re-evaluation of the glacial chronology in northern East Greenland. Geologiska Foreningens i Stockholm Förhandlingar 105 (3):235–43. doi:10.1080/11035898309452590.
- Hjort, C. 1997. Glaciation, climate history, changing marine levels and the evolution of the Northeast Water Polynya. Journal of Marine Systems 10 (1–4):23–33. doi:10.1016/S0924-7963(96)00068-1.
- Houmark-Nielsen, M., L. Hansen, M. E. Jørgensen, and C. Kronborg. 1994. Stratigraphy of a Late Pleistocene ice-cored moraine at Kap Herschell, Northeast Greenland. Boreas 23 (4):505–12. doi:10.1111/j.1502-3885.1994.tb00618.x.
- Jennings, A. E., J. T. Andrews, C. Ó. Cofaigh, G. St Onge, C. Sheldon, S. T. Belt, P. Cabedo-Sanz, and C. Hillaire-Marcel. 2017. Ocean forcing of Ice Sheet retreat in central west Greenland from LGM to the early Holocene. Earth and Planetary Science Letters 472:1–13. doi:10.1016/j.epsl.2017.05.007.
- Kelly, M. R., and O. Bennike. 1992. Quaternary geology of western and central North Greenland. Grønlands Geologiske Undersøgelse Rapport 153:1–34. doi:10.34194/rapggu.v153.8164.
- Kelly, M. A., T. V. Lowell, B. L. Hall, J. M. Schaefer, R. C. Finkel, B. M. Goehring, R. B. Alley, and G. H. Denton. 2008. A 10Be chronology of lateglacial and Holocene mountain glaciation in the Scoresby Sund region, east Greenland: Implications for seasonality during lateglacial time. Quaternary Science Reviews 27 (25–26):2273–82. doi:10.1016/j.quascirev.2008.08.004.
- Kjeldsen, K. K., N. J. Korsgaard, A. A. Bjork, S. A. Khan, J. E. Box, S. Funder, N. K. Larsen, J. L. Bamber, W. Colgan, and M. van den Broeke, et al. 2015. Spatial and temporal distribution of mass loss from the Greenland Ice Sheet since AD 1900. Nature 528 (7582):396–400. doi:10.1038/nature16183.
- Klug, M., S. Schmidt, O. Bennike, O. Heiri, M. Melles, and B. Wagner. 2009. Lake sediments from Store Koldewey, Northeast Greenland, as archive of Late Pleistocene and Holocene climatic and environmental changes. Boreas 38 (1):59–71. doi:10.1111/j.1502-3885.2008.00038.x.
- Knutz, P. C., M. A. Sicre, H. Ebbesen, S. Christiansen, and A. Kuijpers. 2011. Multiple-stage deglacial retreat of the Southern Greenland Ice Sheet linked with Irminger Current warm water transport. Paleoceanography 26 (3). doi: 10.1029/2010pa002053.
- Laberg, J. S., M. Forwick, and K. Husum. 2017. New geophysical evidence for a revised maximum position of part of the NE sector of the Greenland Ice Sheet during the last glacial maximum. arktos 3 (1):3. doi:10.1007/s41063-017-0029-4.
- Lal, D. 1991. Cosmic-ray labelling of erosion surfaces: In situ nuclide production rates and erosion models. Earth and Planetary Science Letters 104 (2–4):424–39. doi:10.1016/0012-821X(91)90220-C.
- Landvik, J. Y. 1994. The last glaciation of Germania Land and adjacent areas, northeast Greenland. Journal of Quaternary Science 9:81–92. doi:10.1002/jqs.3390090108.
- Larsen, N. K., S. Funder, K. H. Kjær, K. K. Kjeldsen, M. F. Knudsen, and H. Linge. 2014. Rapid early Holocene ice retreat in West Greenland. Quaternary Science Reviews 92:310–23. doi:10.1016/j.quascirev.2013.05.027.
- Larsen, N. K., S. Funder, H. Linge, P. Möller, A. Schomacker, D. Fabel, S. Xu, and K. H. Kjær. 2016. A Younger Dryas re-advance of local glaciers in north Greenland. Quaternary Science Reviews 147:47–58. doi:10.1016/j.quascirev.2015.10.036.
- Larsen, N. K., L. B. Levy, A. E. Carlson, C. Buizert, J. Olsen, A. Strunk, A. A. Bjørk, and D. S. Skov. 2018. Instability of the Northeast Greenland Ice Stream over the last 45,000 years. Nature Communications 9 (1). doi:10.1038/s41467-018-04312-7.
- Larsen, N. K., A. S. Søndergaard, L. B. Levy, J. Olsen, A. Strunk, A. A. Bjørk, and D. S. Skov. 2020. Contrasting modes of deglaciation between fjords and inter-fjord areas in eastern North Greenland. Boreas 4:903–17. https://doi.org/10.1111/bor.12475
- Larsen, N. K., A. S. Søndergaard, L. B. Levy, C. H. Laursen, A. A. Bjørk, K. K. Kjeldsen, S. Funder, A. Strunk, J. Olsen, and K. H. Kjær. 2021. Cosmogenic nuclide inheritance in Little Ice Age moraines - A case study from Greenland. Quaternary Geochronology 65:101200. doi:10.1016/j.quageo.2021.101200.
- Lecavalier, B. S., G. A. Milne, M. J. R. Simpson, L. Wake, P. Huybrechts, L. Tarasov, K. K. Kjeldsen, S. Funder, A. J. Long, and S. A. Woodroffe, et al. 2014. A model of Greenland Ice Sheet deglaciation based on observations of ice extent and relative sea-level. Quaternary Science Reviews 102:54–84. doi:10.1016/j.quascirev.2014.07.018.
- Levy, L. B., M. A. Kelly, T. V. Lowell, B. L. Hall, J. A. Howley, and C. A. Smith. 2016. Coeval fluctuations of the Greenland Ice Sheet and a local glacier, central East Greenland, during late glacial and early Holocene time. Geophysical Research Letters 43 (4):1623–31. doi:10.1002/2015GL067108.
- Lyså, A., and J. Landvik. 1994. The lower Jyllandselv succession: Evidence for three Weichselian glacier advances over coastal Jameson Land, East Greenland. Boreas 23 (4):432–46. doi:10.1111/j.1502-3885.1994.tb00611.x.
- Mangerud, J., and S. Funder. 1994. The interglacial-glacial record at the mouth of Scoresby Sund, East Greenland. Boreas 23 (4):349–58. doi:10.1111/j.1502-3885.1994.tb00605.x.
- Möller, P., C. Hjort, L. Adrielsson, and O. Salvigsen. 1994. Glacial history of interior Jameson Land, East Greenland. Boreas 23 (4):320–48. doi:10.1111/j.1502-3885.1994.tb00604.x.
- Nam, S. I., R. Stein, H. Grobe, and H. Hubberten. 1995. Late Quaternary glacial interglacial changes in sediment composition at the East Greenland continental margin and their paleoceanographic implications. Marine Geology 122 (3):243–62. doi:10.1016/0025-3227(94)00070-2.
- Nishiizumi, K., M. Imamura, M. W. Caffee, J. R. Southon, R. C. Finkel, and J. McAninch. 2007. Absolute calibration of 10Be AMS standards. Nuclear Instruments and Methods in Physics Research, Section A: Accelerators, Spectrometers, Detectors and Associated Equipment 258 (2):403–13. doi:10.1016/j.nimb.2007.01.297.
- Nørgaard-Pedersen, N., R. F. Spielhagen, H. Erlenkeuser, P. M. Grootes, J. Heinemeier, and J. Knies. 2003. Arctic Ocean during the Last Glacial Maximum: Atlantic and polar domains of surface water mass distribution and ice cover. Paleoceanography 18 (3):8-1 - 8–19. doi:10.1029/2002PA000781.
- Nørgaard-Pedersen, N., N. Mikkelsen, and Y. Kristoffersen. 2008. Late glacial and Holocene marine records from the Independence Fjord and Wandel Sea regions, North Greenland. Polar Research 27 (2):209–21. doi:10.1111/j.1751-8369.2008.00065.x.
- Ó Cofaigh, C., J. A. Dowdeswell, J. Evans, N. H. Kenyon, J. Taylor, A. Mienert, and M. Wilken. 2004. Timing and significance of glacially influenced mass-wasting in the submarine channels of the Greenland Basin. Marine Geology 207 (1–4):39–54. doi:10.1016/j.margeo.2004.02.009.
- Olsen, I. L., T. A. Rydningen, M. Forwick, J. S. Laberg, and K. Husum. 2020. Last glacial ice sheet dynamics offshore NE Greenland – A case study from Store Koldewey Trough. The Cryosphere 14 (12):4475–94. doi:10.5194/tc-14-4475-2020.
- Reimer, P. J., W. E. N. Austin, E. Bard, A. Bayliss, P. G. Blackwell, C. Bronk Ramsey, M. Butzin, H. Cheng, R. L. Edwards, and M. Friedrich, et al. 2020. The IntCal20 Northern Hemisphere radiocarbon age calibration curve (0–55 cal kBP). Radiocarbon 62 (4):725-757. https://doi.org/10.1017/RDC.2020.41
- Rinterknecht, V., Y. Gorokhovich, J. Schaefer, and M. Caffee. 2009. Preliminary 10Be chronology for the last deglaciation of the western margin of the Greenland Ice Sheet. Journal of Quaternary Science 24 (3):270–78. doi:10.1002/jqs.1226.
- Schmidt, S., B. Wagner, O. Heiri, M. Klug, O. Bennike, and M. Melles. 2011. Chironomids as indicators of the Holocene climatic and environmental history of two lakes in Northeast Greenland. Boreas 40 (1):116–30. doi:10.1111/j.1502-3885.2010.00173.x.
- Sinclair, G., A. E. Carlson, A. C. Mix, B. S. Lecavalier, G. Milne, A. Mathias, C. Buizert, and R. DeConto. 2016. Diachronous retreat of the Greenland Ice Sheet during the last deglaciation. Quaternary Science Reviews 145:243–58. doi:10.1016/j.quascirev.2016.05.040.
- Skov, D. S., J. L. Andersen, J. Olsen, B. H. Jacobsen, M. F. Knudsen, J. D. Jansen, N. K. Larsen, and D. L. Egholm. 2020. Constraints from cosmogenic nuclides on the glaciation and erosion history of Dove Bugt, northeast Greenland. Bulletin of the Geological Society of America 132 (11–12):2282–94. doi:10.1130/B35410.1.
- Søndergaard, A. S., N. K. Larsen, J. Olsen, J. Olsen, and S. Woodroffe. 2019. Glacial history of the Greenland Ice Sheet and a local ice cap in Qaanaaq, Northwest Greenland. Journal of Quaternary Science 34 (7):536–47. doi:10.1002/jqs.3139.
- Stein, R., S.-I. Nam, H. Grobe, H. Hubberten. 1996. Late Quaternary glacial history and short-term ice-rafted debris fluctuations along the East Greenland continental margin. In Late Quaternary palaeoceanography of the North Atlantic margins, ed. J. T. Andrews, W. E. N. Austin, H. Bergsten, and A. E. Jennings, 135–51. Special Publication-Geological Society of London no. 111.
- Stone, J. O. 2000. Air pressure and cosmogenic isotope production. Journal of Geophysical Research 105 (B10):23753–59. doi:10.1029/2000JB900181.
- Tveranger, J., M. Houmark-Nielsen, K. Løvbjerg, and J. Mangerud. 1994. Eemian-Weichselian stratigraphy of the Flakkerhuk ridge, Southern Jameson Land, East Greenland. Boreas 23 (4):359–84. doi:10.1111/j.1502-3885.1994.tb00606.x.
- Vasskog, K., P. M. Langebroek, J. T. Andrews, J. E. Ø. Nilsen, and A. Nesje. 2015. The Greenland Ice Sheet during the last glacial cycle: Current ice loss and contribution to sea-level rise from a palaeoclimatic perspective. Earth-Science Reviews 150:45–67. doi:10.1016/j.earscirev.2015.07.006.
- Wagner, B., M. Melles, J. Hahne, F. Niessen, and H. W. Hubberten. 2000. Holocene climate history of Geographical Society Ø, East Greenland - evidence from lake sediments. Palaeogeography, Palaeoclimatology, Palaeoecology 160 (1–2):45–68. doi:10.1016/S0031-0182(00)00046-8.
- Wagner, B., and M. Melles. 2002. Holocene environmental history of western Ymer Ø, East Greenland, inferred from lake sediments. Quaternary International 89 (1):165–76. doi:10.1016/S1040-6182(01)00087-8.
- Wagner, B., O. Bennike, H. Cremer, and M. Klug. 2010. Late Quaternary history of the Kap Mackenzie area, northeast Greenland. Boreas 39:492–504.
- Weidick, A. 1976. C14 dating of Survey material, carried out in 1975. Rapport Grønlands Geologiske Undersøgelse 80:136–44. doi:10.34194/rapggu.v80.7507.
- Weidick, A. 1977. C14 dating of Survey material carried out in 1976. Rapport Grønlands Geologiske Undersøgelse 85:127–29. doi:10.34194/rapggu.v85.7545.
- Weidick, A. 1978. Comments on radiocarbon dates from Northern Greenland made during 1977. Rapport Greenlands Geologiske Undersøgelse 90:124–28. doi:10.34194/rapggu.v90.7610.
- Weidick, A., C. Andreasen, H. Oerter, and N. Reeh. 1996. Neoglacial glacier changes around Storstrømmen, North-East Greenland. Polarforschung 64:95–108.
- Werner, K., J. Mullner, K. Husum, R. F. Spielhagen, E. S. Kandiano, and L. Polyak. 2016. Holocene sea subsurface and surface water masses in the Fram Strait - Comparisons of temperature and sea-ice reconstructions. Quaternary Science Reviews 147:194–209. doi:10.1016/j.quascirev.2015.09.007.
- Winkelmann, D., W. Jokat, L. Jensen, and H. W. Schenke. 2010. Submarine end moraines on the continental shelf off NE Greenland - Implications for Lateglacial dynamics. Quaternary Science Reviews 29 (9–10):1069–77. doi:10.1016/j.quascirev.2010.02.002.
- Young, N. E., J. P. Briner, H. A. M. Stewart, Y. Axford, B. Csatho, D. H. Rood, and R. C. Finkel. 2011. Response of Jakobshavn Isbrae Greenland, to Holocene climate change. Geology 39 (2):131–34. doi:10.1130/G31399.1.
- Young, N. E., J. P. Briner, D. H. Rood, R. C. Finkel, L. B. Corbett, and P. R. Bierman. 2013a. Age of the Fjord Stade moraines in the Disko Bugt region, western Greenland, and the 9.3 and 8.2 ka cooling events. Quaternary Science Reviews 60:76–90. doi:10.1016/j.quascirev.2012.09.028.
- Young, N. E., J. M. Schaefer, J. P. Briner, and B. M. Goehring. 2013b. A 10Be production-rate calibration for the Arctic. Journal of Quaternary Science 28 (5):515–26. doi:10.1002/jqs.2642.
- Young, N. E., and J. P. Briner. 2015. Holocene evolution of the western Greenland Ice Sheet: Assessing geophysical ice-sheet models with geological reconstructions of ice-margin change. Quaternary Science Reviews 114:1–17. doi:10.1016/j.quascirev.2015.01.018.
- Young, N. E., J. P. Briner, G. H. Miller, A. J. Lesnek, S. E. Crump, E. K. Thomas, S. L. Pendleton, J. Cuzzone, J. Lamp, S. Zimmerman, et al. 2020. Deglaciation of the Greenland and Laurentide ice sheets interrupted by glacier advance during abrupt coolings. Quaternary Science Reviews 229:106091. doi:10.1016/j.quascirev.2019.106091.