
 ?Mathematical formulae have been encoded as MathML and are displayed in this HTML version using MathJax in order to improve their display. Uncheck the box to turn MathJax off. This feature requires Javascript. Click on a formula to zoom.
ABSTRACT
Active layer thicknesses (ALTs) from sites along a transect through the Mackenzie Valley, Northwest Territories, Canada, were analyzed to explore variation in thickness within and between ecoregions. At an ecoregional scale the relation between ALT, latitude, freezing and thawing degree-days, and snowfall were examined to determine the presence of trends. Site-specific variables including dominant vegetation and substrate were explored to explain spatial variability in ALT within ecoregions. Generally, average ALT increases moving southward through the comprising ecoregions (68 cm to 126 cm), following the increase in air temperature. Spatial variability in ALT within ecoregions was greater than that between ecoregions (up to 145 cm), which may be attributed to site-specific conditions (vegetation and snow cover). Most notable, sites with shrubs had thicker than average active layers likely because of increased snow retention leading to warmer overall ground conditions. Despite a warming trend in air temperatures, only one northern ecoregion showed a corresponding thickening trend in ALT. Sites located in southern ecoregions with mature forests showed limited response to changes in air temperature. For these locations, disturbance, specifically changes in thermally protective vegetation cover, rather than changing air temperature could potentially have a larger impact on ALT into the future.
Introduction
The active layer refers to the layer of ground in areas underlain by permafrost, which is subject to annual freezing and thawing and is the location where most subsurface ecosystem processes occur in the permafrost landscape. The nature of this layer is dynamic, responding to temporal climatic shifts showing only subtle connection to atmospheric interannual variability (Shur, Hinkel, and Nelson Citation2005). Although the most common metric used to describe the nature of the active layer is thickness at the time of maximum thaw, the predictability of this value is not universally tied to latitude or even mean annual air temperature (Bonnaventure and Lamoureux Citation2013). Active layer thicknesses (ALTs) are dependent on several factors, including latitude, elevation, solar insolation patterns, albedo, proximity to glaciers, and/or warm maritime ocean currents, as well as site-specific factors including soil texture and moisture content (Bockheim and Hall Citation2002). Some factors including vegetation and snow distribution can vary substantially within climatic zones due to topography, hydrology, and dominant wind patterns (Evans et al. Citation1989; Young, Woo, and Edlund Citation1997; Garibaldi, Bonnaventure, and Lamoureux Citation2021). Vegetation has been shown to influence ALT through snow entrapment and interception, shading, evapotranspiration, and insulation depending on the vegetation type (Duchesne et al. Citation2015; Fisher et al. Citation2016; Loranty et al. Citation2018). Previous studies of ALT have primarily considered the impact of summer (thawing degree-days) conditions on ALT; however, antecedent winter conditions including snow cover and freezing degree-days may also substantially impact ALT (Mazhitova et al. Citation2004). Seasonal snow cover insulates the surface from cold winter conditions, leading to warmer winter ground conditions and potentially thicker active layers (Zhang Citation2005). Snow cover also alters the timing of freeze-back in the autumn, the progression of the ground freezing front, and the nature of the spring thaw (Zhang Citation2005; Morse, Burn, and Kokelj Citation2012). Thicker snow covers can also have considerable impact on the ground surface temperature by trapping latent heat expelled from the subsurface that cannot be freely dispersed to the atmosphere (Zhang Citation2005; Bonnaventure, Lewkowicz, and Hillaire-Marcel Citation2008).
The complexities of the active layer are further complicated by conflicting definitions of the active layer itself (Burn and Smith Citation1988). Thermally, the base of this layer ideally exists at the idealized freezing/melting point of water in nature (0°C); however, this may not match the base of the physical active layer. Much of this discrepancy is attributed to the intricacy and diversity of active layer materials, which can contain variable levels of moisture and substrate composition including mineral sediment, ions in solution, and organic layers (Hinkel et al. Citation2001; Shiklomanov et al. Citation2010). Additionally, the active layer is morphologically linked to the environment and can be influenced by the adjacency to water bodies or mass movement debris (Hinkel and Nelson Citation2003).
Because the active layer can be spatially heterogeneous on multiple scales, assessing variability is challenging but necessary to better understand the impact of change in cold regions (Bonnaventure, Lamoureux, and Favaro Citation2017; Garibaldi, Bonnaventure, and Lamoureux Citation2021). Understanding this variability helps to recognize the range and complexity that goes with trying to ascertain how permafrost environments will be impacted by warming (Bonnaventure and Lamoureux Citation2013). The goal of this study is to examine the temporal and spatial variability in ALT using an ecoregional approach. Recent studies have focused on the impact of vegetation and ecosystem characteristics on ALT largely focusing on tundra and boreal forests (Duchesne et al. Citation2015; Fisher et al. Citation2016; Loranty et al. Citation2018). Expanding these regional ALT assessments specifically in the Mackenzie Valley on an ecoregional scale will aid in small-scale (circumpolar, national scale) modeling studies which utilize regional data (e.g., Obu et al. Citation2019) and may allow for the creation of ALT models in this region (e.g., Yi et al. Citation2018). This study updates previous work in the Mackenzie Valley relating ALT to ecoclimatic zone and further analyzes an ALT data set used in previous work (Tarnocai, Mark Nixon, and Kutny Citation2004; Duchesne et al. Citation2015) building to explore the relation between active layer thickness, broad climate, and vegetation characteristics. The different ecoregions in the Mackenzie Valley have shown variable attributes with respect to the nature and timing of ground freeze-back in the autumn (S. L. Smith et al. Citation2016). Therefore, it is possible that active layer thickness also varies within and between these ecoregions. In order to conduct this analysis, multiple years of data must be examined and compared. This study utilizes data collected since 1991 from an active layer monitoring network in the Mackenzie Valley and Delta region to document ALT through time. Sites are representative of the range of vegetation and surficial material conditions throughout the region. The Mackenzie Valley is well suited for this type of study because both permafrost and vegetation are heterogeneous across the study transect, which passes through discontinuous (underlying <90 percent) to continuous (underlying 90–100 percent) permafrost zones and from boreal forested to tundra vegetation ecoregions. This study compares regional and temporal ALT patterns between ecoregions spanning the valley, expanding on work previously conducted by Duchesne et al. (Citation2015) by further examining these data and conditions according to ecoregions.
Study area
The Geological Survey of Canada active layer monitoring transect spans the length of the Mackenzie Valley and Delta, with sites from the Delta and Tuktoyaktuk Peninsula to the southern Northwest Territories (). Sites are in Inuvialuit, Gwich’in, Sahtu, and DehCho First Nations settlement regions and traditional territories. The transect ( and ) comprises multiple monitoring sites and extends from the zone of discontinuous to continuous permafrost and from the boreal forest near Fort Simpson to the Beaufort Sea coast (S. L. Smith, Riseborough et al. Citation2009). Substrate along the transect is variable but consists of mainly moraine, lacustrine, fluvial, and deltaic deposits that can be ice-rich, although ice content varies from site to site (Heginbottom, Dubreuil, and Harker Citation1995; Aylsworth, Burgess et al. Citation2000; Aylsworth, Kettles et al. Citation2000). Extensive peatlands and fens consisting of sedges, mosses, and stunted black spruce are particularly prevalent in the Southern portion of the valley (Aylsworth, Burgess et al. Citation2000; Aylsworth, Kettles et al. Citation2000; Ecosystem Classification Group Citation2007). The sites in the transect are representative of the various ecoregions in Northwest Territories, which are generally defined based on unique regional climatic gradients and major changes in physiography (Ecosystem Classification Group Citation2010). Ecoregions are classified furthermore in (Level II) ecoregional classification. This Level II classification adds an additional level of complexity based on macroclimate, vegetation, soil, geology, and physiographic features, which is the subdivision basis of permafrost and vegetation characteristics and additionally combined with climatic parameters to create the Level III ecosystem classifications (Ecosystem Classification Group Citation2012). Level III ecoregions that contain active layer monitoring sites in the Mackenzie Valley along this transect include Tundra Plains Low Arctic north (LAn), Taiga Plains High Subarctic (HS), Low Subarctic (LS), and Mid Boreal (MB), Boreal Cordillera High Boreal (HB), and Taiga Cordillera Low Subarctic (LS) encompassing seven of the nineteen possible Level III ecoregions found in the Northwest Territories ( and ). Throughout the valley, air temperature, annual precipitation, and snowfall increase moving north to south ().
Table 1. Summary table of characteristics of each ecoregion with active layer monitoring sites (Ecoregions Working Group Citation1989; Ecosystem Classification Group Citation2007, Citation2010, Citation2012; Environment Canada Citation2017).
Table 2. Climate Normals (1981–2010) for five of the Environment Canada climate stations located in the Mackenzie Valley.
Figure 1. Site map with active layer monitoring sites. Sites are located both above and below treeline and monitor active layer thickness over both continuous and discontinuous permafrost. Sites with the longest records are located in the northern and southern ends of the delta. Permafrost zones from Heginbottom, Dubreuil, and Harker (Citation1995) and ecoregion boundaries from Ecosystem Classification Group (Citation2007, Citation2010, Citation2012).
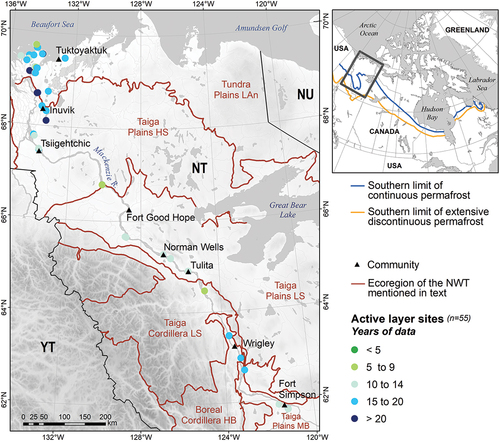
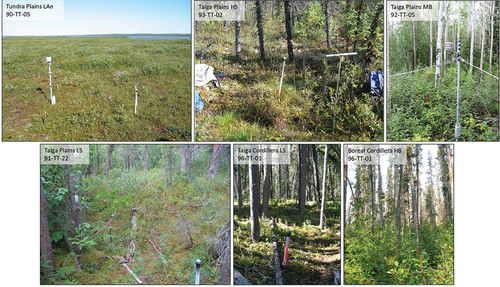
Figure 2. Site photos with representative vegetation cover for each ecoregion sampled. More site details can be found in the Supplementary Material Table S1 (Smith et al. Citation2009; Duchesne, Riseborough, and Smith Citation2014).
Methods
Active layer monitoring sites throughout the study area were established to represent variable terrain conditions including surficial material and vegetation characteristics of the Mackenzie Valley (Nixon and Taylor Citation1994; Duchesne, Riseborough, and Smith Citation2014; Duchesne et al. Citation2015). Thaw tubes (e.g., Mackay Citation1973; S. L. Smith, Riseborough et al. Citation2009; S. L. Smith, Wolfe et al. Citation2009) were used to measure maximum annual thaw penetration and also the position of the ground surface at the time of maximum heave and ground surface subsidence. Maximum thaw depth is determined by the position of a glass bead that sits on the frozen surface and descends to the point of maximum thaw each year during the thaw season (Nixon and Taylor Citation1994). Measurements are made to 1 mm precision and are considered accurate to about 2 cm (Nixon and Taylor Citation1998). Thaw tubes are considered a superior technique compared to probing for determining active layer thickness because they do not require personnel to be present on the specific day of maximum thaw, which varies annually (Bonnaventure and Lamoureux Citation2013). Maximum thaw penetration and ground surface position at time of maximum thaw were used to calculate ALT. At some sites (n = 20) air and ground surface temperatures were recorded using single channel data loggers (Onset HOBO, accuracy ±0.4°C or Vemco, accuracy ±0.3°C) with air temperature sensors housed in radiation shields 1.5 m above the ground surface and ground surface temperature sensors buried at a depth of 3 to 7 cm (Duchesne, Riseborough, and Smith Citation2014).
Sites were classified by ecoregions by plotting the site location, using the specified coordinates on a location ecoregion map from Northwest Territories Environment and Natural Resources to assess classification. Of the fifty-five sites, thirty are in the tundra plains LAn ecoregion, eleven in the Taiga Plains HS ecoregion, six in the Taiga Plains LS ecoregion, four in the Taiga Plains MB ecoregion, and four in the Boreal and Taiga Cordillera (Table S1). Sites are not evenly distributed throughout the ecoregions partly due to logistical and accessibility issues.
Temporal gaps in the record were identified for each site. Most notable, there is a lack of recent data in the central portion of the valley, with most of the station records ending between 2008 and 2010. For each ecoregion, the annual minimum, maximum, and average of annual maximum ALTs were calculated. If there was only a record for one site in a given year for an ecoregion, no statistics were calculated, because it may have been misrepresentative of the ALT trends for that ecoregion.
Historical climate data and the Canadian monthly climate summaries for the nearest climate station (Environment Canada Citation2017) were used to determine monthly and yearly air temperature averages from 1990 to 2015 (the length of the monitoring record). At Tuktoyaktuk and Inuvik, multiple Environment Canada (EC) stations (n = 2 in close proximity, <400 m, with similar elevations, <0.3 m difference) were used to create a more continuous temperature record over the study period. A regression analysis was done for dates with data from both stations for comparison (Tuktoyaktuk r2 = 0.67 and Inuvik r2 = 0.99). Freezing and thawing degree-days were calculated for each year (September 1 to August 31) of the study period at each climate station through the summation of all the average daily temperatures below (FDDa) and above (TDDa) 0°C. FDDa and TDDa provide an indication of the duration and magnitude of freezing or thawing temperatures. At sites with on-site air and ground temperature measurements, FDD and TDD for the air (a) and ground surface (g) were calculated. Snowfall over the study period was compiled from the climate stations with data taken from several neighboring stations for Inuvik and Fort Good Hope. A regression analysis was done to compare the difference between the two stations (Inuvik r2 = 0.57 and Fort Good Hope r2 = 0.79). The regression analysis for Fort Good Hope was only used to infill missing snowfall data for April 2006. Missing snowfall values for the months of May to September were assumed to be 0 cm based on analysis of snowfall during this period over the entire 1990–2015 record and measurements of snowfall at other stations during the same month.
Air and ground surface FDD and TDD were used to calculate seasonal n-factors (ratio of surface temperature to air temperature; M. W. Smith and Riseborough Citation2002) for sites having on-site temperature data. N-factors are transfer functions representing the energy fluxes at a single location that can be used to estimate the surface offset (M. W. Smith and Riseborough Citation1996; Klene et al. Citation2001). Because the surface offset is influenced by vegetation and snow cover, which vary throughout the year, n-factors are typically divided into freezing (nf) and thawing (nt) n-factors, with nf largely determined by snow cover in winter and the nt characterizing vegetation cover in summer (M. W. Smith and Riseborough Citation2002). Nf and nt were calculated using ground surface and air temperature data from October 1 of the previous year to April 30 of the current year and May 1 to September 30 of the current year, respectively (EquationEquation (1)(1)
(1) ; M. W. Smith and Riseborough Citation2002; Duchesne, Riseborough, and Smith Citation2014).
Climatic data were examined using the downscaling program ClimateNA (Wang et al. Citation2016). This examined monthly reanalysis data (downscaled PRISM data) for each of the active layer monitoring sites were used to compare annual and seasonal air temperature trends over the study period. This allowed for the assessment of generalized climatic changes for each specific ecoregion to assess the relationship between air temperature and ALT changes. Additionally, a simple random forest and multivariable linear regression (MVLR) analyses were conducted to determine the relative importance of winter (FDDa and FDDg) and summer (TDDa and TDDg) conditions on ALT at sites with both ALT and temperature records. Random forest (R Studio Citation2020, randomForest) was run to determine variable importance ranking and MVLR (Excel, Analysis ToolPak) was completed to test each variable for statistical significance for all sites. Only MVLR was done for each ecoregion individually. These were selected for their straightforward and interpretable variable importance rankings (or statistical significance).
Results
Climate analysis
Records of air temperature from Environment Canada stations indicate a warming trend during the study period (1990–2015; ). At the northernmost station, Tuktoyaktuk (), annual mean air temperature (AMAT) increased by 3.1°C from 1990 to 2015, whereas at the southernmost station, Fort Simpson AMAT increased by 2.7°C. This equates to warming trends of 0.12°C/decade and 0.10°C/decade at Tuktoyaktuk and Fort Simpson, respectively. The greatest warming (0.24°C/decade) occurred at Fort Good Hope. These values are all comparable to that estimated for the Mackenzie region in the most recent Arctic assessment (Arctic Monitoring and Assessment Programme Citation2017). Results of the ClimateNA reanalysis data indicate that warming is seasonally asymmetric with warming trends observed in autumn and winter (warming 0.8–1.3°C/decade and 1.0–2.0°C/decade with slope errors of 0.03 and 0.05, respectively) but no trend evident in spring and summer for all ecoregions (cooling 0.1–0.3°C/decade and warming 0–0.3°C/decade with slope errors of 0.05 and 0.03, respectively). Spatially, the average annual FDDa decreased southward while the average annual TDDa increased, with the Tuktoyaktuk station recording the highest FDDa and lowest value of TDDa and Fort Simpson station recording the lowest FDDa and the highest TDDa (). Temporally, there was a slight decrease in FDDa at each of the EC stations; however, the fit in each case was very weak (r2 < 0.1 slope errors ranging from 8.7 to 28.5). The greatest temporal range in FDDa occurred at the Wrigley station and the lowest occurred at the Tuktoyaktuk station (). There was a slight but weak (r2 < 0.1 slope errors ranging from 4.9–15.0) increase in TDDa over the monitoring period at all EC stations. Over the monitoring period the greatest range in TDDa was observed at the Wrigley station and the lowest occurred at the Inuvik station (). Across every ecoregion with active layer monitoring sites, FDDa varied more interannually than TDDa (). Spatial range in FDDa within the ecoregions was greatest in the two northernmost ecoregions and smallest for the southern ecoregions (). The same spatial pattern in variability was also observed for TDDa, although the variation within each ecoregion was smaller than for FDDa.
Figure 3. AMAT with the trendlines for Environment Canada climate stations (see for location) closest to active layer monitoring sites in the Mackenzie Valley (from Environment Canada Citation2017).
Figure 4. Average daily temperatures below (FDDa) and above (TDDa) for the EC stations in the Mackenzie Valley. Mean FDDa and TDDa for all years with data are represented by an X. For most stations, maximum and minimum FDDa and TDDa are shown by the ends of the whiskers. However, for some sites outliers are shown as circles after the whiskers and the ends of the whiskers instead show the value for one and a half times the interquartile range. The ends of the box show the first (25 percent) and third (75 percent) quartiles and the black line within the box shows the median. The years with the highest and lowest FDDa and TDDa are written respectively above and below the marker.
Figure 5. Average ALT for each ecoregion plotted with FDDa/TDDa and snowfall from the nearest EC station. (A) Tundra Plains LAn average ALT with FDDa/TDDa and snowfall from the Tuktoyaktuk EC station. (B) Taiga Plains HS average ALT with FDDa/TDDa and snowfall from the Inuvik EC station. (C) Taiga Plains LS average ALT with FDDa/TDDa and snowfall from the Norman Wells EC station. (D) Taiga Plains MB average ALT with FDDa/TDDa snowfall from the Fort Simpson EC station. (E) Boreal and Taiga Cordillera average ALT with FDDa/TDDa snowfall from the Fort Simpson EC station.
Figure 6. Box and whisker plot for FDDa, TDDa, FDDg, and TDDg measured at sites for each ecoregion. “g” is ground and “a” is air. X represents the mean and the circle indicates the value of outliers, which are points outside one and a half times the interquartile range.
Snowfall in the valley varies substantially annually and these fluctuations are not consistent between stations (). For the study period (1990–2015), the lowest snowfall was recorded at Tuktoyaktuk (annual average 106 cm) with limited interannual variability (range 97 cm), whereas the most snowfall was recorded at Fort Simpson (annual average 199 cm), which also exhibited the largest interannual variability (range, 234 cm). Over the monitoring period trends in snowfall varied by station. At Tuktoyaktuk and Fort Simpson snowfall exhibited a positive temporal trend (r2 = 0.37 and 0.31 with slope errors of 1.6 and 1.5, respectively). Snowfall seemed to decrease through time at Fort Good Hope (r2 = 0.67 slope error of 1.3). Although there appeared to be trends in snowfall at Inuvik, Norman Wells, and Wrigley, the correlation was very weak (r2 < 0.1 with slope errors of 2.5, 0.94, and 1.5, respectively).
Figure 7. Annual total snowfall data for Environment Canada stations in the Mackenzie Valley from 1990 to 2015 (Environment Canada Citation2017). Mean snowfall for all years with data is represented by an X. The maximum and minimum yearly snowfall at each station are represented by the whiskers. The black line within the box shows the median yearly snowfall at each station, and the ends of the box show the first (25 percent) and third (75 percent) quartiles. The years with maximum and minimum annual snowfall at each station are written above and below the marker, respectively.
Active layer monitoring
Regional
The average ALT for 1991 to 2014 ranged from less than 50 cm in the northern portion of the Mackenzie Valley in the Tundra Plains LAn ecoregion to greater than 160 cm in the southernmost part of the valley in the Taiga Plains MB ecoregion (). Generally, the active layer is thinnest in the Tundra Plains LAn ecoregion and thickest in the Taiga Plains MB increasing moving south ( and ). However, this does not hold true for the Taiga Plains LS and Boreal and Taiga Cordillera ecoregions. Spatial range in ALT was greatest for the northern ecoregions and Taiga Plains MB. The spatial range in ALT for the Taiga Plains LS ecoregion is large due to one outlier site with a relatively thick active layer. The spatial range in ALT for the remaining sites is 42 cm.
Table 3. ALT metrics for each ecoregion.
Figure 8. Mean active layer thickness for all years and sites classified by ecoregion. Thirty monitoring sites are in the Tundra Plains LAn ecoregion, eleven are within the Taiga Plains HS ecoregion, six are in the Taiga Plains LS ecoregion, four are in the Taiga Plains MB ecoregion, and three are in the Boreal and Taiga Cordillera.
Figure 9. Mean and ranges of ALT by ecoregion along the Mackenzie Valley transect. Mean ALT for all years with data is represented by an X. The maximum and minimum ALT for all years and sites within an ecoregion are represented by the ends of the lines except for those with outliers (circles past the ends of the whiskers), in which case the ends of the whiskers represent the value one and a half times the interquartile range. The black line within the box shows the median annual ALT for each ecoregion, and the ends of the box show the first (25 percent) and third (75 percent) quartiles. The year and site with the thickest and thinnest active layers are written respectively above and below the marker. Some sites maintained the thickest or thinnest active layer for multiple years, and for these sites the years indicate this duration. More details on the individual stations can be found in the Supplementary Material in Table S1.
Temporally, sites with thinnest active layers generally remained thin throughout the monitoring period. Similarly, sites with the thickest active layers remained the thickest. Over the monitoring period ALTs in the Taiga Plains HS and MB ecoregions varied the most through time while ALTs in the Tundra Plains LAn, Taiga Plains LS, and Boreal and Taiga Cordillera showed the least variability.
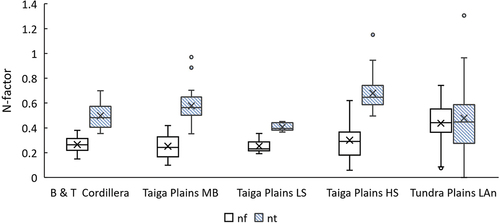
Air–ground surface connectivity also varied spatially and temporally between ecoregions. Average nf values for each ecoregion decreased from north to south, with the highest mean nf (0.43) in the Tundra Plains LAn ecoregion and the lowest value (0.27) in both the Taiga Plains MB and Boreal and Taiga Cordillera ecoregions ( and ). The two northernmost ecoregions (Tundra Plains LAn and Taiga Plains HS) had the largest spatial range in nf, whereas the Taiga Plains MB and Boreal and Taiga Cordillera had the smallest range. Temporally, variability in nf over the monitoring period was similar for each ecoregion (0.2–0.12) but was lowest for the two northern ecoregions and highest for the Taiga Plains MB and Boreal and Taiga Cordillera ecoregions. Within each ecoregion nf showed more temporal variation at sites with higher nf values. Average nt was more similar between ecoregions than nf. Like nf, the spatial range in nt was highest for the northern ecoregions (Tundra Plains LAn and Taiga Plains HS) and smallest for the Taiga Plains MB and Boreal and Taiga Cordillera ecoregions ( and ). The range in nt interannually was greatest for the Tundra Plains LAn and Boreal and Taiga Cordillera and smallest for the Taiga Plains MB ecoregion.
Table 4. Average nf and nt values and ALT for sites with data.
Figure 10. Box and whisker plot for the freezing n-factor (nf) and the thawing n-factor (nt) for each ecoregion. X represents the mean and the circle indicates the value of outliers (one and a half times the interquartile range).
Spatial and temporal variability in FDDg and TDDg was also observed between ecoregions. FDDg generally decreased from north to south (). Northern ecoregions also had the largest spatial variability in FDDg between sites. Interannually, the greatest range in FDDg occurred in the Taiga Plains HS ecoregion and the lowest was in the Taiga Plains MB ecoregion. Average TDDg exhibited a positive spatial trend from the northern ecoregions to the southern except for the Taiga Plains LS ecoregion, which only had one site. Temporally, the Boreal and Taiga Cordillera ecoregion showed the greatest variability in TDDg, whereas the Taiga Plains MB showed the least over the study period. Temporal trends for nf, nt, FDDg, and TDDg were difficult to determine due to data gaps and limited years with data.
Variable importance ranking in the random forest analysis identified FDDg, TDDg, and nf as the three most important factors determining ALT (in this order), followed by nt, FDDa, and, lastly, TDDa. For overall average ALT the MVLR analysis produced an r2 of 0.61, indicating that only FDDg was significant (p = .032). Using all measurements across all sites and years, FDDg, TDDg, and TDDa were all significant (p < .001 for FDDg and TDDg and p = .006 for TDDa) with an r2 of 0.45. When divided by ecoregion, the MVLR analysis showed variability in significant variables between ecoregions. For the Tundra Plains LAn ecoregion only TDDg was significant (p = .001, r2 = 0.55), whereas for the Taiga Plains MB ecoregion only FDDg was significant (p = .03, r2 = 0.46). The Taiga Plains HS and Boreal and Taiga Cordillera MVLR analysis showed FDDg and TDDg to be significant with p < .001 and p = .001 (r2 = 0.83) for Taiga Plains HS and p = .001 and 0.047 (r2 = 0.46) for the Boreal and Taiga Cordillera. The results indicate the importance of considering antecedent winter conditions when analyzing ALT, especially in the southern portion of the valley where they are shown to have a higher level of significance.
Site-specific
Site-specific changes in ALT and measured temperature parameters showed unique temporal changes over the duration of the study. At sites 91-TT-13 (Taiga Plains HS), 91-TT-22 (Taiga Plains LS), 92-TT-04 (Taiga Plains MB), and 92-TT-10 (B&T Cordillera), FDDg and nf showed a degree of variability through time (). Of these sites, 91-TT-13, 92-TT-04, and 92-TT-10 also showed increasing ALT through time (0.5, 1.7, and 0.5 cm yr−1, respectively). At site 92-TT-04 the increase in ALT over the study period corresponded with a drop in FDDg and nf as well as an apparent increase in nt and a large degree of interannual variation in TDDg. Sites 91-TT-22 and 92-TT-10 had limited ALT response and showed contrasting warming winter and cooling summer ground surface temperature trends.
Figure 11. Average ALT, TDDg, and nt and FDDg and nf for the preceding year. Slope and slope error for each series are given. (A) Site 90-TT-04 in the Tundra Plains LAn ecoregion. (B) Site 91-TT-13 in the Taiga Plains HS ecoregion. (C) Site 91-TT-22 in the Taiga Plains LS ecoregion. (D) Site 92-TT-04 in the Taiga Plains MB ecoregion. (E) Site 92-TT-10 Boreal and Taiga Cordillera.
Discussion
It is important to note that the spatial variability was greater within ecoregions than between ecoregions likely due to the variations in snow cover, vegetation, and substrate within each ecoregion that control ALT on a subecoregional scale (Bonnaventure and Lamoureux Citation2013). This highlights the difficulty in using general bioclimatic variables to broadly characterize ALT, particularly in areas dominated by shrubs. Given the high degree of spatial variability in shrub-dominated environments, an ecoregional approach may be inappropriate especially at a local scale. However, for broad-scale modeling studies of ALT, the ecoregional approach may still be advantageous because unique spatial and temporal patterns can still be discerned. This is largely a product of variation in the dominant influence on ALT between each ecoregion and will be explored further in the following sections.
FDD and TDD
The random forest and MVLR highlighted the importance of both winter and summer conditions on ALT. In previous studies the impact of winter conditions has been largely overlooked with an emphasis placed on using summer conditions, primarily TDDa, to infer about the state of the active layer (Shiklomanov and Nelson Citation2002; Mazhitova et al. Citation2004). However, in recent years the importance of antecedent winter conditions has been documented (Wilcox et al. Citation2019; Grünberg et al. Citation2020). This analysis reaffirms the importance of considering antecedent winter ground conditions in regional ALT studies, especially in more southern environments where those were shown to be most important.
Moving north to south, average ALT for ecoregions generally increases corresponding to a decrease in FDDa and increase in TDDa (). The exception to this trend is the average ALT in the Boreal and Taiga Cordillera (68 cm), which is similar to that of the Tundra Plains LAn (67 cm) despite the difference in FDDa (2954°C days in the Cordillera compared to 4480°C days in the Tundra Plains) and TDDa (2132°C days in the Cordillera compared to 934°C days in the Tundra Plains). However, the ground surface thermal conditions for each ecoregion show some similarity during the freezing (FDDg of 955°C days for the Cordillera and 1880°C days in the Tundra Plains) and thawing seasons (TDDg of 937°C days in the Cordillera and 456°C days for the Tundra Plains). The similarity in ALTs and the ground thermal regime (particularly the summer conditions) despite large differences in the air thermal regime is likely indicative of in influence of protective vegetation cover or organic material (Shur and Jorgenson Citation2007). Despite similar air thermal conditions, the difference in the average ALT (58 cm) for the two southernmost ecoregions (Boreal and Taiga Cordillera and Taiga Plains MB) was greater than the difference between the Boreal and Taiga Cordillera and the Tundra Plain LAn ecoregions (1 cm). This difference between the ALT of the two southernmost ecoregions is likely the result of mosses and organic material at sites in the Boreal and Taiga Cordillera that allow for the thin active layer despite less favorable air temperature (Bonnaventure and Lamoureux Citation2013). However, there are only a small number of sites with data in the Boreal and Taiga ecoregion, which may not be representative of the entire ecoregion.
Vegetation and snow cover dynamics
The impact of snow cover on the active layer and permafrost on a yearly scale is dependent on the timing, duration, thickness, structure, and physical and thermal properties of the snowpack (Hinkel and Nelson Citation2003; Ling and Zhang Citation2003; Zhang et al. Citation2005). The accumulation of snow cover in autumn and early winter is shown to have a strong influence on ground temperature by insulating the ground from the low winter air temperatures, resulting in warmer ground surface temperatures compared to locations with thin or no snow cover (Gold Citation1963; Goodrich Citation1982; Zhang Citation2005). Nf and FDDg values are often used to show air–ground surface winter connectivity, which is largely influenced by snow conditions at a site. Intersite variability in vegetation characteristics is one of the likely reasons for variability in ALT within the ecoregions and is consistent with other local studies (Fisher et al. Citation2016; S. L. Smith et al. Citation2016). Based on the variability in nt data this appears to partly explain a reason for the spatial variability between and within ecoregions.
A previous ecoregional assessment of nf in the Mackenzie Valley found that nf generally increased moving northward, largely indicating an increased connectivity between the air and ground surface at northern sites representing less and more dense snow cover (S. L. Smith et al. Citation2016). When comparing ecoregions, the same trend is apparent with the northernmost Tundra Plains LAn ecoregion having the highest mean nf and the southernmost Taiga Plains MB and Boreal Cordillera ecoregions having the lowest mean nf (). Within ecoregions lower nf values are associated with greater ALT because these sites experience warmer winter ground surface conditions than sites with high nf. Additionally, the variability in nf was highest in the Tundra Plains LAn ecoregion (), which was attributed to highly variable spatial snow cover within the ecoregion, likely due to the presence of shrubs at some sites which trap and retain blowing snow (Yang and Woo Citation1999; Sturm et al. Citation2001; Zhang Citation2005; Palmer, Burn, and Kokelj Citation2012; Bonnaventure, Lamoureux, and Favaro Citation2017; Garibaldi, Bonnaventure, and Lamoureux Citation2021). This combination of vegetation and snow cover may also explain why shrub-dominated ecoregions (Tundra Plains LAn and Taiga Plains HS) showed the greatest variability in ALT within ecoregions. Forest-dominated ecoregions likely show less interecoregional variability due to more uniform snow conditions. The greatest observed ALT and nf and nt variability in the Tundra Plains LAn ecoregion may also just be a result of a higher level of sampling sites (n = 30) compared to any other ecoregion. This allowed for a wider range of site characteristics to be sampled, giving this ecoregion the most robust variability of sites. Changes in site-specific ALT may also reflect changes in vegetation and snow cover dynamics.
Summer temperatures, represented by TDDa, TDDg, and the corresponding surface offset, nt, were also shown to influence ALT. Between ecoregions, nt decreased from the northern ecoregions to the southern ecoregions in response to changing vegetation conditions. nt is highest for the Tundra Plains LAn ecoregions due to the lack of shading during summer as a result of no tree cover and limited vegetation or topographic shadowing. This results in less uniform heating between the ground and the air and can be amplified when darker surface soils are present. In the southern forested ecoregions, nt is low due to shading effects of vegetation and also thicker organic layers muting the response of the ground temperatures to air temperatures through increased evaporation and differential thermal conductivity (Shur and Jorgenson Citation2007; Fisher et al. Citation2016).
At the northernmost sites, especially those in the Tundra Plains LAn ecoregion including 90-TT-04, there appears to be more of a direct link between FDDg and ALT as changes in some years (2007–2009) closely follow each other (). Additionally, there was no apparent negative trend in ALT despite a decrease in TDDg (). The influence of increases in TDDg was amplified moving southward as ALT responded more to changes in TDDg alone and in conjunction with changes in FDDg such as at sites 91-TT-22 and 92-TT-04 (). Additionally, the warming of the ground surface in winter at sites (decrease in FDDg) in the Taiga Plains MB ecoregion may reflect the increase in the overall snowfall of the area because the Fort Simpson climate station indicates about a 7 cm increase in snowfall per year over the study period (Chapin et al. Citation2005).
Because ALT is influenced by snow accumulation and vegetation, a disturbance or change in vegetation may result in changes to ALT through changes to snow entrapment or loss of shading, transpiration, and organic matter (Shur and Jorgenson Citation2007; Fisher et al. Citation2016; Way and Lapalme Citation2021). This was observed at site 92-TT-12 in the Taiga Plains LS ecoregion, which burned in a fire in 1995. In the twelve years following the fire, ALT increased by approximately 44 cm. This magnitude of change during this time frame is consistent with other studies examining active layer changes postfire (S. L. Smith, Riseborough, and Bonnaventure Citation2015; Holloway and Lewkowicz Citation2020; Holloway et al. Citation2020). At this site, the active layer thickening is likely the result of surface modification during the fire because no other site nearby or in the ecoregion shows this trend. An additional contributing factor to active layer development could be the presence of surface water that does not freeze to the ground surface, which can substantially keep the ground warm during winter, resulting in an overall warming effect (Harris Citation2002; Smith, Wolfe et al. Citation2009). This is likely the case at site 91-TT-C, which has been observed to occasionally flood.
Substrate
Substrate, particularly grain size, moisture, and ice content moderate ALT through latent heat exchanges and the differential thermal conductivity between the frozen and thawed state (S. L. Smith, Burgess, and Nixon Citation2001; Shur and Jorgenson Citation2007; O’Donnell et al. Citation2009; Bonnaventure and Lamoureux Citation2013). Surface subsidence results as thaw progresses deeper into ice-rich ground. Seasonal freeze–thaw of the active layer results in latent heat exchanges and seasonal heave and settlement. However, ongoing settlement can occur as the thaw progresses deeper over time, thawing new ice-rich material (O’Neill, Smith, and Duchesne Citation2019). Therefore, at sites with high excess ice content, ALT can remain relatively stable as melting of ground ice results in surface subsidence (Duchesne et al. Citation2015; O’Neill, Smith, and Duchesne Citation2019). Sites with thin active layers and very little annual variability are often associated with ice-rich material susceptible to thaw settlement.
The results indicate that sites with frost-susceptible substrate such as ice-rich silts and clay are often associated with higher subsidence than variability in ALT (). Conversely, sites with ice-poor sandy substrates often showed little subsidence compared to variability in ALT over the study period (Shur, Hinkel, and Nelson Citation2005). There was no pattern relating subsidence and ecoregion because the type of substrate and ice content varies widely within ecoregions, likely contributing to the intra-ecoregion ALT variability.
Figure 12. Comparison of ALT range and subsidence for each site classified based on substrate texture (Geological Survey of Canada data files updated from S. L. Smith, Riseborough et al. Citation2009). Subsidence was measured cumulatively over all years of observations. Range of ALT refers to the difference between the maximum and minimum ALT for all years at a site. Red symbols indicate the average subsidence for that substrate.
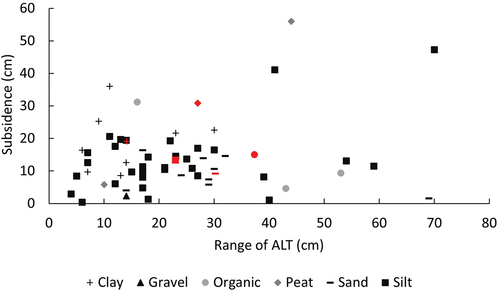
Some of the sites can be divided into four classes based on the range in ALT and subsidence (low ALT range high subsidence, low ALT range low subsidence, high ALT range low subsidence, high ALT range high subsidence). Examples of low ALT variability and high subsidence sites include 91-TT-11, which has a thin active layer (66 cm) with very little annual variability but with a surface subsidence of 25 cm (over nineteen years), and site 91-TT-02, which has similar active layer conditions and surface subsidence of 36 cm over seventeen years (Geological Survey of Canada data files updated from Smith, Riseborough et al. Citation2009). These sites both have fine-grained clay substrate, are low elevation, are flat, and are located in an area that has a medium potential for segregated ground ice content according to recent ground ice maps (O’Neill, Wolfe, and Duchesne Citation2019). At these sites, the high subsidence and consolidation of the thaw layer result in smaller changes in ALT. Sites with low ALT variation and low subsidence include 90-TT-01 and 90-TT-12; both have fine-grained, silt substrate with high ground ice content limiting the progression of thaw (O’Neill, Wolfe, and Duchesne Citation2019). These sites are two of the northernmost sites with two of the thinnest active layers. Therefore, it is possible that the low subsidence at these sites is a result of limited thaw penetration into the ice-rich layers of the substrate. A high range in ALT with low subsidence occurs at sites 90-TT-06, 91-TT-13, and 92-TT-05 likely due to limited ground ice. Site 90-TT-06 shows 6 cm subsidence over twenty years with a 30 cm range in ALT. Though this site has a small average ALT (48 cm), it has a sand substrate in which excess ice is unlikely to be present. Site 91-TT-13 is ice-poor silt, which may explain the limited subsidence (8 cm), large variation in ALT (39 cm over twenty-two years), and thick average active layer (134 cm). Lastly, sites with both high ALT variation and high subsidence such as 92-TT-03 and 92-TT-12 are likely in places where ice-rich material may have already thawed and consolidated early in the record. At 92-TT-03 little change in ALT (11 cm) and substantial subsidence (26 cm) occurred from 1994 to 2004, followed by larger changes in ALT (34 cm) and minimal subsidence from 2004 to 2014. This site is classified as ice-rich silt. A similar pattern occurs at 92-TT-12 with limited variation in ALT (28 cm) and substantial subsidence (43 cm) during the initial part of the record (1993–2001) followed by higher variability in ALT (up to 10 cm fluctuations between years) and minimal subsidence (8 cm). This site is classified as ice-rich peat. Higher ice contents are commonly found at the top of the permafrost (Shur, Hinkel, and Nelson Citation2005), and the larger subsidence observed earlier in the record is likely the result of thawing of this ice-rich material. As thaw progresses into material containing less ice, less subsidence occurs and larger variation in ALT is observed. Latent heat effects also decrease as thaw progresses into the lower ice-content material (Shur, Hinkel, and Nelson Citation2005).
Temporal trends in ALT
Potentially a key rationale for utilizing an ecoregional approach is the ability to assess broad temporal trends in ALT based on bioclimatic variables hypothesized to impact the response of permafrost to climate change (Shur and Jorgenson Citation2007). Using the three-year running means for all annual ALT in each ecoregion over the study period, only the Taiga Plains HS showed a strong positive trend in average ALT (r2 = 0.8) despite the positive air temperature trend in all regions (). ALT for the Tundra Plains LAn and Boreal and Taiga Cordillera showed a slight positive trend with low r2 values of 0.1 and 0.4, respectively. The Taiga Plains LS and Taiga Plains MB ecoregions showed a negative trend or no trend with low r2 values of 0.2 and 0.0, respectively. The trends may be impacted by the number of sites per ecoregion because an ecoregion with a smaller number of sites is more influenced by changes in individual sites than an ecoregion with a larger number of sites. In this case the trend or lack thereof would not be representative of the entire ecoregion. This is more likely to be the case in the Taiga Plains LS and MB ecoregions because they have fewer sites than the Taiga Plains HS and Tundra Plains LAn ecoregions and have one site with a substantially different ALT than the other sites in the ecoregion. The variation in ALT responses to similar warming throughout the valley may demonstrate the variable sensitivity to climatological or ecological disturbances depending on the ecoregion. For example, permafrost in most tundra environments is considered to be climate driven (e.g., Shur and Jorgenson Citation2007), and ALT in these ecoregions is a product of low air temperatures and is thus particularly susceptible to long-term changes in climate. This is due to a limited ecological buffer shielding the ground from the direct impacts of increasing air temperatures. The thickening of the active layer in the Taiga Plains HS ecoregion may demonstrate this however, the Tundra Plains LAn ecoregion did not show this same thickening, possibly as a result of higher ground ice (O’Neill et al. Citation2019). Other forested ecoregions with well-developed organic surface layers including those in the Boreal Cordillera can be classified as climate-driven, ecosystem-modified, and ecosystem-protected permafrost. Thus, the active layer is potentially less sensitive to short- or medium-term changes in air temperature but is more sensitive to vegetation disturbance including fire and hydrological and anthropogenic changes (Shur and Jorgenson Citation2007; Fisher et al. Citation2016). Therefore, it is unlikely that even on the time frame of this study or into the short-term future these locations will display a substantial response to climatic change through active layer thickening unless paired with substantial vegetation disturbance or pond or wetland expansion (Holloway and Lewkowicz Citation2020). This may explain why the ecoregions with more developed vegetation cover did not on average show a response over the monitoring period. As a result, the variability in response of the active layer depends on the type of disturbance and thus it is important to understand this in order to properly conceptualize the timing of associated landscape hazards, which may result from permafrost degradation.
Figure 13. Three-year running means for average active layer thickness for each ecoregion. R2, slope, and slope error are given for each series.
Summary and conclusions
ALT at monitoring sites throughout the Mackenzie Valley exhibits a great deal of spatial and temporal variability within and across ecoregions because ALT is a product of complex interactions between climate, vegetation, snow cover, and soil type. The Tundra Plains LAn ecoregion showed the largest spatial range in ALT, whereas the Taiga Plains MB ecoregion has the greatest average ALT. Thick active layers at certain sites in the Tundra Plains LAn and Taiga Plains HS ecoregions likely result from the increased accumulation of snow by willow shrubs, resulting in warmer ground conditions than tundra upland sites that are wind scoured and have thin active layers. This causes large ranges in ALT in these ecoregions. Generally, air temperature, including winter conditions, is the major influence because average ALT increases moving southward, a result of air temperature increase and greater ALT occurring in years with warmer winters and summers. However, the relative importance of winter and summer thermal conditions on ALT depends on the ecoregion. The characteristic vegetation type of an ecoregion may also be used as an explanation for the average ALT; however, this is more difficult to use because dominant vegetation may vary between sites within an ecoregion. Overall, winter conditions can have significant influence on ALT.
ALT at some sites was less responsive to shorter-term variation in air temperature, potentially due to the moderating effect of vegetation, organic layer, and snow. For these locations, disturbance, rather than changing air temperature, may have a larger impact on ALT due to the surface modification. Where ice-rich permafrost is present, increases in summer thaw due to warming and increased disturbance will likely result in increased ground subsidence. This subsidence may result in landscape changes that impact hydrology and drainage as well as ecosystems throughout the valley, potentially causing further changes in ALT, and increase permafrost degradation with increased ponding. Understanding the relation between ALT, climate, dominant vegetation type, and ecoregion is essential to assess how ALT will respond to changing air temperatures, snowfall, and vegetation under climate warming.
Supplemental Material
Download Zip (30.4 KB)Acknowledgments
Logistical support was provided by Polar Continental Shelf Program and Inuvik Research Institute. We are thankful for the support and assistance provided by communities in the Northwest Territories. Numerous colleagues have contributed to data collection over the years. We also thank A. Leblanc for review prior to submission. Data management and processing support was provided by J. Chartrand.
Disclosure statement
No potential conflict of interest was reported by the authors.
Supplementary material
Supplemental material for this article can be accessed on the publisher’s website.
Additional information
Funding
References
- Arctic Monitoring and Assessment Programme. 2017. Snow, water, ice and permafrost in the Arctic (SWIPA) 2017, xiv + 269. Oslo, Norway: Arctic Monitoring and Assessment Programme (AMAP).
- Aylsworth, J., I. Kettles, L. Dyke, and G. Brooks. 2000. Distribution of peatlands. In The physical environment of the Mackenzie Valley, Northwest Territories: A base line for the assessment of environmental change, Geological Survey of Canada Bulletin, vol. 547, 49–55.
- Aylsworth, J., M. Burgess, D. Desrochers, A. Duk-Rodkin, T. Robertson, and J. Traynor. 2000. Surficial geology, subsurface materials, and thaw sensitivity of sediments. In The physical environment of the Mackenzie Valley, Northwest Territories: A base line for the assessment of environmental change, vol. 547, 41–48.
- Bockheim, J. G., and K. J. Hall. 2002. Permafrost, active-layer dynamics and periglacial environments of continental Antarctica: Periglacial and permafrost research in the Southern Hemisphere. South African Journal of Science 98 (1–2):82–90.
- Bonnaventure, P. P., A. G. Lewkowicz, and C. Hillaire-Marcel. 2008. Mountain permafrost probability mapping using the BTS method in two climatically dissimilar locations, northwest Canada. Canadian Journal of Earth Sciences 45 (4):443–55. doi:10.1139/E08-013.
- Bonnaventure, P. P., and S. F. Lamoureux. 2013. The active layer: A conceptual review of monitoring, modelling techniques and changes in a warming climate. Progress in Physical Geography 37 (3):352–76. doi:10.1177/0309133313478314.
- Bonnaventure, P. P., S. F. Lamoureux, and E. A. Favaro. 2017. Over‐winter channel bed temperature regimes generated by contrasting snow accumulation in a high Arctic River. Permafrost and Periglacial Processes 28 (1):339–46. doi:10.1002/ppp.1902.
- Burn, C. R., and C. A. S. Smith. 1988. Observations of the “Thermal Offset” in near-surface mean annual ground temperatures at several sites near Mayo, Yukon Territory, Canada. Arctic 41 (2):99–104. doi:10.14430/arctic1700.
- Chapin, F. S., M. Sturm, M. C. Serreze, J. P. McFadden, J. R. Key, A. H. Lloyd, J. M. Welker, T. S. Rupp, A. H. Lynch, and J. P. Schimel. 2005. Role of land-surface changes in Arctic summer warming. Science 310 (5748):657–60. doi:10.1126/science.1117368.
- Duchesne, C., D. W. Riseborough, and S. L. Smith. 2014. Air and near surface ground temperatures, indices, and summary statistics from 1993 to 2012 for the Mackenzie Valley Corridor, Northwest Territories. Natural Resources Canada. ( Open File 7392). https://doi.org/10.4095/294835
- Duchesne, C., S. L. Smith, M. Ednie, and P. P. Bonnaventure. 2015. Active layer variability and change in the Mackenzie Valley, Northwest Territories. Paper presented at the Proceeding 68th Canadian Geotechnical Conference and Seventh Canadian Conference on Permafrost (GEOQuébec 2015), Quèbec City, Quèbec.
- Ecoregions Working Group. 1989. Ecoclimatic regions of Canada, first approximation. Ecological Land Classification Series No. 23, Environment Canada, Canadian Wildlife Service, Sustainable Development Branch.
- Ecosystem Classification Group. 2007. Ecological regions of the Northwest Territories – Taiga Plains. Yellowknife, NT: Department of Environment and Natural Resources, Government of the Northwest Territories. viii + 173 pp. + folded insert map.
- Ecosystem Classification Group. 2010. Ecological regions of the Northwest Territories – Cordillera. Yellowknife, NT: Department of Environment and Natural Resources, Government of the Northwest Territories. x + 245 pp. + insert map.
- Ecosystem Classification Group. 2012. Ecological regions of the Northwest Territories – Southern Arctic. Yellowknife, NT: Department of Environment and Natural Resources, Government of the Northwest Territories. x + 170 pp. + insert map.
- Environment Canada-historical data - climate - environment and climate change Canada. 2017. Government of Canada. https://climate.weather.gc.ca/historical_data/search_historic_data_e.html
- Evans, B. M., D. A. Walker, C. S. Benson, E. A. Nordstrand, and G. W. Petersen. 1989. Spatial interrelationships between terrain, snow distribution and vegetation patterns at an Arctic foothills site in Alaska. Ecography 12 (3):270–78. doi:10.1111/j.1600-0587.1989.tb00846.x.
- Fisher, J. P., C. Estop-Aragonés, A. Thierry, D. J. Charman, S. A. Wolfe, I. P. Hartley, J. B. Murton, M. Williams, and G. K. Phoenix. 2016. The influence of vegetation and soil characteristics on active-layer thickness of permafrost soils in boreal forest. Global Change Biology 22:3127–40. doi:10.1111/gcb.13248.
- Garibaldi, M. C., P. P. Bonnaventure, and S. F. Lamoureux. 2021. Utilizing the TTOP model to understand spatial permafrost temperature variability in a high Arctic landscape, Cape Bounty, Nunavut, Canada. Permafrost and Periglacial Processes 32 (1):19–34. doi:10.1002/ppp.2086.
- Gold, L. W. 1963. Influence of the snow cover on the average annual ground temperature at Ottawa. Canada: Division of Building Research, National Research Council.
- Goodrich, L. 1982. The influence of snow cover on the ground thermal regime. Canadian Geotechnical Journal 19 (4):421–32. doi:10.1139/t82-047.
- Grünberg, I., E. J. Wilcox, S. Zwieback, P. Marsh, and J. Boike. 2020. Linking tundra vegetation, snow, soil temperature, and permafrost. Biogeosciences 17:4261–79. doi:10.5194/bg-17-4261-2020.
- Harris, S. A. 2002. Causes and consequences of rapid thermokarst development in permafrost or glacial terrain. Permafrost and Periglacial Processes 13 (3):237–42. doi:10.1002/ppp.419.
- Heginbottom, J. A., M.-A. Dubreuil, and P. A. Harker. 1995. Canada – Permafrost; National Atlas of Canada. 5th ed. Ottawa: Geomatics Canada, National Atlas Information Service, and Geological Survey of Canada. Plate 2.1 (MCR 4177).
- Hinkel, K. M., F. Paetzold, F. E. Nelson, and J. G. Bockheim. 2001. Patterns of soil temperature and moisture in the active layer and upper permafrost at Barrow, Alaska: 1993–1999. Global and Planetary Change 29 (3):293–309. doi:10.1016/S0921-8181(01)00096-0.
- Hinkel, K. M., and F. E. Nelson. 2003. Spatial and temporal patterns of active layer thickness at Circumpolar Active Layer Monitoring (CALM) sites in northern Alaska, 1995–2000. Journal of Geophysical Research: Atmospheres (1984–2012) 108(D2. doi:10.1029/2001JD000927.
- Holloway, J. E., and A. G. Lewkowicz. 2020. Half a century of discontinuous permafrost persistence and degradation in western Canada. Permafrost and Periglacial Processes 31 (1):85–96. doi:10.1002/ppp.2017.
- Holloway, J. E., A. G. Lewkowicz, T. A. Douglas, X. Li, M. R. Turetsky, J. L. Baltzer, and H. Jin. 2020. Impact of wildfire on permafrost landscapes: A review of recent advances and future prospects. Permafrost and Periglacial Processes 31 (3):371–82. doi:10.1002/ppp.2048.
- Klene, A. E., F. E. Nelson, N. I. Shiklomanov, and K. M. Hinkel. 2001. The N-factor in natural landscapes: Variability of air and soil-surface temperatures, Kuparuk River Basin, Alaska, U.S.A. Arctic, Antarctic, and Alpine Research 33 (2):140–48. doi:10.2307/1552214.
- Ling, F., and T. Zhang. 2003. Impact of the timing and duration of seasonal snow cover on the active layer and permafrost in the Alaskan Arctic. Permafrost and Periglacial Processes 14 (2):141–50. doi:10.1007/s11629-013-2893-0.
- Loranty, M. M., B. W. Abbott, D. Blok, T. A. Douglas, H. E. Epstein, B. C. Forbes, B. M. Jones, A. L. Kholodov, H. Kropp, A. Malhotra, et al. 2018. Reviews and syntheses: Changing ecosystem influences on soil thermal regimes in northern high-latitude permafrost regions. Biogeosciences 15:5287–313. doi:10.5194/bg-15-5287-2018.
- Mackay, J. R. 1973. A frost tube for the determination of freezing in the active layer above permafrost. Canadian Geotechnical Journal 10 (3):392–96. doi:10.1139/t73-033.
- Mazhitova, G., G. Malkova, O. Chestnykh, D. Zamolodchikov. 2004. Active layer spatial and temporal variability at European Russian Circumpolar-Active-Layer-Monitoring (CALM) sites. Permafrost and Periglacial Processes 15: 123–39. doi:10.1002/ppp.484.
- Morse, P. D., C. R. Burn, and S. V. Kokelj. 2012. Influence of snow on near-surface ground temperatures in upland and alluvial environments of the outer Mackenzie Delta, Northwest Territories. Canadian Journal of Earth Sciences 49 (8):895–913. doi:10.1139/e2012-012.
- Nixon, F. M., and A. Taylor. 1994. Active layer monitoring in natural environments, Mackenzie Valley, Northwest Territories. Current Research, Geological Survey of Canada:27–34.
- Nixon, F. M., and A. E. Taylor. 1998. Regional active layer monitoring across the sporadic, discontinuous and continuous permafrost zones, Mackenzie Valley, northwestern Canada. In Proceedings of the Seventh International Conference on Permafrost, 815–20. Québec: Centre d’Etudes Nordiques, Université Laval.
- O’Donnell, J. A., V. E. Romanovsky, J. W. Harden, and A. D. McGuire. 2009. The effect of moisture content on the thermal conductivity of moss and organic soil horizons from black spruce ecosystems in interior Alaska. Soil Science 174 (12):646–51. doi:10.1097/SS.0b013e3181c4a7f8.
- O’Neill, H. B., S. L. Smith, C. Duchesne. 2019. Long-term permafrost degradation and thermokarst subsidence in the Mackenzie Delta area indicated by thaw tube measurements. In Cold regions engineering 2019, Proceedings of the 18th International Conference on Cold Regions Engineeringand the 8th Canadian Permafrost Conference, ed. J.-P. Bilodeau, D. F. Nadeau, D. Fortier, and D. Conciatori, 643–51. Quebec, Quebec: American Society of Civil Engineers.
- O’Neill, H. B., S. A. Wolfe, and C. Duchesne. 2019. New ground ice maps for Canada using a paleogeographic modelling approach. The Cryosphere 13 (3):753–73. doi:10.5194/tc-13-753-2019.
- Obu, J., S. Westermann, A. Bartsch, N. Berdnikov, H. H. Christiansen, A. Dashtseren, R. Delaloye, et al. 2019. Northern Hemisphere permafrost map based on TTOP modelling for 2000–2016 at 1 km2 scale. Earth-Science Reviews 193:299–316. doi:10.1016/j.earscirev.2019.04.023.
- Palmer, M., C. Burn, and S. Kokelj. 2012. Factors influencing permafrost temperatures across tree line in the uplands east of the Mackenzie Delta, 2004–2010. Canadian Journal of Earth Sciences 49 (8):877–94. doi:10.1139/e2012-002.
- RStudio Team. 2020. RStudio: Integrated Development for R. Boston, MA: RStudio, PBC. http://www.rstudio.com/
- Shiklomanov, N. I., and F. E. Nelson. 2002. Active-layer mapping at regional scales: A 13-year spatial time series for the Kuparuk region, north-central Alaska. Permafrost and Periglacial Processes 13:219–30. doi:10.1002/ppp.425.
- Shiklomanov, N. I., D. A. Streletskiy, F. E. Nelson, R. D. Hollister, V. E. Romanovsky, C. E. Tweedie, J. G. Bockheim, and J. Brown. 2010. Decadal variations of active-layer thickness in moisture-controlled landscapes, Barrow, Alaska. Journal of Geophysical Research: Biogeosciences 115 (G4). doi:10.1029/2009JG001248.
- Shur, Y. L., K. M. Hinkel, and F. E. Nelson. 2005. The transient layer: Implications for geocryology and climate‐change science. Permafrost and Periglacial Processes 16 (1):5–17. doi:10.1002/ppp.518.
- Shur, Y. L., and M. T. Jorgenson. 2007. Patterns of permafrost formation and degradation in relation to climate and ecosystems. Permafrost and Periglacial Processes 18 (1):7–19. doi:10.1002/ppp.582.
- Smith, M. W., and D. W. Riseborough. 1996. Permafrost monitoring and detection of climate change. Permafrost and Periglacial Processes 7 (4):301–09. doi:10.1002/(sici)1099-1530(199610)7:4<301::aid-ppp231>3.0.co;2-r.
- Smith, S. L., M. Burgess, and F. Nixon. 2001. Response of active-layer and permafrost temperatures to warming during 1998 in the Mackenzie Delta, Northwest Territories and at Canadian Forces Station Alert and Baker Lake, Nunavut. Natural Resources Canada, Geological Survey of Canada. doi:10.4095/212685.
- Smith, M. W., and D. W. Riseborough. 2002. Climate and the limits of permafrost: A zonal analysis. Permafrost and Periglacial Processes 13 (1):1–15. doi:10.1002/ppp.410.
- Smith, S. L., S. A. Wolfe, D. W. Riseborough, and F. M. Nixon. 2009. Active‐layer characteristics and summer climatic indices, Mackenzie Valley, Northwest Territories, Canada. Permafrost and Periglacial Processes 20 (2):201–20. doi:10.1002/ppp.651.
- Smith, S. L., D. W. Riseborough, F. M. Nixon, J. Chartrand, C. Duchesne, and M. Ednie. 2009. Data for Geological Survey of Canada active layer monitoring sites in the Mackenzie Valley, N.W.T., Geological Survey of Canada. Open File 6287, 100. 1 CD-ROM. doi:10.4095/248197.
- Smith, S. L., D. W. Riseborough, and P. P. Bonnaventure. 2015. Eighteen year record of forest fire effects on ground thermal regimes and permafrost in the central Mackenzie Valley, NWT, Canada. Permafrost and Periglacial Processes 26 (4):289–303. doi:10.1002/ppp.1849.
- Smith, S. L., D. W. Riseborough, P. P. Bonnaventure, and C. Duchesne. 2016. An ecoregional assessment of freezing season air and ground surface temperature in the Mackenzie Valley corridor, NWT, Canada. Cold Regions Science and Technology 125 (Supplement C):152–61. doi:10.1016/j.coldregions.2016.02.007.
- Sturm, M., J. Holmgren, J. P. McFadden, G. E. Liston, F. S. Chapin III, and C. H. Racine. 2001. Snow–shrub interactions in Arctic tundra: A hypothesis with climatic implications. Journal of Climate 14 (3):336–44. doi:10.1175/1520-0442(2001)014<0336:SSIIAT>2.0.CO;2.
- Tarnocai, C., F. Mark Nixon, and L. Kutny. 2004. Circumpolar-Active-Layer-Monitoring (CALM) sites in the Mackenzie Valley, northwestern Canada. Permafrost and Periglacial Processes 15 (2):141–53. doi:10.1002/ppp.490.
- Wang, T., A. Hamann, D. Spittlehouse, C. Carroll, and I. Álvarez. 2016. Locally downscaled and spatially customizable climate data for historical and future periods for North America. PLoS ONE 11 (6):e0156720. doi:10.1371/journal.pone.0156720.
- Way, R. G., and C. M. Lapalme. 2021. Does tall vegetation warm or cool the ground surface? Constraining the ground thermal impacts of upright vegetation in northern environments. Environmental Research Letters 16 (5):54077. doi:10.1088/1748-9326/abef31.
- Wilcox, E. J., D. Keim, T. de Jong, B. Walker, O. Sonnentag, A. E. Sniderhan, P. Mann, and P. Marsh. 2019. Tundra shrub expansion may amplify permafrost thaw by advancing snowmelt timing. Arctic Science 5:202–17. doi:10.1139/as-2018-0028.
- Yang, D., and M. K. Woo. 1999. Representativeness of local snow data for large scale hydrologic investigations. Hydrological Processes 13 (12‐13):1977–88. doi:10.1002/(SICI)1099-1085(199909)13:12/13<1977::AID-HYP894>3.0.CO;2-B.
- Yi, Y., J. S. Kimball, R. H. Chen, M. Moghaddam, R. H. Reichle, U. Mishra, D. Zona, and W. C. Oechel. 2018. Characterizing permafrost active layer dynamics and sensitivity to landscape spatial heterogeneity in Alaska. The Cryosphere 12:145–61. doi:10.5194/tc-12-145-2018.
- Young, K. L., M.-K. Woo, and S. A. Edlund. 1997. Influence of local topography, soils, and vegetation on microclimate and hydrology at a high Arctic site, Ellesmere Island, Canada. Arctic and Alpine Research 29 (3):270–84. doi:10.2307/1552141.
- Zhang, T. 2005. Influence of the seasonal snow cover on the ground thermal regime: An overview. Reviews of Geophysics 43 (4):n/a–n/a. doi:10.1029/2004RG000157.
- Zhang, T., O. W. Frauenfeld, M. C. Serreze, A. Etringer, C. Oelke, J. McCreight, R. G. Barry, D. Gilichinsky, D. Yang, H. Ye, et al. 2005. Spatial and temporal variability in active layer thickness over the Russian Arctic drainage basin. Journal of Geophysical Research: Atmospheres 110(D16). doi:10.1029/2004JD005642.