
 ?Mathematical formulae have been encoded as MathML and are displayed in this HTML version using MathJax in order to improve their display. Uncheck the box to turn MathJax off. This feature requires Javascript. Click on a formula to zoom.
ABSTRACT
Regions in high latitudes are experiencing greater climate change than other regions. In this study, the impact of temperature and precipitation on the yield of fifteen cultivars (eight barley [Hordeum vulgare], four oat [Avena sativa], and three wheat [Triticum aestivum]) from a small grain field experiment in Fairbanks and Delta Junction, Alaska, from 1978 to 2018 were analyzed to evaluate their sensitivity to variation in climate that occurred during this period. Using first-difference time series of log yield change and the changes of determinant weather (maximum and minimum temperatures and precipitation) as variables, linear regression and Bayesian simulation models were fitted for analysis. Results showed that of fifteen cultivars, two barley and one wheat had a consistent yield reduction (p < .05) in both locations over the test period. The remaining cultivars, though they experienced a yield reduction, the degree of the change varied by individual cultivar depending on the location (from −10.3 to 4.1 percent). For impact of temperature and precipitation, the majority of cultivars of three small grains decreased in yield (2.4–22.5 percent per degree) with elevated temperature but increased in yield (2.4–6.0 percent per centimeter) with higher precipitation. Over the growing season, increased temperatures and reduced total precipitation in June and July reduced the yields of cultivars. The results suggest that cultivar response to climate change differed by location. Nevertheless, elevated temperature and lower precipitation appear to be the variables causing a decrease in yield. Therefore, selection of cultivars under climate change scenarios in different locations is imperative, and this study provides insight for future small grain cultivar selections in Alaska.
KEYWORDS:
Introduction
Climate change has negative impacts on crop yields in a great range of regions and crops, but at higher latitudes reports showed negative impacts in some regions and positive impacts in others (Kurukulasuriya and Rosenthal Citation2013; Intergovernmental Panel on Climate Change Citation2014). In Finland, the yield of spring cereals tended toward a 5 to 6 percent decrease in the warmer condition (Peltonen-Sainio, Jauhiainen, and Kakala Citation2011). In Norway, based on crop data from 1958 to 2001, increased growing degree days in western and central Norway and in Nordland increased the yields of barley and oats but increased precipitation decreased the yields (Torvanger, Twena, and Romstad Citation2014). In Sweden, changing climate had a positive effect on winter wheat yield in Gotland and a substantial part of Uppsala County (Eckersten et al. Citation2010). Nevertheless, research on crop yield affected by climate change has focused on the crop as a whole with only a few reports on effects at the cultivar level (Hakala et al. Citation2012; Klink et al. Citation2014).
Temperature and precipitation are two major climate factors that affect small grain production. In the Northern Plains of the United States and Canada, the reduction in barley and oat yields from 1980 to 2012 was attributed to the high temperature and low precipitation during growing season (Klink et al. Citation2014). In Finland, drought and the elevated temperature were responsible for crop losses (Peltonen-Sainio, Jauhiainen, and Kakala Citation2011; Peltonen-Sainio et al. Citation2016). In Atlantic Canada, the increased effective growing degree days and water deficit caused a reduction in barley yield (Bootsma, Gameda, and McKenney Citation2005). Critical knowledge on how the temperature and precipitation trends impact small grain production in Alaska has not been well documented, although Sharratt, Knight, and Wooding (Citation2003) identified precipitation as the most important climate factor for the yields of barley and oat, and minimum temperature was the most important factor for the yield of wheat.
The climate in Alaska is complicated and varies greatly from location to location. Alaska is one of the regions most sensitive to climate change in the United States, with a 1°C increase statewide since 1920 (Bieniek and Walsh Citation2014) and a 1.9°C increase in summer time over the period 1949 to 2005 (Shulski and Wendler Citation2007). Climate change in Alaska has caused earlier spring snowmelt, extending the growing season and resulting in greater growth of trees (Hinzman et al. Citation2005). However, the impact of climate change on yields of small grain cultivars is not well documented in Alaska.
Understanding the effect of climate change on yield of crops is important for Alaskan agriculture from breeders to farmers because only a small amount (2.1 percent) of cultivable land is used for agriculture (U.S. Department of Agriculture, National Resources Conservation Service Citation2014). In addition, only a few crops, such as barley (Hordeum vulgare L.), oat (Avena sativa L.), wheat (Triticum aestivum L.), potato (Solanum tuberosum L.), and some vegetables, can grow in limited farmland in Alaska because of the short growing season. Therefore, it is critical to understand how climate change impacts crop yields and find ways (new cultivars and management practices) to mitigate the effect of climate change on crop production within the specific region and keep crop yields in Alaska stable and high.
Small grain cultivar trials have been conducted at Fairbanks and Delta Junction by University of Alaska Fairbanks since the 1970s. Some standard cultivars have been tested and grown in Alaska since then. There is a lot of information related to cultivars, such as sowing dates, emergence dates, flowering dates, maturity dates, and yields, from the trials. In addition, climate data at research sites are available.
The purpose of this study is to understand how climate affects cultivar yield, and the objectives are to (1) analyze the yield trends of fifteen cultivars, including eight barley, four oat, and three spring wheat cultivars; (2) determine how climatic parameters impact the yields of cultivars; and (3) determine the best empirical model for each cultivar and interpret which variables are important to that cultivar.
Materials and methods
Crop data
Cultivar yields from small grain test trials
Cultivar yield data from 1978 to 2018 were obtained from the Alaska Small Grain Cultivar Trials Archives for Fairbanks and Delta Junction. The test site in Fairbanks (64.83°N, 147.77°W) was located on the lower fields of the Agricultural and Forestry Experiment Station Fairbanks Experiment Farm on West Tanana Drive on the University of Alaska Fairbanks campus. The test site in Delta Junction (64.05°N, 145.60°W) was at the University of Alaska Fairbanks Agricultural Forestry Experiment Station Delta Field Research Site at mile 1408 of the Alaska Highway, 14 miles southeast of Delta Junction. The experimental design was a randomized complete block with three replications. In the trial, the area of each plot was 180 ft2 or 0.0017 ha. The yield of each cultivar was the average of three plots. Fifteen cultivars representing three crops (barley, oat, and wheat) were selected for analysis. Of these cultivars, eight, including ‘Albright,’ ‘Datal,’ ‘Eero,’ ‘Finaska,’ ‘Lidal,’ ‘Otal,’ ‘Thual,’ and ‘Weal,’ were barley; four, ‘Athabasca,’ ‘Cascade,’ ‘Nip,’ and ‘Toral,’ were oat; and three, ‘Ingal,’ ‘Nogal’ and ‘Roblin,’ were wheat. The standard for selecting the cultivar in this study was that each cultivar had at least ten years of data for Fairbanks and Delta Junction ().
Table 1. Average and standard deviation of variety yield, flowering and maturity dates, and the number of testing years of eight varieties of barley, four of oat, and three of wheat in Delta Junction and Fairbanks, Alaska.
Weather data
Sharratt, Knight, and Wooding (Citation2003) reported that precipitation and minimum temperature in June and July were two important factors that impact small grain production in the subarctic region. In order to compare the results from this study with previous study and keep the weather at the same condition in Fairbanks and Delta Junction, weather data for June and July were selected. In addition, a previous report showed that the effect of climate change on crop yields is not sensitive to the chosen growing season (Lobell, Cahill, and Field Citation2007). Therefore, June and July were selected to analyze the effect of weather on cultivar yield instead of using the period from sowing to maturity. The daily minimum, maximum, and average temperature and precipitation in Fairbanks Airport and Delta Junction Airport were downloaded from Data Tools: Local Climatological Data of the National Center for Environmental Information (Young et al. Citation2018; ncdc.noaa.gov/cdo-web/datatools/lcd; https://www.ncei.noaa.gov/access/us-climate-normals/). The mean minimum temperature (Tmin), mean maximum temperature (Tmax), and cumulative precipitation total (Ptot) for June and July were computed accordingly. The test site in Fairbanks was 4 miles from Fairbanks Airport and the test site in Delta Junction was 14 miles from Delta Junction Airport.
Determination of cultivar yield changes
Due to the limited historical sample size in some cultivars, a Bayesian simulation approach was used to estimate the sampling uncertainty associated with the derived regression coefficients. The cultivar yield was computed using logarithmic transformation to avoid heteroscedasticity. The yield trend of each cultivar was analyzed using linear regression with the “lm” function in R v4.0.0 (R Core Team Citation2020) and the median of coefficients was estimated using the “sim” function in package “arm” by a Bayesian simulation (n = 500; Korner-Nievergelt et al. Citation2015). The yield trends were expressed as percentage change in yield per year because log (yieldyear) − log (yieldyear-1) is equal to log(yieldyear/yieldyear-1) (Verón, de Abelleyra, and Lobell Citation2015).
Crop sensitivity to weather parameters
In this study, the first-difference time series of log (yield) (ΔLogY) and weather parameters (ΔTmin, ΔTmax, and ΔPtot) over the period June to July were computed using the equation Xdiff = X(t) − X(t-1) (where Xdiff is the difference between the test year and previous year, t is the test year, t − 1 is the previous year, and t > 1) to reduce the confounding nonclimatic effect (Lobell, Cahill, and Field Citation2007). Time series linear regression models were used to estimate the sensitivity of cultivar yield to climatic parameters. The following model was used to evaluate the sensitivity of cultivar yield to year-to-year change in Tmin, Tmax, and Ptot:
where ∆LogYi is the first difference in log(yield) of cultivar I; ∆Xi is the first difference of Tmin, Tmax, or Ptot (ΔTmin, ΔTmax, or ΔPtot); β0 is the intercept of the model; and β1 is the sensitivity of cultivar yield to Tmin, Tmax, and Ptot. The sensitivity is expressed as the percentage change of yield per 1°C or 1 cm increase. The coefficient β1 was estimated by a Bayesian simulation as described above (Korner-Nievergelt et al. Citation2015).
The variance of cultivar yield explained by weather parameters
Weather parameters precipitation and minimum temperature are important weather factors that affect the production of barley, oat, and wheat in subarctic regions (Sharratt, Knight, and Wooding Citation2003). To investigate the uncertainty and accountability of weather parameters for cultivar yield, ∆Tmax, ∆Tmin, and ∆Ptot were selected as independent variables and a multilinear regression model was fit as
where ΔLogY is the first-difference value of time series Log(Yield); ΔTmin, ΔTmax, and ΔPtot are the first-difference values of time series of weather parameters over the period June to July; β0-3 are coefficients that represent the sensitivity of yield to temperatures and precipitation; and ε is the error. In order to reduce the multicollinearity, ΔTmin, ΔTmax, and ΔPtot were standardized by using the “scale” function in R v4.0.0 (R Core Team Citation2020). The models were fit using the “lm” function and the best fit models were selected from full models (two) using the “stepAIC” function in the “MASS” package in R v4.0.0 (R Core Team Citation2020). The selection was used both directions (forward selection from intercept model and backward selection from the full model, i.e. equation 2) and the model with the lowest Akaike information criterion was selected as the best model. The variance in yield explained by climate was assessed for each cultivar by computing the coefficient of determination (R2).
Results
Cultivar yield loss per year
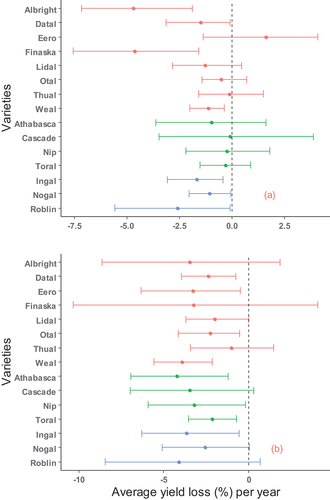
The cultivar yields in Fairbanks were higher than those in Delta Junction (). In general, all cultivars except ‘Eero’ in Fairbanks showed a decreased yield trend from 1978 to 2018. The percentage of yield losses varied with location and cultivar. More cultivars in Delta Junction (ten out of fifteen) than in Fairbanks (seven out of fifteen) showed significantly reduced yield (p < .05; ). Of fifteen cultivars, the yields of four cultivars, two barley (‘Datal’ and ‘Weal’) and two wheat (‘Ingal’ and ‘Nogal’), were significantly reduced in both Fairbanks and Delta Junction. The yield losses of nine cultivars were statistically significant in both Fairbanks and Delta Junction (p < .05; ). The highest median yield loss in Fairbanks was for two barley cultivars, ‘Albright’ (2.09 percent per year) and ‘Finaska’ (2.06 percent per year), whereas in Delta Junction the cultivar with the highest yield losses was oat ‘Athabasca’ (1.88 percent per year).
Figure 1. Average yield change per year of barley (‘Albright,’ ‘Datal,’ ‘Eero,’ ‘Finaska,’ ‘Lidal,’ ‘Otal,’ ‘Thual,’ and ‘Weal’) (red), oat (‘Athabasca,’ ‘Cascade,’ ‘Nip,’ and ‘Toral’) (green), and wheat (‘Ingal,’ ‘Nogal,’ and ‘Roblin’) (blue) in (a) Fairbanks and (b) Delta Junction from 1978 to 2018. The bars indicate 95 percent credible interval of yield loss based on a Bayesian simulation (n = 500).
Effect of weather on cultivar yields
Overall, increased temperatures (Tmax and Tmin) and decreased Ptot reduced cultivar yield (). The yield loss per 1°C increase in temperature or 1 cm decrease in precipitation depended on location. The yields of one barley cultivar (‘Eero’) and three oat cultivars (‘Athabasca,’ ‘Cascade,’ and ‘Nip’) in Fairbanks and the yields of three oat cultivars (‘Athabasca,’ ‘Cascade,’ and ‘Toral’) in Delta Junction were not significantly affected by either temperature or precipitation (p < .05; ). The yields of all others were significantly affected by either temperature or precipitation in Fairbanks and Delta Junction ().
Figure 2. Median cultivar yield loss (%) for 1°C (average, maximum, and minimum temperature) or 1 cm cumulative precipitation increase over the period June to July from 1978 to 2018 in Fairbanks (a, c, d) and Delta Junction (b, d, f). ‘Albright,’ ‘Datal,’ ‘Eero,’ ‘Finaska,’ ‘Lidal,’ ‘Otal,’ ‘Thual,’ and ‘Weal’ are barley (red); ‘Athabasca,’ ‘Cascade,’ ‘Nip,’ and ‘Toral’ are oat (green); ‘Ingal,’ ‘Nogal,’ and ‘Roblin’ are wheat (blue). ∆Yield indicates percentage loss of yield. Bars represent 95 percent credible interval calculated from Bayesian simulation (n = 500).
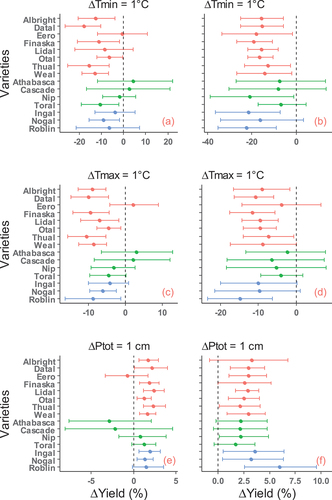
The responses of cultivar yield to temperature and precipitation changes varied by crop and location. Of eight barley cultivars, the yields of six (‘Albright,’ ‘Datal,’ ‘Finaska,’ ‘Otal,’ ‘Thual,’ and ‘Weal’) were reduced significantly in response to warmer temperature (Tmax and Tmin) and the yields of four (‘Datal,’ ‘Otal,’ ‘Thual,’ and ‘Weal’) increased significantly in response to increased precipitation in both Fairbanks and Delta Junction (p < .05; ). Of four oat cultivars, the yield of ‘Nip’ in Delta Junction and the yield of ‘Toral’ in Fairbanks were reduced significantly only when Tmin increased in both Delta Junction and Fairbanks (p < .05; ). Of three wheat cultivars, the yield of ‘Ingal’ did not change in Fairbanks but decreased in Delta Junction significantly when Tmin increased. The yield of ‘Ingal’ increased when Ptot increased in both Fairbanks and Delta Junction. The yield of ‘Nogal’ was reduced significantly in Fairbanks but did not change in Delta Junction when temperature (Tmin and Tmax) increased. The yield of ‘Nogal’ increased significantly when Ptot increased in both locations. The yield of ‘Roblin’ decreased significantly only when Tmax increased in Fairbanks and its yield changed significantly in Delta Junction when Tmin, Tmax, and Ptot increased (p < .05; ).
The yield variance explained by climatic parameters
The variances in cultivar yield can be explained by zero to three climate parameters based on statistical models (). Of thirty best-fitted cultivar models, fourteen variety models can be explained by one climate parameter (Tmax, Tmin, or Ptot). Eleven were explained by two climate parameters (Tmax + Tmin, Tmax + Ptot, or Tmin + Ptot). Only two yield models were explained by Tmax + Tmin + Ptot. Three cultivar models showed that yield was not affected by either temperature or precipitation over the period June to July. More Tmin and Ptot variables than Tmax were included in the yield model ().
Table 2. The equations and R2 of the best-fitted cultivar models derived from full models ∆LogY = ∆Tmax + ∆Tmin + ∆Ptot.
The models showed that temperature and precipitation explain over 50 percent of the variance of barley yield except ‘Eero’ and ‘Otal’ in Fairbanks and ‘Thual’ in both Fairbanks and Delta Junction. However, for the yields of oat and wheat, only a 50 percent variance in yield of ‘Roblin’ can be explained by temperature and precipitation ().
Discussion
Every crop has its own optimal condition for growth and production. The period around heading/flowering is the growth stage most vulnerable to extreme weather conditions that impact crop yield (Luo Citation2011). The cultivar yield losses in Fairbanks and Delta Junction may be partly attributed to the increased temperature in June to July based on the results from this study. For example, most cultivars in Fairbanks and Delta Junction flowered at the end of June and the beginning of July (). Furthermore, the increased Tmin trends were found in June to July in Fairbanks and Delta Junction () and Tmin appeared in approximately half of cultivar yield equations (fourteen out of thirty; ). This finding agrees with previous reports that wheat yield loss was due to the increased temperature from booting to anthesis and three to fifteen days after anthesis (Lizana and Calderini Citation2013), and cereal yield losses in Finland were due to higher temperatures in pre-heading and early grain filling (Peltonen-Sainio, Jauhiainen, and Kakala Citation2011; Peltonen-Sainio et al. Citation2016).
The results of this study suggest that the yield losses of barley and wheat may be attributed to temperature and precipitation but the yield change of oat may be attributed to either temperature (Tmax and Tmin) or Ptot. These results are not consistent with the report that in Fairbanks the yield of wheat was affected by precipitation and minimum temperature and the yields of barley and oat were affected by precipitation (Sharratt, Knight, and Wooding Citation2003). For example, in this study, most of barley cultivar yields in Fairbanks and Delta Junction were affected by temperature (Tmin or Tmax or both) and precipitation. Only the yields of ‘Lidal’ and ‘Otal’ in Fairbanks and ‘Weal’ in Delta Junction were affected by Ptot alone (). The majority of the best models (six out of eleven) for oat showed that the yields were affected by Ptot but others were affected by temperature (). Possible reasons include the following: First, the cultivar selection was different—only three cultivars in this study were the same as in a previous study (Sharratt, Knight, and Wooding Citation2003). Three of six cultivars from Sharratt, Knight, and Wooding’s (2003) study were not grown in Alaska now and standards of comparison were not used in the trials. ‘Weal,’ developed in Alaska, was the only barley cultivar that was used in both studies. The results from this study showed that the yield of ‘Weal’ in Fairbanks was affected by Tmin and Ptot but not by Ptot alone. Two oat cultivars, ‘Nip’ (developed in Sweden) and ‘Toral’ (Alaskan origin), were also selected in both studies. Sharratt, Knight, and Wooding (Citation2003) showed that precipitation was the only factor that affected the yields of ‘Nip’ and ‘Toral,’ whereas the results from this study showed that the yield of ‘Nip’ was not affected by weather and the yield of ‘Toral’ was affected by Tmin. The reason may be Ptot was used in this study but precipitation derivatives such as pan evaporation, precipitation deficit, and precipitation deficit ratio were used in the previous study. All of these derivatives of Ptot included pan evaporation, which was affected by temperature. Second, two test sites were used in this study instead of one (Fairbanks), and the weather patterns in Fairbanks and Delta Junction are different. Third, the time span in this study was 1978 to 2018, whereas the previous study covered the period 1972 to 1989, during which the weather patterns differed.
The results from this study showed that the yields of single cultivars of barley and oat in the trials were reduced at one or two locations over the last forty years. However, whether and how these reductions affect statewide barley and oat yields remain unanswered. The field production is different from the study in the trials. Farmers can select cultivars based on the previous experiences. Furthermore, management practices such as sowing date, irrigation, and fertilization in farms may be different from those in the trials in this study, and some of these practices may offset the effect of climate change as management did for maize yield in the North China Plain (Xiao and Tao Citation2016). Using yield data for crops from the whole state and weather data may be beneficial.
Alaska is located at a higher latitude and ranges from subarctic to arctic (54°40′N to 71°50ʹN). The climate differences are great across Alaska and the climate at an elevation of a few hundred feet or a few miles apart will have considerable effects on the yield of any cultivar (Van Veldhuizen, Zhang, and Knight Citation2014). In this study, the results confirmed that the same cultivars had different yields in two locations in response to local climate. In order to avoid a reduction in crop yield, the selection of cultivars should also focus on identifying genotypes and genes that are resistant to extreme temperature and drought and breeding cultivars that are resistant to higher temperature and drought (Dawson et al. Citation2015; Sallam et al. Citation2018). Finally, crop yield models should be established based on the local climate and cultivars, and the models should be updated regularly based on changes in climate.
In conclusion, the increased Tmin in June to July may be responsible for the reduction in cultivar yield in Fairbanks and Tmin and Ptot may be responsible for the losses in Delta Junction. The reactions of cultivars to climate change varied by location. In order to cope with climate change, more location-specific cultivars need to be selected; growing a single cultivar throughout the whole state should be avoided, and corresponding management practices should be established.
Acknowledgments
We appreciate all researchers not listed as coauthors from the University of Alaska Fairbanks for their great contributions to Alaska small grain alternative crop testing trials. These researchers include the late Dr. Frank J. Wooding, Dr. Carol Lewis, Dr. Jenifer H. McBeath, Dr. Stephen M. Dofing, Dr. G. Allen Michel Jr., Dr. Brenton Sharratt, S. Frost, J. T. Hanscom, and G. M. Delucchi.
Disclosure statement
No potential conflict of interest was reported by the authors.
Additional information
Funding
References
- Bieniek, P. A., and J. E. Walsh. 2014. Using climate divisions to analyze variation and trends in Alaska temperature and precipitation. Journal of Climate 27:2800–18. doi:10.1175/JCLI-D-13-00342.1.
- Bootsma, A., S. Gameda, and D. W. McKenney. 2005. Potential impacts of climate change on corn, soybeans and barley yields in Atlantic Canada. Canadian Journal of Plant Science 85:345–57. doi:10.4141/S04-025.
- Dawson, I. K., J. Russell, W. Powell, B. Steffenson, W. T. Thomas, and R. Waugh. 2015. Barley: A translational model for adaptation to climate change. New Phytologist 206:913–31. doi:10.1111/nph.13266.
- Eckersten, H., A. Kornher, G. Bergkvist, J. Forkman, E. Sindhøj, B. Torssell, and P. Nyman. 2010. Crop yield trends in relation to temperature indices and a growth model. Climate Research 42:119–31. doi:10.3354/cr00867.
- Hakala, K., L. Jauhiainen, S. J. Himanen, R. Rötter, T. Salo, and H. Kahiluoto. 2012. Sensitivity of barley cultivars to weather in Finland. Journal of Agricultural Science 150:145–60. doi:10.1017/S0021859611000694.
- Hinzman, L. D., N. D. Bettez, W. R. Bolton, F. S. Chapin, M. B. Dyurgerov, C. L. Fastie, B. Griffith, R. D. Hollister, A. Hope, H. P. Huntington, et al. 2005. Evidence and implications of recent climate change in northern Alaska and other Arctic regions. Climate Research 72:251–98. doi:10.1007/s10584-005-5352-2.
- Intergovernmental Panel on Climate Change. 2014. Climate change 2014: Impacts, adaptation, and vulnerability. Part A: Global and sectoral aspects. Contribution of working group II to the fifth assessment report of the Intergovernmental Panel on Climate Change, 1132. Cambridge, UK; New York, NY: Cambridge University Press.
- Klink, K., J. J. Wiersma, C. J. Crawford, and D. D. Stuthman. 2014. Impacts of temperature and precipitation variability in the Northern Plains of the United States and Canada on the productivity of spring barley and oat. International Journal of Climatology 34:2805–18. doi:10.1002/joc.3877.
- Korner-Nievergelt, F., T. Roth, S. von Felten, J. Guélat, B. Almasi, and P. Korner-Nievergelt. 2015. Bayesian data analysis in ecology using linear models with R, BUGS, and Stan. New York: Elsevier Science.
- Kurukulasuriya, P., and S. Rosenthal. 2013. Climate change and agriculture: A review of impacts and adaptations. Climate change series. Washington, DC: World Bank.
- Lizana, X. C., and D. F. Calderini. 2013. Yield and grain quality of wheat in response to increased temperatures at key periods for grain number and grain weight determination: Considerations for the climatic change scenarios of Chile. The Journal of Agricultural Science 151:209–21. doi:10.1017/S0021859612000639.
- Lobell, D. B., K. N. Cahill, and C. B. Field. 2007. Historical effects of temperature and precipitation on California crop yield. Climatic Change 81:187–203. doi:10.1007/s10584-006-9141-3.
- Luo, Q. 2011. Temperature thresholds and crop production: A review. Climatic Change 109:583–98. doi:10.1007/s10584-011-0028-6.
- Peltonen-Sainio, P., L. Jauhiainen, and K. Kakala. 2011. Crop response to temperature and precipitation according to long-term multi-location trials at high-latitude condition. The Journal of Agricultural Science 149:49–62. doi:10.1017/S0021859610000791.
- Peltonen-Sainio, P., A. Venäläinen, H. M. Mäkelä, P. Pirinen, M. Laapas, L. Jauhiainen, J. Kaseva, H. Ojanen, P. Korhonen, E. Huusela-Veistola, et al. 2016. Harmfulness of weather events and the adaptive capacity of farmer at high latitudes of Europe. Climate Research 67:221–40. doi:10.3354/cr01378.
- R Core Team. 2020. R: A language and environment for statistical computing. Vienna, Austria: R Foundation for Statistical Computing. https://www.R-project.org/.
- Sallam, A., A. Amro, A. El-Akhdar, M. F. Dawood, T. Kumamaru, and P. Stephen Baenziger. 2018. Genetic diversity and genetic variation in morpho-physiological traits to improve heat tolerance in spring barley. Molecular Biology Reports 45:2441–53. doi:10.1007/s11033-018-4410-6.
- Sharratt, B. S., C. W. Knight, and F. Wooding. 2003. Climatic impact on small grain production in the subarctic region of the United States. Arctic 56:219–26. doi:10.14430/arctic617.
- Shulski, M., and G. Wendler. 2007. The climate of Alaska. Fairbanks, Alaska: University of Alaska Press.
- Torvanger, A., M. Twena, and B. Romstad. 2014. Climate change impacts on agricultural productivity in Norway. CICERO Working Paper, 10.
- U.S. Department of Agriculture, National Resources Conservation Service. 2014. 2012 census of agriculture: Alaska State and area data. Part 2. Geographic Area Series 1(AC–12–A–1):365.
- Van Veldhuizen, R. M., M. Zhang, and C. W. Knight. 2014. Performance of agronomic crop cultivars in Alaska 1978–2012, 252. Fairbanks: Agricultural and Forestry Experiment Station, University of Alaska Fairbanks. Bulletin 116.
- Verón, S. R., D. de Abelleyra, and D. B. Lobell. 2015. Impacts of precipitation and temperature on crop yields in the Pampas. Climatic Change 130:235–45. doi:10.1007/s10584-015-1350-1.
- Xiao, D., and F. Tao. 2016. Contributions of cultivar shift, management practice and climate change to maize yield in North China Plain in 1981–2009. International Journal of Biometeorology 60:1111–22. doi:10.1007/s00484-015-1104-97.
- Young, A. H., K. R. Knapp, A. Inamdar, W. Hankins, and W. B. Rossow. 2018. The International Satellite Cloud Climatology Projection H-Series climate data record product. Earth System Science Data 10:583–593. doi:10.5194/essd-10-583-2018.