
ABSTRACT
Multiple proxies in three sediment cores from Northwestern Baffin Bay document the timing of Lancaster Sound Ice Stream (LSIS) retreat that led to Arctic–Atlantic throughflow in Parry Channel, an important source of freshwater that can impact the Atlantic Meridional Overturning Circulation. The Late Glacial to Holocene timing of ice retreat and channel opening and the responses of the regional ocean environment to these events are presented. We use quantitative mineral composition, foraminiferal assemblages, biogenic silica, ice-rafted debris (IRD), and 14C-based age models to document and date the events and environmental changes occurring during deglaciation of this major marine channel. Findings show that retreat of the LSIS into Lancaster Sound occurred before ~15.3 cal ka BP, about 800 years before the onset of major iceberg calving events from the LSIS, named the Baffin Bay Detrital Carbonate events (BBDC 1 and BBDC 0). The end of BBDC 0 occurred at ~10.6 cal ka BP, which coincides with the opening of Parry Channel. A marine environment productive of calcareous benthic and planktic foraminifera, with diminished meltwater, seasonal sea ice, warmer summer temperatures, and inflowing, nutrient-rich Arctic surface water characterizes the interval between the opening of Parry Channel and the opening of Nares Strait. Paired planktic and benthic 14C ages over this 2,200-year interval show diminishing age offsets suggesting progressive mixing of the upper ~850–900 m of the water column. The opening of Nares Strait by ~8.2 cal ka BP coincides with increased biogenic silica in the form of abundant, large centric diatoms and dissolution of CaCO3. The paucity of calcareous organisms after 8.2 cal ka BP resulted in poor chronological control in the cores to interpret changing environments after 8.2 cal ka BP.
Introduction
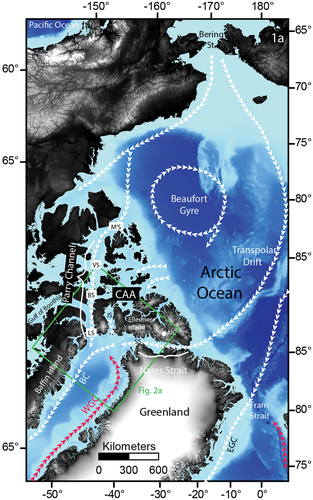
Freshwater flows out of the Arctic Ocean as sea ice and Arctic surface water (ASW) and enters the North Atlantic through Fram Strait, east of Greenland, and through Nares Strait and the channels of the Canadian Arctic Archipelago (CAA) west of Greenland and from there into the regions of overturning ocean circulation (). It has been argued that variations in the northern sourced freshwater have significant consequences for the Atlantic Meridional Overturning Circulation (Curry and Mauritzen Citation2005; Serreze et al. Citation2006; Curry, Lee, and Petrie Citation2011; Yang et al. Citation2016). Modern high-volume freshwater export events are documented as salinity anomalies in the North Atlantic and have been attributed to outflow through both Fram Strait (Dickson et al. Citation1988) and the channels of the CAA (Belkin et al. Citation1998; Belkin Citation2004), including Parry Channel, Jones Sound, and Nares Strait (). Modeling suggests that freshwater export through Nares Strait and the CAA channels will increase as Arctic sea ice declines allowing unchecked solid and liquid freshwater transport into Baffin Bay (Koenigk et al. Citation2007; Vavrus et al. Citation2012; Jahn and Holland Citation2013). Fram Strait is over 2,500 m deep and was open to throughflow throughout the last glaciation, but the much shallower Nares Strait and the channels of the CAA were blocked completely by grounded ice sheets (Dyke et al. Citation2002; England et al. Citation2006). Recent research suggests that Nares Strait, the largest present-day contributor of freshwater west of Greenland (0.7 Sv; Rudels Citation2019), opened to Arctic–Atlantic throughflow by 8.3–8.4 ka BP (Georgiadis et al. Citation2020; Jennings et al. Citation2022). Parry Channel, the second largest freshwater contributor (~0.5 Sv; Rudels Citation2019), is thought to have opened much earlier (c. 10.4 cal ka BP) based upon terrestrial glacial reconstructions (Dyke et al. Citation2002; Dalton et al. Citation2020) and proximal marine sediment records (Pieńkowski et al. Citation2012, Citation2014; Pieńkowski et al. Citation2014), but the timing of Parry Channel opening and the environmental conditions in the interval between the opening of Parry Channel and the opening of Nares Strait are not well documented.
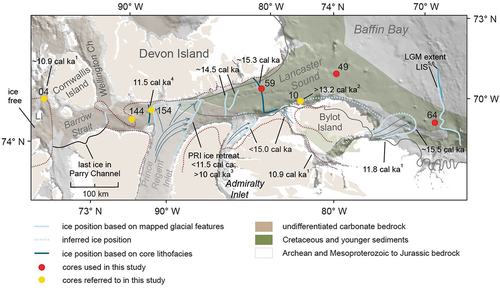
Figure 1. Map showing study area location and the channels through the CAA and Nares Strait connecting the Arctic Ocean to northern Baffin Bay and the general ocean circulation with Polar water/Arctic surface water depicted by white arrows and Atlantic water currents shown as red arrows. M’S = M’Clure Strait; VS = Viscount Melville Sound; BS = Barrow Strait; LS = Lancaster Sound; JS = Jones Sound; SS = Smith Sound; BC = Baffin Current; WGC = West Greenland Current, AIC = Agassiz Ice Core. (b) Green box shows area of . Bathymetry data from the International Bathymetric Chart of the Arctic Ocean (Jakobsson et al. Citation2012).
The successive opening of the two main channels, Parry Channel and Nares Strait, resulted from the retreat of confluent Innuitian, Greenland, and Laurentide ice sheets (England Citation1999; Dyke et al. Citation2002; England et al. Citation2006). The channels experienced ~135 m of glacial isostatic uplift after opening (Blake Citation1992; Williams et al. Citation1995; Simon, James, and Dyke Citation2015). The shallowing of the channels through isostatic uplift would have affected the composition of water masses transiting from the Arctic Ocean to the Atlantic (Pieńkowski et al. Citation2014). Nares Strait opening ushered in the modern ocean circulation in Baffin Bay (Jennings et al. Citation2011) and likely impacted the composition and flow strength of the Baffin Current and transport of ASW to the Labrador Sea, but the impact of Parry Channel opening has not been documented.
In this article, we investigate the timing and paleoenvironmental consequences of the opening of Parry Channel using multi-proxy analyses from two sediment cores (2008029-49CC and 2008029-59CC) in Lancaster Sound, the easternmost segment of Parry Channel, and one in northwestern Baffin Bay, 2013029-64PC (). We focus on four major events described in the region: (1) glaciation of Lancaster Sound, (2) retreat of the Lancaster Sound Ice Stream (LSIS) as evidenced by the Baffin Bay Detrital Carbonate (BBDC) events and glaciomarine conditions associated with the retreating ice margin, (3) onset of Parry Channel Arctic–Atlantic throughflow and environmental conditions prior to opening of Nares Strait, and (4) opening of Nares Strait (). The two cores in outer Lancaster Sound are in sensitive positions to capture the full sediment sequence deposited during retreat of the LSIS that culminated in the opening of Parry Channel and the potential changes in circulation and water masses associated with the period between the opening of Parry Channel and opening of Nares Strait. The core on the northwestern (NW) Baffin Island slope, downstream from those cores, is positioned to receive sediments from the retreating LSIS and to record changing ocean circulation in northern Baffin Bay. Radiocarbon dating, lithofacies analysis, foraminiferal assemblages, sediment provenance, and relative diatom abundances are used to reconstruct the timing of environmental and oceanographic changes that accompany these major natural events during deglaciation and the transition toward modern conditions.
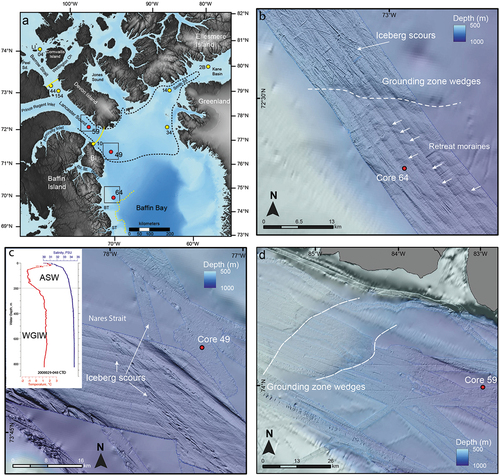
Figure 2. (a) Location map of the study area showing the cores of this study in red: 59=2008029-59CC, 49=2008029-49CC, 64=2013019-64PC and cores mentioned in the text shown in yellow: 04=97022-004, 144=86027-144, 154=86027-154, 10=2011804-0010, 34=2008029-034, 11=LSSL2001-014PC, and TC; 2B = AMD14-Kane2B. NBI = Navy Board Inlet; BT = Buchan Trough; ST = Scott Trough. Squares surrounding core sites denote site studies of multibeam bathymetry data at each core site. Dashed black line shows the average June extent of the NOW. Dashed yellow line denotes maximum ice extent mapped for the LGM after Li, Piper, and Campbell (Citation2011) and Brouard and Lajeunesse (Citation2017). Solid yellow lines in outer Lancaster Sound (Furze et al. Citation2018) and in Barrow Strait (Pieńkowski et al. Citation2012, Citation2014) mark inferred LSIS retreat positions. Bathymetry data from the International Bathymetric Chart of the Arctic Ocean (Jakobsson et al. Citation2012). (b) Site study for 64PC showing the grounding zone wedge formed by the Pond Inlet Ice Stream and retreat moraines from ice retreat that occurred prior to the results shown in the upper 441 cm of core 64PC in this article. (c) Site study for 49CC showing iceberg scours. Conductivity, temperature, depth profile taken 430 m SE of 49CC (48CTD) during the 2008029 CSGS Hudson cruise (Campbell and de Vernal Citation2009). WGIW = West Greenland Intermediate Water. (d) 59CC site study showing the locations of the two grounding zone wedges in Lancaster Sound west of the core site.
Physical setting
Ocean circulation in Baffin Bay is cyclonic, with the West Greenland Current (WGC) carrying warm, saline Atlantic water of the Irminger Current and low-salinity, cold, polar waters of the East Greenland Current northward along Greenland and the Baffin Current comprising cold (<0°C), low-salinity ASW flowing southward along the Baffin Island margin (; Tang et al. Citation2004; Münchow, Falkner, and Melling Citation2006; Münchow et al. Citation2015). The Arctic outflow joins the Baffin Current and forms the upper 100 to 300 m of surface water in Baffin Bay, with a greater thickness in western Baffin Bay, whereas the West Greenland Current dominates in southeastern Baffin Bay (Tang et al. Citation2004; ). The Atlantic water is cooled and freshened during its transit north and it underlies the fresher ASW as an intermediate water mass (300–800 m) called West Greenland Intermediate Water (Tang et al. Citation2004; ). ASW has low saturation states with respect to aragonite and calcite (Ωcal <1.8 and Ωarg <1.2) and is associated with low calcium carbonate preservation, whereas Atlantic water has much higher saturation states (Ωcal >2.4 and Ωarg >1.6; Azetsu-Scott et al. Citation2010).
Parry Channel is the long, shallow main channel through the Canadian Arctic Archipelago that connects the Arctic Ocean and Baffin Bay (). It trends east to west with component segments of Lancaster Sound, Barrow Strait, and Viscount Melville Sound that complete the connection to the Arctic Ocean through M’Clure Strait (). Many subsidiary channels enter Parry Channel, and these provide additional shallow connections to the Arctic Ocean (). Lancaster Sound reaches depths of over 900 m at its eastern end and shallows toward Barrow Strait finally reaching its shallowest depths of ~125 m at the Lowther Island sill near the western end of Barrow Strait (Pieńkowski et al. Citation2012; MacLean et al. Citation2017; ). The present-day shallow sill depths along Parry Channel govern the composition of inflowing ASW to the carbonate-undersaturated polar mixed layer, comprising high-nutrient Pacific water that enters the Arctic Ocean over the Bering Strait (Azetsu-Scott et al. Citation2010; ), although the water masses may have been different immediately after deglaciation when the channel depths were as much as 135 m deeper due to isostatic depression (Pieńkowski et al. Citation2014). The flow of ASW was also governed by the flooding history of Bering Strait. Radiocarbon-dated Pacific mollusks were present in the western end of the CAA channels by 13.5 cal ka BP, suggesting that there was at least some Pacific water entering the Arctic Ocean over Bering Strait by that time (England and Furze Citation2008). Recent work has shown that Bering Strait was definitely flooded by 11.2 cal ka BP (Pico, Mitrovica, and Mix Citation2020), which would allow Pacific water to flow through Parry Channel with the ASW once Barrow Strait was deglaciated.
The modern sea-ice edge extends southwest to northeast within Baffin Bay, marking the boundary between the Baffin Current and the WGC (Tang et al. Citation2004; Münchow et al. Citation2015). Sea ice begins to form in September and reaches maximum coverage in March and is thickest along the Baffin Island coast where the ASW flow is concentrated (Tang et al. Citation2004). Where the channels of the CAA and Nares Strait open into Baffin Bay, biological productivity is enhanced by the 85,000 km2 North Water Polynya (NOW) or Pikialasorsuaq (; Dunbar Citation1969; Melling, Gratton, and Ingram Citation2001; Klein et al. Citation2002; Ribeiro et al. Citation2021). The ice-covered area decreases between April and August, initiated in the NOW region, and expands westward into Lancaster Sound, generally by June (). Pacific water that enters the Arctic Ocean over the Bering Strait is a major component of the ASW (). It has twice the nitrogen and phosphorus and seven times the silica of Atlantic Water (Jones et al. Citation2003). The high nutrient content of the ASW, along with higher light levels and stratification in the NOW, fuels high phytoplankton productivity, particularly of diatoms that are exported to the sediment (Lewis et al. Citation1996; Ingram et al. Citation2002; Tremblay et al. Citation2002).
Onshore bedrock geology along Parry Channel is mostly lower Paleozoic carbonate and siliciclastic rocks, Devonian sandstones, and Archean plutonics and gneisses (Miall, Balkwill, and Hopkins Citation1980; Harrison, Brent, and Oakey Citation2011; Furze et al. Citation2018). The Paleozoic carbonate rocks dominate onshore in western Lancaster Sound from Admiralty Inlet westward (). The offshore bedrock geology of Lancaster Sound has not been directly sampled, but it has been inferred to comprise crystalline basement rocks overlain by lower Paleozoic carbonate and siliciclastic bedrock, based on the high detrital carbonate composition of glacigenic debris flows on the Lancaster Sound trough mouth fan (Li, Piper, and Campbell Citation2011) and from the detrital carbonate composition of BBDC events produced by glacial erosion in Lancaster Sound and iceberg transport and melting in Baffin Bay (Parnell et al. Citation2007; Andrews, Eberl, and Scott Citation2011; Q. Simon et al. Citation2014). Cretaceous–Tertiary siliciclastic rocks with high organic carbon content have been mapped on Bylot Island, near the mouth of Lancaster Sound (Miall, Balkwill, and Hopkins Citation1980; Harrison, Brent, and Oakey Citation2011; Atkinson et al. Citation2017). It is inferred that Cretaceous strata are present on the seafloor of eastern Lancaster Sound, in Eclipse Sound, and in the sediment depocenter in northern Baffin Bay east of Lancaster Sound called the Baffin Bay Fan (Harrison, Brent and Oakey Citation2011). Upper Cretaceous bedrock cores comprising dark gray siltstone were described by MacLean and Falconer (Citation1979) offshore in Buchan Trough and Scott Trough, south of Lancaster Sound ().
Previous work on regional glacial history
Confluent Innuitian and Laurentide ice sheets advanced over much of the CAA during the Last Glacial Maximum (LGM) (Dyke et al. Citation2002; Margold, Stokes, and Clark Citation2015), blocking the channels in the CAA to throughflow between the Arctic Ocean and Baffin Bay (Dyke Citation1999; England Citation1999; Dyke et al. Citation2002; England et al. Citation2006). A paleo-ice stream more than 1,600 m thick, the LSIS, filled Lancaster Sound during the LGM (Klassen and Fisher Citation1988; Dyke, Moore, and Robertson Citation2003; MacLean et al. Citation2017) and advanced eastward 270 km into northwestern Baffin Bay grounding in 1,300-m water depth (Li, Piper, and Campbell Citation2011; ). The LSIS was confluent with the Pond Ice Stream (aka Eclipse Sound Ice Stream; Margold, Stokes, and Clark Citation2015) as it rounded Bylot Island (Brouard and Lajeunesse Citation2017; ). Further evidence for a large paleo-ice stream comes from megascale glacial lineations and drumlinoid ridges mapped east to west along the seafloor of Lancaster Sound (Bennett, Campbell, and Furze Citation2013; Bennett et al. Citation2014; Furze et al. Citation2018; MacLean et al. Citation2017). Ice streaming from the Laurentide Ice Sheet converged in Lancaster Sound via Peel Sound (MacLean et al. Citation2010), Prince Regent Inlet, Admiralty Inlet, and Navy Board Inlet (De Angelis and Kleman Citation2005, Citation2007; Margold, Stokes, and Clark Citation2015; Bennett et al. Citation2016; ). The Laurentide ice converged with ice flowing from the Innuitian Ice Sheet, joining a fast-flowing ice stream in Wellington Channel fed by ice from Cornwallis, Devon, and Bathurst Islands (MacLean et al. Citation1989, Citation2017; Dyke Citation1999; ). After the LGM, the LSIS retreated from east to west (); grounding zone wedges imply that westward ice retreat was stepwise (Bennett, Campbell, and Furze Citation2013; Bennett et al. Citation2014; Furze et al. Citation2018).
Post-LGM retreat of the LSIS with possible contributions from other northern Baffin Bay ice streams produced BBDC events rich in dolomite (Aksu and Piper Citation1987; Andrews et al. Citation1998; Parnell et al. Citation2007; Simon et al. Citation2014, Citation2016). The main contributor of the dolomite-rich BBDC events was the LSIS, because this was the largest ice stream and it was surrounded by dolomitic Paleozoic carbonate bedrock, whereas other major ice stream channels, such as Smith Sound, have less extensive Paleozoic carbonate bedrock (Georgiadis et al. Citation2018; Jennings et al. Citation2019). Ages of BBDC 1 (~14.2–13.7 cal ka BP) and BBDC 0 (~12.7–11 cal ka BP), most recently defined by Jackson et al. (Citation2017), are the youngest of the BBDC events that are widespread in Baffin Bay. They are best represented along Baffin Island and in the deep basin and occur as much thinner layers along west Greenland (Andrews et al. Citation1998; Simon et al. Citation2014, Citation2016; Sheldon et al. Citation2016; Jackson et al. Citation2017; Jennings et al. Citation2018). The age estimates of these two events have varied slightly as more records have been dated in Baffin Bay, and it seems reasonable that the timing of the events also would differ slightly due to variable transit paths, iceberg melting, and the quality of the dating control.
Jenner, Campbell, and Piper (Citation2018) interpreted two intervals of tan calcareous mud with high Ca/Ti ratios in 64PC as BBDC 1 and BBDC 0. Reconstructions of the extent of the LSIS during BBDC 1 show it beyond the mouth of Lancaster Sound until ~12.8 cal ka BP and retreating into Lancaster Sound by ~12.1 cal ka BP (Dyke, Moore, and Robertson Citation2003; Li, Piper, and Campbell Citation2011; Dalton et al. Citation2020). Based on stratigraphy and dating in core 2011804-0010 in outer Lancaster Sound it was suggested that the LSIS was thinning and reached flotation in eastern Lancaster Sound, forming an ice shelf c. 13.2 cal ka BP (Bennett et al. Citation2014; Furze et al. Citation2018; ). There is broad agreement that the LSIS extended onto the Baffin Bay slope at the LGM and that it retreated after that time, but the location of the ice margin of the LSIS during BBDC 1 and BBDC 0 has not been established.
Sediment cores in western Lancaster Sound (86027-154), in eastern Barrow Strait (86027-144), and at the mouth of McDougal Sound (9722-004; ) constrain the timing of progressive westward retreat from ~11.5 to 10.8 cal ka BP (Pieńkowski et al. Citation2012, Citation2014; Pieńkowski et al. Citation2013; Dalton et al. Citation2020). A rise in planktic foraminiferal abundances associated with postglacial conditions at 10.3 cal ka BP indicates that a deep Arctic throughflow (Pieńkowski et al. Citation2013) was established by that time and that the throughflow was established well after the flooding of Bering Strait (cf. Pico, Mitrovica, and Mix Citation2020).
Methods and materials
Baffin Bay cruises and core sampling
Sediment cores were taken from the CCGS Hudson at sites in Northern Baffin Bay during cruises 2008029 (Campbell and de Vernal Citation2009) and 2013029 (Campbell et al. Citation2017) (). For the 2008029 cores, we used multiple lines of evidence from the visual core descriptions, x-radiographs, foraminiferal data, biogenic silica (diatom) relative abundances, magnetic susceptibility and radiocarbon dates to choose the box core (BC), trigger core (TC), and piston core (PC) splice depths in order to display the sediment core data on composite depth and to develop age models. The splice depths and how they were selected are detailed in Table S1. Composite core (CC) 2008029-59 includes the TC and PC from a site inside Lancaster Sound at 74.259623°N, 82.38415°W at 791-m water depth. Core 49CC from the mouth of Lancaster Sound represents a composite of the trigger and piston cores (74.026178°N, 77.125263°W at 868 m water depth) plus 47BC (870-m water depth) from a site 430 m to the southeast (). The cores were taken very close together in order to capture sediments within (49PC and TC) and just outside of (47BC) a large iceberg scour that dates from the last deglaciation of Lancaster Sound (Bennett, Campbell, and Furze Citation2013). A CTD (conductivity, temperature, and depth) cast (48CTD) was taken at the same location as 47BC (; ). Core 64PC was taken on the Baffin Island upper continental slope (72.426113°N, 72.769305°W) north of Buchan Gulf in 875-m water depth (; Campbell et al. Citation2017). We focused sampling of the three cores on the end of glaciomarine sedimentation and through the postglacial interval on the basis of previous work by Bennett et al. (Citation2013, Citation2014) and Jenner, Campbell, and Piper (Citation2018) to constrain the timing of the opening of Parry Channel and subsequent environmental development at the sites. Thus, we took 2-cm-wide subsamples every 10 cm from the uppermost clast-rich glaciomarine sediments and in the overlying postglacial mud. We took additional 2-cm-wide samples from the Lancaster Sound cores to capture specific lithofacies and mud intervals within the glaciomarine and till lithofacies. In a previous study, samples from 64PC had been provided every 20 cm from the entire core and analyzed for quantitative X-ray diffraction (XRD) mineralogy (Jenner, Campbell, and Piper Citation2018; Andrews, Jenner, and Campbell Citation2020). Only samples from the upper 220 cm were analyzed for foraminifera and other aspects for this study, but analysis of the foraminiferal assemblages of the full core are underway. Samples were stored at 4°C until processed.
Table 1. Core site information and core top correlations. Splice depth determination info in Table S1.
Core descriptions
Core logs were made from sedimentary characteristics in visual core descriptions, photographs, and x-radiographs taken when the cores were opened and described at the Geological Survey of Canada–Atlantic (GSCA) (Bennett, Campbell, and Furze Citation2013; Campbell et al. Citation2017; Expedition database website https://ed.gdr.nrcan.gc.ca). The photographs were taken with a Nikon D100 megapixel digital camera. X-radiographs were acquired using a standard veterinary X-ray unit. The images were acquired via cassette using a Konica Digital Imaging system via custom Image Pilot software. Clasts >2 mm are interpreted as ice-rafted detritus (IRD). IRD was quantified by counting >2 mm clasts from x-radiographs in continuous 2-cm depth by 10-cm diameter (inner diameter of the core liner) windows (Grobe Citation1987). In some intervals the number of >2-mm clasts were too high for accurate counts. In these intervals we determined a saturation number to indicate that the number of >2-mm clasts was greater than we could count using this technique. When the cores were first opened and logged onshore, spectral reflectance was acquired at a 5-cm interval using a handheld Konica Minolta CM-2002 spectrophotometer at the Atlantic Geoscience Center. We used the lightness data (L*) to provide a closer core-to-core comparison than our sampling strategy allowed. Spectral reflectance and Multi-Sensor Core Logger (MSCL) data are available from the GSCA Expedition database: https://ed.gdr.nrcan.gc.ca.
Radiocarbon dating and age modeling
Twenty-six new Accelerator Mass Spectrometry (AMS) radiocarbon dates and five published 14C dates (Bennett et al. Citation2014; Jenner, Campbell, and Piper Citation2018) provide the age data for this study (). Materials dated were benthic and planktic foraminifera tests (including five benthic–planktic pairs picked from the same samples), seaweed macrofossils, and mollusks. Paired benthic and planktic foraminifera dates from 2008029-34PC (Northeastern Baffin Bay: 76.32905, −71.418998) are included because they form part of our local reservoir age calculations (). Radiocarbon dates were calibrated using the Marine13 (Calib 7.0.2) calibration curve (Reimer et al. Citation2013). Calibrations were made using new information on the age difference between benthic and planktic (near sea surface) paired dates. In northeast (NE) Baffin Bay we apply a 140-year (±60 years) local reservoir age (ΔR) to 14C dates on planktic foraminifera and seaweed after McNeely and Brennan (Citation2005) and also adopted by Jackson et al. (Citation2021). In NW Baffin Bay (49CC, 59CC, and 64PC) we apply a 220-year (±20 years) ΔR after (Coulthard et al. Citation2010; Bennett et al. Citation2014; Jenner, Campbell, and Piper Citation2018) to the near-surface ocean 14C ages. We assume that the ΔR corrections on planktic organisms are constant through time. The additional reservoir age corrections needed to calibrate benthic foraminifer and mollusk ages were determined using the age differences between five benthic and planktic paired dates from 59CC, 49CC, 64PC, and 34PC, combined with planktic ΔR estimates. The resulting benthic ΔR values decrease over the temporal span of the paired dates (10.2 to 8.1 14C ka benthic conventional radiocarbon ages; Figure S1). Assuming all of our sites share the same bottom water ventilation history, we estimate benthic ΔR as a function of benthic conventional radiocarbon age using a linear fit to the five observations (r2 = 0.81), with ΔR decreasing from 550 ± 50 years at 10.2 ka to 235 ± 50 years at 8.1 ka. For benthic ages older and younger than these bracketing paired dates, we hold benthic ΔR constant at 550 and 235 years, respectively. We used a combination of Bayesian age modeling (Bacon) and linear extrapolation to develop the age–depth models for the cores (Blaauw and Christen Citation2011).
Table 2. Radiocarbon dates and calibrated ages used in this study.
Foraminiferal assemblages and statistical analyses
Foraminiferal analyses were completed in the Micropaleontology Laboratory at INSTAAR, University of Colorado. The 2-cm-wide samples ranged from 11 to 60 g but on average were 20 to 30 g wet sediment weight. Equivalent dry weights were calculated using the relation between the wet and dry weights of sediment samples from the same depths. Samples were washed through a sieve with 63-µm mesh size. The >63-µm fraction was stored in a buffered solution (70 percent distilled water and 30 percent alcohol, by weight, and 1 g baking soda) to keep the pH close to 8.4. Foraminiferal assemblages were counted wet (in the buffered solution) under a binocular microscope. The target count for analysis was 300 specimens, although this number frequently was exceeded; a wet splitter was used to provide a representative split of samples containing abundant foraminifera. The full sample was counted for samples with less than 300 specimens. Percentage calculations were made on all samples except for three samples in 2008029-59CC, which had counts fewer than 60 specimens. Poorly preserved foraminiferal tests that could not be identified to genus were grouped as “unidentifiable agglutinated” or “unidentifiable calcareous.”
Multivariate Statistical Package (Computing Services 1998) was used to run principal component analysis (PCA) and cluster analysis (CA) for each core on square root–transformed total benthic (agglutinated and calcareous taxa combined) species assemblage data using all species with percentages of at least 2 percent in one sample. PCA is a method used to simplify complex assemblage data and thereby aid paleoenvironmental interpretations. Known environmental associations of the most important benthic species on the PCA axes from each core provide the basis for the environmental interpretations (). Constrained CA (i.e., considered in stratigraphic order) by minimum variance was run on each core to provide downcore faunal zonation of the benthic foraminiferal assemblage data.
Table 3. Benthic foraminifera environmental preferences.
Estimation of the biogenic silica abundance
Fourier transform infrared (FTIR) spectroscopy was used to estimate the biogenic silica content of the sediment samples (cf. Vogel et al. Citation2008). Spectroscopy grade potassium bromide (KBr) was ground to a fine powder and dried in an oven at 78°C for 2 hours to be used as a blank in between sediment measurements. KBr (0.4998–0.5002 g) and dry sediment (0.098–0.102 g) were combined, ground with a mortar and pestle, and oven-dried for at least 2 hours at 78°C. The samples were placed in a desiccator and cooled completely prior to measurement on a Bruker Vertex 70 machine linked to OPUS software (Tiedemann Citation2012; www.opus-repository.org). The area under the absorbance spectral peak from 1090–1100 cm−1 contains both opal and quartz. We used methods described in detail in the Supplemental Information (Figure S2) to develop an abundance scale for the opal (mainly diatom) content.
Mineralogy and compositional groups
A total of 139 samples from the three cores (1 g samples, <2 mm fraction) were prepared for the quantitative determination of the weight percentage of non-clay and clay minerals using the X-ray diffraction whole-pattern approach (Eberl Citation2003), similar to previous studies from the area (Andrews Citation2019; Jennings et al. Citation2019; Andrews, Jenner, and Campbell Citation2020). Discussion of the accuracy and precision of mineral weight percentage estimates have been given in the above papers. We use the quantitative mineralogy to test for changes in sediment provenance over the time period represented by the cores using programs in the R library (https://www.r-project.org/web/packages) (Kassambara and Mundt Citation2020) to estimate the number of clusters or groups in a data set (Kassambara Citation2017). The validity and robustness of the selected classifications was then tested by processing the results through a classification decision tree (CDT; programs “rpart” and “rpartplot”) and calculating the number of misclassifications (Vermeesch Citation2006; Andrews, Jenner, and Campbell Citation2020). The CDT plots a number of binary decisions that result in samples being assigned to a specific group. The “predict” command in “rpart” produces an n × m matrix (n = number of samples, m = number of groups), which assigns m probabilities to each sample and sums to 1.0. We calculate a “confusion index,” H%, using the maximum entropy calculation (Miller and Kahn Citation1962), where 0 confusion is when a sample belongs to only one group and maximum confusion exists when the probabilities are 1/m.
Results
Lithofacies
Bennett, Campbell, and Furze (Citation2013) and Bennett et al. (Citation2014) described three basic sediment units in a series of nine piston cores from Lancaster Sound, including cores 2008029-59PC and -49PC of this study. The units were correlated to the acoustic units presented from farther south on the eastern Baffin Island Shelf in the region of Buchan Trough () by Praeg, Maclean, and Sonnichsen (Citation2007). The cores terminate in an ice-contact till unit correlated with the Baffin Shelf Drift (Bennett, Campbell, and Furze Citation2013; Bennett et al. Citation2014). The till is very dark brown/dark brownish gray in 49PC and 59PC. The till is overlain by glaciomarine sediments equivalent to the Davis Strait Silt. The glaciomarine sediments are either much lighter colored, tan, calcareous pebbly mud either immediately above the till or as a transitional very dark brown/dark brownish gray unit that gradually transitions to the calcareous pebbly mud. The uppermost unit is bioturbated olive gray postglacial mud of the Tiniktartuq Mud. We use the x-radiographs and visual core descriptions of the piston and trigger weight cores to provide more detailed lithofacies descriptions for the composite cores 49 and 59, but we retain the original interpretations of Bennett, Campbell, and Furze (Citation2013, Citation2014; ). The lithofacies of 2013029-64PC are taken from Jenner, Campbell, and Piper (Citation2018; ) and pebbles were not counted.
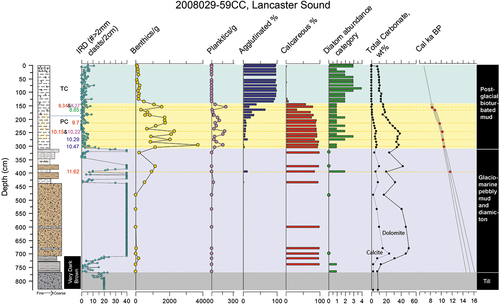
Figure 3. Basic stratigraphy and proxies for (a) 59CC and (b) 49CC to illustrate the environmental changes in Lancaster sound, from deglaciation onward. The gray box marks the subglacial till of the Baffin Shelf drift. The blue box coincides with glaciomarine sediments of the Davis Strait silt. The yellow and green boxes coincide with postglacial sediments of the Tiniktartuq Mud (Bennett et al. Citation2014). All proxies are shown against composite core depth. The data are presented left to right as core log, calibrated radiocarbon dates (Marine13 data) on benthic foraminifera (red), planktic foraminifera (pink), mollusks (blue), and seaweed macrofossils (green); >2 mm clast counts (= IRD), benthic forams/g, planktic forams/g, agglutinated forams percentage, calcareous forams percentage, the diatom abundance category, the calcite and dolomite weight percentages, and the age model with 2σ errors and showing ages not included in the age model as gray circles.
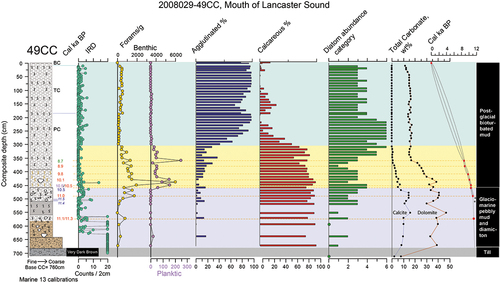
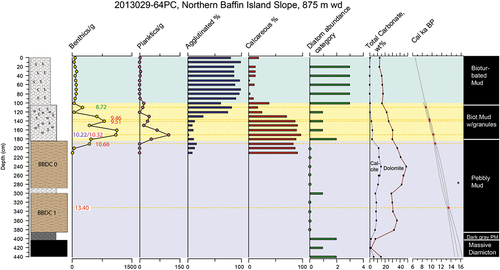
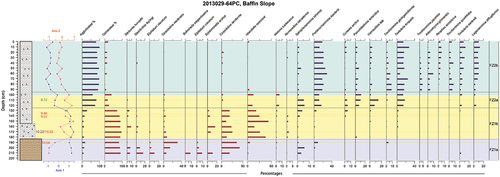
Figure 4. Basic stratigraphy and proxies for 64PC. The blue box denotes glaciomarine sediments. The yellow and green boxes denote postglacial sediments. The data are presented left to right as core log, calibrated radiocarbon dates (Marine13 data) on benthic foraminifera (red), planktic foraminifera (pink), mollusks (blue), and seaweed macrofossils (green), followed by benthic forams/g, planktic forams/g, agglutinated forams percentage, calcareous forams percentage, the diatom abundance category, the calcite and dolomite weight percentages, and the age model with 2σ errors and showing one age that is not included in the age model (gray circle).
In core 59CC (), the basal unit from 833 to 768 cm is stiff, massive diamicton (; Bennett, Campbell, and Furze Citation2013; Bennett et al. Citation2014). It is overlain by laminated sandy mud with dispersed granule-sized clasts and rarer small pebbles between 768 and 730 cm (). Sieved foram samples revealed clasts of very dark brown siltstone with occasional red flecks, red mudstone clasts, and coal fragments in both the till and overlying proximal glaciomarine very dark brown units. A flame structure at 745 cm attests to rapid sedimentation in the proximal glaciomarine unit. Between 730 and 710 cm is laminated very dark brown pebbly mud with increasing size and quantity of clasts that transitions upward to increasingly lighter color layers that are overall grayish brown or “tan” (). From 710 to 438 cm the sediments comprise tan, color-banded, massive to laminated, stiff pebbly mud (). From 438 to 370 cm tan pebbly mud has layers of dark gray to dark grayish brown and dark brown mud (). After a gap due to an unsplit interval of whole round core from 370 to 345 cm, there is a lithofacies change to wavy laminations, in very dark gray to dark gray sandy mud with rare, dispersed granules and small pebbles (). This unit is capped by a dark gray thin pebbly mud unit (320 to 310 cm) with pebbles diminishing in abundance upwards (). The contact with the wavy laminated unit is angled (). Overlying the thin pebbly mud is a distinct lithofacies change to olive gray massive, bioturbated mud with rare clasts (). Bioturbation is not obvious in the first 30 cm (310–280 cm). Bright, pyritized burrows occur between 280 and 180 cm (). From 180 to 0 cm is bioturbated olive gray mud with black mottling indicating bioturbation with some gas expansion cracking ().
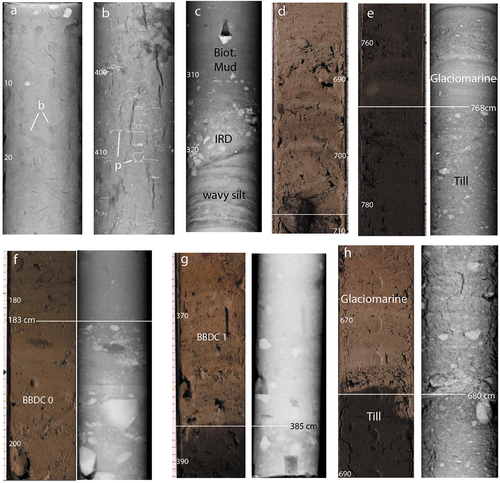
Figure 5. Examples of key lithofacies in cores 49CC, 59CC, and 64PC. (a) X-radiograph of bioturbated mud from 0 to 30 cm in 49CC, b = examples of burrows. (b) X-radiograph of bioturbated mud, examples of pyritized burrows = p, 390–420 cm in 49CC. (c) X-radiograph of transition to bioturbated mud marking open Parry Channel in 59CC, 300–330 cm. (d) Photograph showing transition from very dark brown glaciomarine sediments to tan calcareous pebbly mud of BBDC 1; 59CC 690–710 cm. (e) Transition from very dark brown till to very dark brown glaciomarine sediments in 59CC 755–784 cm, photo, left and x-radiograph, right. (f) Transition from tan calcareous pebbly mud of BBDC 0 to bioturbated mud in 64PC, 173–205 cm, marking opening of Parry Channel. (g) Very dark gray pebbly mud transition to tan calcareous pebbly mud of BBDC 1 at 385 cm in 64PC interval from 361 to 392 cm shown in photo, left, and x-radiograph, right. (h) Abrupt transition at 680 cm in 49CC from very dark brown till to tan calcareous pebbly mud of BBDC 0 marking the start of glaciomarine sedimentation after iceberg scour to till; shown is interval from 660 to 690 cm with photo, left, and x-radiograph, right.
In core 49CC (), the basal unit from 760 to 680 cm is very hard, very dark brown, sandy diamicton () interpreted as till (Bennett et al. Citation2014). Sieved samples contained clasts of very dark brown siltstone. This unit is overlain in a very sharp contact with a distinct color change to tan, calcareous, stiff, stratified, pebbly, sandy mud with color banding interpreted as glaciomarine sediment (; Bennett, Campbell, and Furze Citation2013; Bennett et al. Citation2014). The unit becomes softer and bioturbated beginning at 625 cm with burrows increasing toward the unit top at 560 cm (). Overlying the pebbly mud is laminated gray silty clay with rare coarse clasts (IRD) and black organic streaks and mottles (bioturbation). X-radiography shows distinct burrows often arranged vertically or nearly so (). The laminations change from millimeter scale initially to centimeter scale above 535 cm and continue to the unit top at 510 cm (). From 510 to 460 cm the sediment is very dark gray and dark gray massive, highly bioturbated mud (black burrows) with common dispersed clasts and gas expansion cracks (). The lithofacies unit between 460 and 390 cm is marked by burrows that are bright on x-radiography, denoting pyritization (also observed as pyrite casts of burrows in the foram samples); coarse clasts are uncommon (). The uppermost unit, 390 to 0 cm, is soft, olive gray, bioturbated silty clay () with gas expansion disturbance included in postglacial bioturbated mud by Bennett, Campbell, and Furze (Citation2013, Citation2014; ).
Jenner, Campbell, and Piper (Citation2018) described the lithofacies in 2013029-064PC as part of a major study of late Quaternary sedimentary environments and glacial history along the Baffin Island continental margin. The full core extends to 713 cm. Jenner, Campbell, and Piper (Citation2018) showed on the basis of high Ca/Ti values and tan color that 64PC contains both BBDC 1 and 0 (183–385 cm), separated by a 15-cm interval of carbonate poor, dark gray, pebbly mud (285–300 cm; ). BBDC 1 extends from 300 to 385 cm and is directly underlain by dark gray to black to very dark gray sediments that are distinctly different from the overlying tan calcareous pebbly mud of the BBDC units (). A black to very dark gray structureless diamicton (402–440 cm) is overlain by dark gray pebbly mud from 385 to 402 cm (). The black to dark gray units are limited in distribution to 64PC and other NE Baffin Slope cores between Scott Trough and Lancaster Sound (Jenner, Campbell, and Piper Citation2018). The black to dark gray units have been considered to represent sediment supplied laterally by glaciers extended onto the NE Baffin Shelf (Jenner, Campbell, and Piper Citation2018; Andrews, Jenner, and Campbell Citation2020). Andrews, Jenner, and Campbell (Citation2020) showed that the dark gray pebbly mud and black to very dark gray units in 64PC are typified by relatively high kaolinite content suggesting contributions from Cretaceous bedrock sources on the adjacent shelf (MacLean, Falconer, and Clarke Citation1978; Harrison, Brent, and Oakey Citation2011). Our results from the stratigraphic analyses in the two Lancaster Sound cores led us to use spectrophotometer data and mineralogy to extend our study of 64PC to 440 cm to include the black to dark gray sediment units and the complete interval of the overlying BBDC events 1 and 0 (). However, our detailed study using all proxies is limited to the upper 220 cm of 64PC. In the upper 220-cm interval, weakly stratified, light tan calcareous pebbly mud within BBDC 0 is the lowest interval for which we did detailed analyses in this study (222–183 cm; ). Above 183 cm pebbles become less frequent although dispersed clasts persist until 105 cm. The upper unit (105–0 cm) is medium brown, bioturbated mud with less than 5 percent sand (Jenner, Campbell, and Piper Citation2018; ).
Age-depth modeling
The age model in 59CC was constructed by Bayesian age modeling of nine calibrated ages (including two benthic/planktic pairs) between 140 cm to the base of the glaciomarine sediments (768 cm). The Bayesian model extends from the deepest age in the glaciomarine sediments of 11.6 cal ka BP at 394 cm to the glaciomarine/till boundary () resulting in a 2σ age estimate for onset of glaciomarine conditions (i.e., deglaciation of the area) of 14.6–16.1 cal ka BP, with a mean age of 15.3 cal ka BP (). We consider the 11.6 cal ka BP age to be reliable as it was obtained from 7.5 mg of large, very well-preserved specimens of Cassidulina neoteretis. However, extension of the age model monotonically to the till boundary does not account for changing sedimentation rates which likely become more rapid toward the boundary. In the upper core, there were no dateable materials above 155 cm, so the ages above this depth are based on linear extrapolation of the sedimentation rate defined by the upper two ages to the Y-axis, yielding a core top age estimate of 6.8 cal ka BP.
The age model of 49CC () is based on Bayesian age modeling from the box core top that is assigned the age of collection (2008 = −58 a BP) with a long extension to the next date on seaweed macrofossils at 360 cm (8.7 cal ka BP). The age model between 360 and 490 cm is well constrained by seven calibrated ages between 8.7 and 11.0 cal ka BP. Two mollusk dates were excluded from the age model because they were out of stratigraphical order (). The cause of this stratigraphic reversal is not known but may reflect reworking of the shells from older deposits or be an expression the “Portlandia effect” (England et al. Citation2013). By extrapolating the sedimentation rate defined by the two deepest dated levels in the glaciomarine sediments (490 cm and the average of two dates at 573 cm) to the boundary, we estimated the age of the till/glaciomarine boundary to 11.5 cal ka BP.
The age model of 64PC () is based on six radiocarbon dates including one benthic/planktic pair and excluding one age that is out of stratigraphic order ( and ). Above the uppermost date (8.7 cal ka BP at 111 cm) the age model was extended linearly to its intersection with the Y-axis yielding a piston core top age of 6.0 cal ka BP. Similarly, the age model was extended past the dated intervals to obtain Bayesian age estimates to 440 cm.
Detrital carbonate and mineral facies
Detrital carbonate in Baffin Bay is an important proxy for glacial erosion by the Lancaster Sound Ice Stream (Andrews et al. Citation1998; Jenner, Campbell, and Piper Citation2018; Andrews, Jenner, and Campbell Citation2020). In the Lancaster Sound cores, detrital calcite and dolomite are very low in the till compared to the overlying glaciomarine and early postglacial units (). In 59CC, the detrital carbonate remains quite low in the lower interval of very dark brown glaciomarine sediments where >2 mm clast content is also low. Otherwise, the detrital carbonate varies around 40 percent in the glaciomarine sediments and declines in upper 150 cm of 59CC and in the upper 350 cm of 49CC. Though calcite is nearly absent in these uppermost intervals, dolomite retains a steady background of around 15 percent. In 64PC, detrital calcite and dolomite also decline after BBDC 0 in the overlying granule-rich mud, reaching an absence of calcite and fairly stable low dolomite values of 10 to 15 percent by 101 cm (). This sequence is very similar to the two Lancaster Sound cores but below our studied interval (440 cm) this core extends into black to very dark gray glaciomarine diamicton sediments rather than till (Jenner, Campbell, and Piper Citation2018; ), forming a similar sequence to the basal sequences in 49CC and 59CC ().
Five distinct mineral facies (MF) were defined (Figure S3). The CDT plot (Figure S4) indicates that these five MF were defined after four binary choices, with dolomite, quartz, and calcite being the most important minerals in the classification (Figures S3, S4). The number of samples that were misclassified only totaled 3 out of 140 and the confusion index was low for the vast majority of samples suggesting that the five MF reflect coherent changes in compositions and thus probably reflect changes in both sediment transport and provenance.
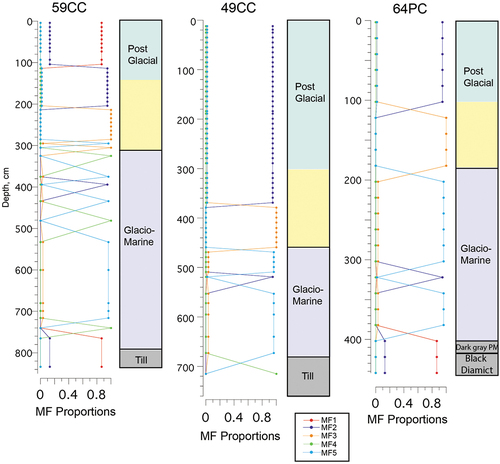
Downcore MF membership is used to evaluate changes in sediment provenance (). Till and the overlying sample at the base of the 59CC are assigned to MF1, which has <11 percent dolomite and <20 percent quartz (Figure S4). The upper meter of 59CC is also assigned to MF1. We note that these two intervals at the base and top of the core differ in their kaolinite content; the deep samples have 7 to 11 percent kaolinite, whereas kaolinite is <2 percent in the upper unit of MF1 and throughout all other core samples in the study except for the three samples in the black to dark gray units underlying the tan calcareous pebbly mud units in 64PC (386–440 cm). These samples, also with relatively high kaolinite, were assigned to MF1 (). In 49CC, the till is assigned to MF4, which is characterized by <20 percent dolomite and >20 percent quartz. However, this till sample comprises 47 percent quartz, the highest value in the data set (Figure S5), causing it to be assigned to MF4. The glaciomarine sediments are most frequently MF5, which is defined as >21 percent dolomite and >7 percent calcite (). Several glaciomarine sediment samples also classify into MF4 and MF2, especially in 59CC (). MF2 differs from MF1 by having 11 to 21 percent dolomite instead of <11 percent dolomite. At the boundary between the glaciomarine (blue interval) and the early postglacial (yellow interval), the MF transition in all cores to MF3. This facies differs from MF5 by having slightly lower calcite weight percentage (<7 percent calcite rather than >7 percent calcite). The sediments transition to MF2 as calcite and dolomite continue to decline in the upper parts of the cores, especially in the later postglacial (green) interval where a slight reduction in dolomite to <11 percent classifies these sediments in 59CC into MF1, although the mineral assemblages are not otherwise different.
Figure 6. Mineral cluster membership shown as proportions for each mineral facies presented alongside the four basic intervals denoted by the color boxes. The five mineral clusters denote the five mineral facies (MF) in the three cores.
Biogenic silica estimates
Biogenic silica abundance ascertained by FTIR is expressed as diatom abundance categories ranging between 0 and 6, with 6 being the highest (Supplemental Information and Figure S2). The pattern of diatom abundance is similar in all three cores. High abundances are registered in the upper part of the postglacial bioturbated mud, denoted by the green color (upper 140 cm in 59CC; upper 340 cm in 49CC; upper 101 cm in 64PC; ). Abundant, large centric diatoms were observed in the >63 µm foraminiferal samples in these intervals. We presume that the increased abundance of the large diatoms is responsible for the relative increase in diatom abundance shown by FTIR. Biogenic silica abundances are generally lower to absent in the glaciomarine sediments and the till (). In the dark gray and black units (385–440 cm) of 64PC the biogenic silica is up to category 2 but the source of the biogenic silica is unlikely to be large centric diatoms because these were not observed in the >63 µm fractions (). Intervals with relatively high values outside of the upper parts of the cores where large centric diatoms were observed may register small diatom species or siliclastic minerals that we cannot account for precisely but that overlap the absorbance peak of biogenic silica.
Foraminiferal assemblages
In the Lancaster Sound cores, benthic foraminiferal abundances (#/g dry sediment) ranged between 0 and 6,000 per gram (). Benthic faunal abundances were low in the pebbly mud and diamicton immediately above the till but rise toward the top of the glaciomarine unit (). Calcareous taxa form nearly 100 percent of the fauna in the glaciomarine section. Benthic abundances increase significantly in the overlying bioturbated mud unit, beginning c. 10.5 ka in both cores (). The planktic foraminiferal abundances also rise c. 10.5 cal ka BP in both cores. Foraminiferal abundances remain high until 150 cm (c. 8.3 cal ka BP) in 59 CC and until 310 cm in 49CC (). A gradual decline in the calcareous taxa percentages coincides with increasing agglutinated foraminifera and worsening preservation of calcareous fauna shown by pitted and fragmented calcareous tests (). An abrupt shift to nearly 100 percent agglutinated fauna with low faunal abundances and loss of planktic foraminifers occurs in the bioturbated mud above 145 cm, ~8.2 cal ka BP, in core 59CC (). A more gradual transition to dominantly (60 percent) agglutinated foraminifera occurs by 290 cm in 49CC, loosely constrained to ~7 cal ka BP ().
In 2013029-64PC, benthic foraminiferal abundances ranged between 19 and 1,125 per gram (). Benthic faunal abundances are low in the tan calcareous pebbly mud of BBDC 0 until 191 cm, 10.66 ka BP, and they increase in the overlying granule-rich bioturbated mud to reach maximum values of benthic and planktic fauna at 171 cm at 10.22/10.32 ka BP. Calcareous fauna are dominant until 121 cm. Planktic foraminifera are absent in the tan calcareous pebbly mud but rise in abundance in the bioturbated mud with granules lithofacies, reaching peak abundance at 171 cm, 10.22/10.32 ka BP; the rise in planktic foraminiferal abundances begins at 181 cm, ~10.5 cal ka BP (). As calcareous benthic and planktic fauna decline in abundance, the agglutinated foraminifera increase proportionally. Agglutinated fauna become consistently dominant by 91 cm, 20 cm above the uppermost 14C date in the core of 8.72 cal ka BP.
PCA biplots show the foraminiferal species loadings on the first two PCA axes along with the sample scores, which show the strength of association between downcore samples and the axes ( and Table S1). We limit our interpretations to the first two PCA axes. Faunal zones (FZs) based on CA of the foraminiferal assemblages are shown on the right side of the faunal diagrams ( and S6). Environmental preferences of important species are shown in .
Figure 7. Biplots of the first two principal component axes in (a) 59CC, (b) 49CC, and (c) 64PC, showing the sample scores (blue dots) and the species loadings (red triangles) on the axes. Blue labels denote agglutinated species and red labels denote calcareous species. Species loadings were scaled by 2.13 in (a), by 1.32 in (b), and by 2.77 in (c).
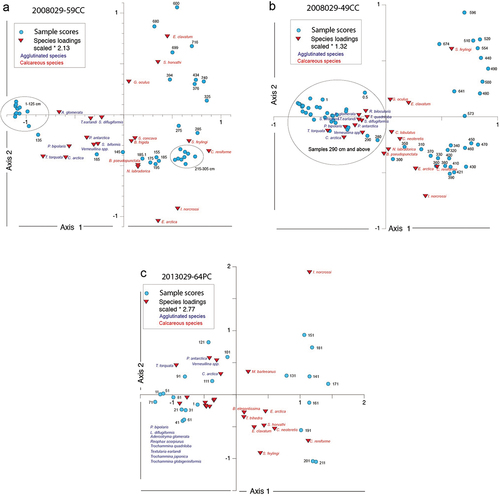
Figure 8. The downcore PCA Axis 1 (blue) and Axis 2 (red) scores ranged against the lithofacies, calibrated 14C ages, and benthic species percentages of the most important species in the PCA analysis in 59CC. Color schemes are the same as those defined in . Thin black lines running through plots denote faunal zones (FZs) defined by cluster analysis. FZ shown on far right.
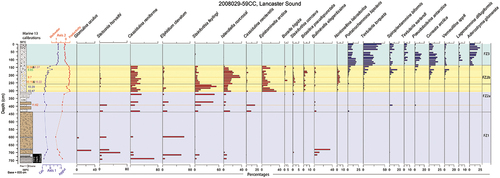
Figure 9. The downcore PCA Axis 1 (blue) and Axis 2 (red) scores ranged against the lithofacies, calibrated 14C ages, and benthic species percentages of the most important species in the PCA analysis in 49CC. Color schemes are the same as those defined in . Thin black lines running through plots denote FZs defined by cluster analysis. FZ shown on far right.
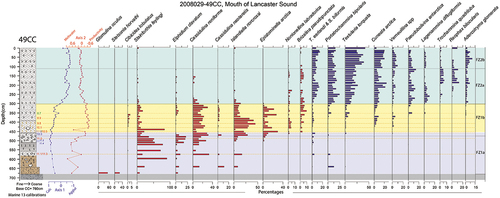
Figure 10. The downcore PCA Axis 1 (blue) and Axis 2 (red) scores ranged against the lithofacies, calibrated 14C ages, and benthic species percentages of the most important species in the PCA analysis in 64PC. Color schemes are the same as those defined in . Thin black lines running through plots denote FZs defined by cluster analysis. FZ shown on far right.
PCA results were very similar for the two Lancaster Sound cores (). Axis 1 explains over half of the variance in the data. It separates agglutinated and calcareous species. High negative scores on Axis 1 coincide with samples from the agglutinated faunal zone that forms the upper part of the cores (). PC Axis 2 explains about 15 percent of the variance in the faunal data in both cores. PCA Axis 2 sample scores separate samples from the pebbly mud and diamicton that form the glaciomarine lithofacies from samples in the overlying bioturbated mud lithofacies (). Axis 2 species loadings separate foraminiferal species associated with glacial meltwater, heavy sea-ice cover, and glaciomarine environments (Stainforthia feylingi, Elphidium clavatum, Glomulina oculus, and Stetsonia horvathi) from species that reflect episodic marine productivity and mobile sea-ice or sea-ice edge conditions such as Nonionella labradorica, Brizalina pseudopunctata, and Epistominella arctica and seasonally open-water conditions, such as Islandiella norcrossi and Cassidulina reniforme in samples from farther up core ().
Three FZs in 59CC () and two FZs in 49CC () were defined by CA (Figure S6). 59-FZ1 (765–481 cm) occurs in the glaciomarine pebbly mud and diamicton above the till. It is defined by Glomulina oculus, Cassidulina reniforme, and Elphidium clavatum, all species associated with marine-terminating glaciers and turbid glacial meltwater (Hald et al. Citation1994; Jennings et al. Citation2020; Jennings, Seidenkrantz, and Knudsen Citation2020) and oligotrophic species such as Stetsonia horvathi, a species associated with perennial sea-ice cover in the Arctic Ocean (Wollenburg, Knies, and Mackensen Citation2004; ). 59-FZ2 (434–135 cm) forms two subzones. 59-FZ2a (434–265 cm) is defined by addition of Cassidulina neoteretis and increased percentages of Stainforthia feylingi. Epistominella arctica, a species associated with episodic productivity and under mobile sea-ice conditions (Jennings, Seidenkrantz, and Knudsen Citation2020), enters the assemblages near the top of this zone as C. neoteretis declines. Near the top of 59CC-FZ2a, Epistominella arctica becomes dominant relative to S. feylingi. This shift is captured by negative scores on PCA Axis 2 (). However, a reversal in PCA Axis 2 scores at the top of 59CC-FZ2a is caused by a strong increase in S. feylingi. 59-FZ2b (265–145 cm) is marked by an abrupt decrease in S. feylingi to low values and significant increase in Islandiella norcrossi, an arctic species associated with modified (chilled and reduced salinity) Atlantic water (Cage et al. Citation2021). Axis 2 scores become consistently negative as species associated with marine productivity, such as Nonionellina labradorica, enter the assemblages (). Agglutinated species begin to increase within 59-FZ2b. The uppermost FZ, 59-FZ3 (135–1 cm), is marked by loss of calcareous fauna and rise in the agglutinated species such as Textularia torquata as the faunal abundances decline ( and 8). Adercotryma glomerata and Textularia earlandi enter the assemblages in 59-FZ3.
Faunal zone 49-FZ1a (674–480 cm) coincides with the pebbly mud and diamicton lithofacies overlying till (). Only the sample immediately above the till contains Glomulina oculus and Stetsonia horvathi. Glacial meltwater indicator species S. feylingi, E. clavatum, and C. reniforme become the dominant species above the deepest sample. C. neoteretis is present in this zone. Similar to 59-FZ2a, 49-FZ1b (470–310 cm) begins near the top of the glaciomarine sediments and is marked by increasingly negative loadings on PCA Axis 2 supported by increased E. arctica, C. reniforme, and I. norcrossi and much-diminished meltwater species S. feylingi and E. clavatum (). There is a marked reversal in the trend toward more negative scores on PCA Axis 2 associated with an abrupt rise in S. feylingi to very high percentages at the base of 49-FZ1b. Subsequently, 49-FZ1b is dominated by I. norcrossi and C. reniforme. Productivity indicator species, E. arctica, N. labradorica, and Brizalina pseudopunctata are consistently present in 49-FZ1b. Cibicides lobatulus, a current indicator species (Wollenburg and Mackensen Citation1998), and C. neoteretis are consistently present at low percentages in 49-FZ1b. E. clavatum returns to the assemblage near the top of 49-FZ1b. Although the agglutinated species are present in 49-FZ1b, they occur in higher percentages in 49-FZ2a (300–115 cm). Calcareous benthic foraminifers are poorly preserved. They linger in low percentages or disappear completely and faunal abundances decline () and scores on PCA Axis 2 trend toward positive values (). 49-FZ2b (105–0 cm), which is made up nearly exclusively of agglutinated species, is marked by dominance of Textularia torquata and is very similar to 59-FZ3.
In 64PC, PCA Axis 1 explains 55 percent of the variance in the data. It separates agglutinated and calcareous species (). High negative scores on Axis 1 coincide with samples from the agglutinated faunal zone that forms the upper meter of the core ( and 10). PCA Axis 2 explains 14.9 percent of the variance in the faunal data; it separates samples from the tan carbonate-rich pebbly mud from samples in the overlying bioturbated mud with dispersed IRD lithofacies up to 95 cm (). Species with negative high loadings on Axis 2 are a mixture of those associated with glacial meltwater, sea-ice cover, and water column stratification with subsurface Atlantic water and episodic marine productivity associated with mobile sea-ice (Stainforthia feylingi, Elphidium clavatum, C. reniforme, S. horvathi, C. neoteretis, C. reniforme, E. arctica). Islandiella norcrossi and Melonis barleeanus have positive loadings on Axis 2; I. norcrossi has extremely high loadings on this axis (). I. norcrossi is associated with modified Atlantic water or Arctic intermediate water formed from mixing of Atlantic water and freshwater of polar or meltwater origin (Cage et al. Citation2021) and suggests stable bottom salinities and seasonally open water ().
CA of the assemblages produced two main faunal zones, each of which is divided into two subzones ( and S6). 64-FZ1a (211–191 cm) coincides with tan calcareous pebbly mud. It is dominated by C. neoteretis, C. reniforme, and S. feylingi; C. neoteretis was abundant and well preserved and provides the radiocarbon age of 10.6 kaBP at the top of the zone. 64-F1b (181–131 cm) is marked by the rise of I. norcrossi as the dominant species and reduction in glacial meltwater species E. clavatum and S. feylingi. Nonionellina labradorica occurs in low percentages in this subzone. The overlying zone, 64-FZ2a (121–101 cm), occurs within the lower postglacial bioturbated mud. 64FZ2b (91–1 cm) is dominated by agglutinated foraminifera. Calcareous specimens are rare and poorly preserved. The most abundant species are Portatrochammina bipolaris and T. torquata. Adercotryma glomerata occurs for the first time in 64FA2b ().
Discussion
Comparison of the stratigraphies of the cores shows consistent patterns in the key proxies that demonstrate changes in the LSIS retreat positions () related to the four major paleoenvironmental intervals denoted by colored boxes in , 4, 8–11, and 13. The timing of the beginning and end of these four intervals is shown in and Figure S7. The gray interval in 59CC and 49CC represents ice-contact sediments (till); in 64PC, till does not occur in the upper 440 cm of the core. The blue interval in all cores demarcates glaciomarine sedimentation, which in 64PC includes the black diamicton and very dark gray pebbly mud (). In all cores this interval records LSIS retreat and glaciomarine sedimentation while Parry Channel was still closed by glacier ice. The overlying yellow interval begins with the opening of Parry Channel and marks early postglacial conditions. The green interval marks the opening of Nares Strait in the later postglacial period. The ages of the start and end of these four paleoenvironmental intervals and other key events is provided in and Figure S7, with their 2σ age limits. We interpret the LSIS retreat history and its relation to BBDC events in Baffin Bay, the evolution of marine environments in front of the retreating LSIS margin leading to opening of Parry Channel, followed by opening of Nares Strait in terms of the four zones.
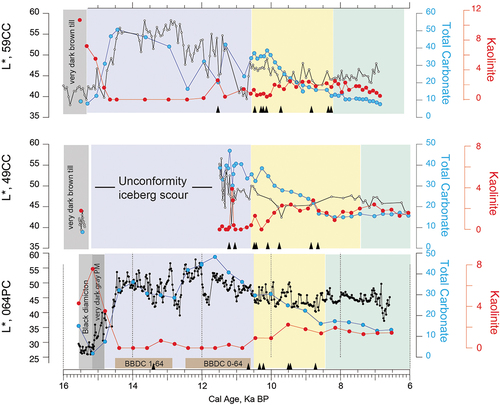
Figure 11. Lightness (L*), total carbonate, and kaolinite weight percentage against age in the three cores. Age control is shown by black triangles. Box colors as defined in . The brown bars indicate the mean ages of the beginning and end of BBDC 1 and BBDC 0 on the 64PC age model.
Provenance of till units and the timing of initial retreat of the Lancaster Sound Ice Stream: >~15.3 cal ka BP
In order to investigate the origin of the very dark brown till units, to explore the absence of ice-proximal glaciomarine sediments in 49CC, and to define the transition to the tan calcareous pebbly mud at higher resolution, we plotted the lightness data (L*) data for all three cores against total carbonate and kaolinite weight percentage versus age (). This comparison shows that the transition from very dark brown till to overlying dark brown stratified ice-proximal glaciomarine sediments in core 59CC at 768 cm is estimated to ~15.3 cal ka BP (16.1–14.6 cal ka BP at 2σ). The transition to the overlying tan, calcareous, glaciomarine sediments at 710 cm is estimated to be 14.7 cal ka BP (15.5–14.0 cal ka BP at 2σ; ). By contrast, the sharp transition from the very dark brown diamicton directly to tan, calcareous, glaciomarine sediments in 49CC lacks a dark brown stratified ice-proximal unit, and the age of the till/glaciomarine boundary is much younger, extrapolated to ~11.5 cal ka BP (). We therefore argue that the divergent age estimates of the till/glaciomarine boundary in 49CC and 59CC are due to an unconformity between the calcareous glaciomarine sediments and the till in 49CC (). Sub bottom profiles and multibeam bathymetry data over the 49CC core site () show that ice scour disturbance removed part of the glaciomarine sediment package (the Davis Strait silt; Bennett, Campbell, and Furze Citation2013; Bennett et al. Citation2014). The till/glaciomarine age estimate of ~11.5 cal ka BP indicates the timing of formation and infilling of the iceberg scour rather than the timing of grounded ice-stream retreat from the site of 49CC (). Therefore, the till/glaciomarine transition occurred prior to 11.5 cal ka BP. Multibeam bathymetry shows that the NW to SE iceberg scour was formed by an iceberg calved within Lancaster Sound and the basal age estimate of the core indicates that this occurred during the time of BBDC 0 as defined by the 64PC age model (). This would have been a large iceberg with a draft deep enough to scour into the seabed in 850-m present-day water depth (Bennett, Campbell, and Furze Citation2013; ).
The transition from kaolinite bearing, carbonate poor, black glaciomarine diamicton to very dark gray pebbly mud in 64PC is very similar in estimated age and mineralogy to the estimated age of the till/glaciomarine boundary in 59CC (). Relatively high kaolinite and low carbonate content occur in these units (), suggesting a common provenance. The most recently mapped LGM ice margins for confluent Lancaster Sound and Pond Inlet ice streams (Li, Piper, and Campbell Citation2011; Brouard and Lajeunesse Citation2017) and for outlets in the Scott and Buchan troughs (Brouard and Lajeunesse Citation2017) show that the LGM maximum ice extent was situated on the slope beyond 64PC (). Based on data from 59CC, the LSIS had retreated to the site of 59CC by ~15.3 cal ka BP and then began to deposit ice-proximal very dark brown sediments with kaolinite and coal as it retreated, suggesting glacial erosion of underlying Cretaceous and younger bedrock within Lancaster Sound. However, we interpret the Pond Inlet ice stream to have remained grounded near 64PC at ~15.5 cal ka BP, indicating that the LSIS had retreated far inland while ice remained on the shelf from lateral sources such as Pond Inlet/Eclipse Sound and Buchan Trough (). Cretaceous and younger bedrock underlying Eclipse Sound is inferred to be the origin of the black color and kaolinite content of the black diamicton and very dark gray pebbly mud in 64PC. These units in 64PC are attributed to glaciomarine sedimentation related to retreat of the Pond Inlet ice stream from a grounding zone wedge () ~15.5 cal ka BP, after the LSIS had retreated into Lancaster Sound (). These transitions in 59CC and 64PC overlap in age at 2σ ( and ).
Figure 12. LSIS retreat within Lancaster Sound. Ice retreat positions are interpreted from mapped glacial features and radiocarbon dating of sediment core lithofacies. Bedrock geology is adapted from Harrison, Brent, and Oakey (Citation2011). Superscript letters beside ice retreat ages attribute the ages to the following publications: 1 = Dalton et al. (Citation2020); 2 = McNeely et al. (Citation2013); 3 = MacLean et al. (Citation2017); 4 = Pieńkowski et al. (Citation2014); 5 = Brouard and Lajeunesse (Citation2017); 6 = Li, Piper, and Campbell (Citation2011). Glacier features first published in this study and ice retreat ages defined in this study have no superscript designation. PRI = Prince Regent Inlet; LI = Lowther Island. Red dotted line and gray solid lines demarcate ice margins at 10.9 and 11. 8 cal ka BP, respectively, from Dalton et al. (Citation2020).
Timing and significance of BBDC events relative to Lancaster Sound Ice Stream retreat: ~14.5–10.6 cal ka BP
Based on the age model for 64PC and the Ca/Ti, L*, and mineralogy determinations of BBDC 1 and 0 in 64PC (Jenner, Campbell, and Piper Citation2018), we estimate the mean age of the onset of BBDC 1 in 64PC at ~14.5 (15.1–14.0 ka BP at 2σ). A similar sequence in 59CC also shows that L* values increase as total carbonate content rises and kaolinite content falls over the course of the transition into the tan calcareous glaciomarine sediments marking the start of BBDC 1. The estimated mean age of the onset of BBDC 1 in 59CC is slightly older (200 years) than the estimate in 64PC but overlaps at 2σ (, S7 and ). In addition, based on the clear stratigraphic comparisons of the till/glaciomarine boundaries and the timing of the onset of BBDC 1 in 64PC and 59CC, we suggest that the LSIS must have retreated west of 59CC, much farther into Lancaster Sound than has previously been assumed (e.g., Dalton et al. Citation2020) when BBDC 1 began (). We place the 14.5 cal ka BP grounded ice margin west of Admiralty Inlet near the boundary between the Cretaceous and younger bedrock and the Paleozoic bedrock, which also matches the positions of two grounding zone wedges that indicate stabilization of the LSIS grounding line (Bennett, Campbell, and Furze Citation2013; Furze et al. Citation2018; ). These stratigraphic relations indicate that the onset of BBDC 1 postdates the initial retreat of the LSIS into Lancaster Sound (59CC) by ~800 years. Core 2011-804-010 in outer Lancaster Sound adjacent to Bylot Island has been interpreted to indicate that the LSIS had lifted from the seabed prior to 13.2 cal ka BP, but the chronology in 59CC suggests that the LSIS was not a direct contributor to the ice shelf history off Bylot Island (Furze et al. Citation2018).
By ~11.5 cal ka BP, the LSIS grounding line had retreated west of core 86027-154 in western Lancaster Sound (Pieńkowski et al. Citation2014; ). The Prince Regent Inlet moraine marks a large ice advance that postdates the ice retreat west of core 86027-154 (MacLean et al. Citation2017). MacLean et al. (Citation2017) suggested that the Gulf of Boothia ice stream (Margold, Stokes, and Clark Citation2015), feeding ice through Prince Regent Inlet, was a major component of the LSIS. Its re-advance post 11.5 cal ka BP likely contributed significant detrital carbonate during BBDC 0 until ~10.9 cal ka BP (Dalton et al. Citation2020) and possibly through ~10.3 ka when it had retreated far to the south, into the Gulf of Boothia (; Hooper Citation1996; Dalton et al. Citation2020). The ice margin in Lancaster Sound at 10.9 cal ka BP () from Dalton et al. (Citation2020) summarizes the work of Pieńkowski et al. (Citation2012, Citation2014) on cores 86027-144 and 97022-004PC. At this time, the final glacier ice blocking the connection between the Arctic Ocean and Baffin Bay was grounded in Barrow Strait with Innuitian ice extending into Lancaster Sound through Wellington Channel and Laurentide ice retreating back into Prince Regent Inlet. Retreat of the last grounded glacial ice occurred soon after 10.9 cal ka as marked by ice retreat from 97022-004PC at the mouth of McDougall Sound (Pieńkowski et al. Citation2013). Marine throughflow was established by 10.3 cal ka BP based on the age of the marine limit on Lowther Island at the western end of Barrow Strait (Dyke Citation1993; Pieńkowski et al. Citation2013; Dalton et al. Citation2020; ).
The proposed map of LSIS retreat into Lancaster Sound shown in provides a significant update to the most recent maps summarizing ice extent of the LSIS since the LGM (cf. Dalton et al. Citation2020). It illustrates that the ice margin had retreated into Lancaster Sound by ~15.3 cal ka BP (). The LSIS continued to retreat during the Bølling/Allerød interstadial and through the Younger Dryas (). We envision the ice margin retreat in Lancaster Sound during the BBDC events to be similar to that in the Laurentian Channel (southeastern Canada) after the LGM with extensive ice retreat via a calving bay leaving the adjacent land areas ice covered (cf Shaw et al. Citation2006) and with lateral ice streams extending into Lancaster Sound as the LSIS retreated.
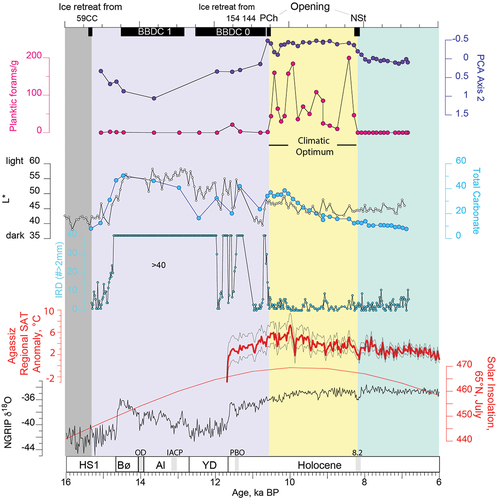
Figure 13. Proxies in core 59CC against age showing how the deglaciation and channel opening align with key climate events and environmental interpretations from the cores. From bottom to top of figure: X-axis indicates timing of stadial and interstadial events: O’stD = Oldest Dryas; Bø = Bølling; Al = Allerød; YD = Younger Dryas; OD = Older Dryas; IACP = Interallerød Cold Period; PBO = Preboreal Oscillation. Greenland ice core δ18O record from Northern Greenland Ice Core Project, NGRIP (Rasmussen et al. Citation2007); June insolation at 65°N in W/m2 (Berger and Loutre Citation1991); Agassiz ice core annual temperature based on elevation corrected δ18O data (Lecavalier et al. Citation2017). Core 59CC >2 mm IRD counts; total carbonate (calcite plus dolomite from quantitative XRD data) versus lightness L* data; planktic forams per gram and benthic foram assemblage loadings on Axis 2. Top of diagram shows the timing of BBDC 1 and 0 from core 64PC (this article) in brown and the timing of ice retreat from various core sites along Lancaster Sound as shown in . PCh = Parry Channel opening; NSt = Nares Strait opening.
Our Lancaster Sound reconstruction is consistent in timing with records documenting retreat of the Greenland Ice Sheet. In central West Greenland, LGM ice margin retreat from positions at or near the shelf edge had begun ~16–17 cal ka BP and the ice margin experienced extensive retreat by calving by ~15.1 cal ka BP, potentially initiated by relatively warm, submerged Atlantic water of the WGC (Slabon et al. Citation2016; Jennings et al. Citation2017). The large calving event of BBDC 1 was occurring while the Greenland Ice Sheet also was retreating by calving (Jennings et al. Citation2017). Several of the west Greenland cross-shelf troughs show evidence of a stillstand or re-advance of the Greenland ice sheet margin during the Younger Dryas (O’Cofaigh et al. Citation2013a; Dowdeswell et al. Citation2014; Hogan et al. Citation2016; Sheldon et al. Citation2016; Slabon et al. Citation2016) followed by renewed rapid ice retreat in the early Holocene (Lane et al. Citation2014; Sheldon et al. Citation2016). The occurrence of BBDC 1 and 0 sediments on the central West Greenland margin during its deglacial interval indicates that some of the icebergs calved from LSIS were free to drift across Baffin Bay to central West Greenland and suggests that the timing of deglaciation on the two margins was more similar than previously thought.
Paleoenvironments during ice retreat and deposition of BBDC 1 and 0: ~14.5–10.6 cal ka BP
In 59CC, cluster analysis provides two faunal zones in the glaciomarine sediments (blue interval) suggesting changing environments during deglaciation. 59CC-FZ1 aligns with ice proximal sediments and early BBDC 1, and 59CC-FZ2a aligns with BBDC 0 (). 59CC-FZ1 assemblages indicate proximal glaciomarine conditions consistent with a nearby calving ice margin in Lancaster Sound; the western of the two grounding zone wedges that are assigned to onset of BBDC 1 are 80 km from 59CC, providing context for the term “proximal” (). S. horvathi, present at high percentages (up to 60 percent) in 59CC-FZ1, suggests periods of heavy sea ice and low food supply. Dominance of E. clavatum at other intervals is a signal of turbid meltwater and some periods with less sea-ice cover (Vilks Citation1980; Jennings et al. Citation2020). In BBDC 0 (FZ2a) of 59CC, foraminiferal abundances increase and assemblages are consistent with increasingly ice distal conditions and water column stratification by meltwater in an ice-distal glaciomarine environment. The presence of large and numerous C. neoteretis provides clear evidence that Atlantic water from the WGC entered Lancaster Sound during BBDC 0 and could have played a role in forcing ice retreat (; cf. Wood et al. Citation2018).
Consistent with the idea that BBDC 1 sediments were removed from 49CC by an iceberg, this core has only a single faunal zone (FZ1) in the glaciomarine sediments above till (blue interval; ). The assemblages are similar to those of BBDC 0 (FZ2a) in 59CC and signify increasingly ice-distal glaciomarine conditions, with water column stratification due to meltwater continuing throughout the faunal zone but accompanied by episodic marine productivity near the top of the zone as evidenced by more negative values on PCA Axis 2 ().
The upper part of BBDC 0 analyzed in 64PC is also represented by a single faunal zone (64PC-FZ1a) with glaciomarine fauna and increasing C. neoteretis suggesting a stratified water column with Atlantic water that must have entered Baffin Bay from the West Greenland Current filling the water column on the upper slope beneath a glacial meltwater lid (). Faunal abundances begin to rise near the end of BBDC 0 indicating ameliorating conditions and decreasing meltwater influence ().
Open Parry Channel climatic optimum: 10.6 cal ka BP to 8.2 cal ka BP
We interpret the end of BBDC 0 to mark the opening of Parry Channel (). This event is indicated in all cores by a decrease in IRD and introduction of planktic foraminifera (). It is denoted by the yellow interval, which is dated to begin at 10.5 cal ka BP in 64PC and at 10.6 cal ka BP in 59CC and 49CC () and to end between 8.6 and 7.3 cal ka BP, with the best constraint on the age of the end of the yellow interval being in core 59CC at ~8.2 cal ka BP (8.0–8.4 cal ka 2 σ; , and S7). The end of the yellow interval corresponds well in time with the opening of Nares Strait c. 8.4 cal ka BP (Georgiadis et al. Citation2018; Jennings et al. Citation2022).
Table 4. Event timeline and boundary ages.
The yellow interval captures environmental conditions in the >2,000-year interval between the opening of Parry Channel and the opening of Nares Strait, making it a period with no modern analog. This interval is defined by relatively high abundances of well-preserved planktic and benthic foraminifera that are dominated by calcareous foraminifers (>80 percent), low IRD (clasts >2 mm) counts, low-to-moderate diatom (biogenic silica) abundances, and a steady decrease in calcite and total carbonate as ice margins retreated onto land (cf. Dalton et al. Citation2020). During this interval, Parry Channel was the primary outlet of ASW into Baffin Bay. Continued delivery of finely comminuted detrital carbonate in meltwater as the ice margins retreated onto land may be responsible for the good preservation of calcareous foraminifera and mollusk shells, but this may also be attributed to Atlantic water flow into northern Baffin Bay in the WGC. Progressive decline in detrital calcite and dolomite coincides with worsening preservation upward in this zone, and the proportion of ASW likely was increasing as the channels shallowed by isostatic adjustment (cf. Pieńkowski et al. Citation2014).
The transition from the glaciomarine environments of the blue interval to the early postglacial environments of the yellow interval is marked by significant changes in key benthic foraminiferal species (). In 64PC, C. neoteretis is a dominant species near the end of BBDC 0, indicating that subsurface chilled Atlantic water from the WGC was present in NW Baffin Bay beneath a surface-water lid of iceberg-laden glacial meltwater, noted in other Baffin Bay records (Knudsen et al. Citation2008; Jackson et al. Citation2017; Jennings et al. Citation2017, Citation2018, Citation2019; ). In both Lancaster Sound cores, ameliorating conditions began near the end of the glaciomarine “blue interval” (top of FZ1a) as shown by declining percentages of S. feylingi and E. clavatum and increasing E. arctica, indicating productivity associated with mobile sea ice (). Islandiella norcrossi became consistently the dominant benthic foraminiferal species in the yellow interval of all three cores until c. 9 cal ka BP. Although there is no modern setting that we are aware of that has upwards of 50 percent I. norcrossi, the closest modern analog is north of Iceland where ASW mixes with winter-cooled Atlantic water to form colder and less saline, dense upper Arctic intermediate water (Jennings et al. Citation2004; Cage et al. Citation2021). The paired benthic and planktic age differences in our study indicate a decreasing Δ age from the base (Δ = 330 years) to the middle (Δ = 215 years) to the top (Δ = 90 years) of the yellow interval (Figure S1). The dominance of I. norcrossi and the Δ values may indicate progressive water column mixing to the depths of the cores (<900 m) and formation of chilled and slightly freshened Arctic intermediate water in Baffin Bay during this 2,000-year period.
The appearance of species associated with mobile sea ice such as E. arctica and frontal conditions between Arctic and Atlantic water masses, such as N. labradorica, support the interpretation of an environment in the early Holocene with glacial meltwater declining and nutrient-rich ASW beginning to enter Baffin Bay to mix with Atlantic water of the WGC. This interval coincides nearly exactly with the early Holocene thermal maximum defined from reconstruction of surface air temperature in the Agassiz ice core record (Lecavalier et al. Citation2017) and with the early Holocene period of high summer insolation (). The presence of foraminiferal species related to marine productivity, abundant pyritized burrows, and high foraminiferal abundances indicates that this interval is a period of relatively increased flux of organic carbon to the seabed (). Ameliorated marine conditions are indicated by strongly negative scores on PCA Axis 2 in 49CC and 59CC () recording a shift from sea ice and meltwater-dominated paleoenvironments to mobile sea ice and seasonally open water conditions after 10.6 cal ka BP (). The paleo record of abundant bowhead whales (Balaena mysticetus) reconstructed from radiocarbon-dated bowhead whalebones in early Holocene raised marine sediments in the eastern Canadian Arctic (~10.5–9 ka) has been interpreted to indicate dispersed sea-ice conditions in an area of seasonal ice cover (Dyke et al. Citation1996), consistent with the foraminiferal records and is interpreted to reflect a climatic optimum in northern Baffin Bay ().
Nares Strait opening: <8.2 cal ka BP
The best constraint on the timing of the opening of Nares Strait in this study is from 59CC where paired benthic and planktic 14C dates were acquired at 155 cm and 15 cm below the top of the early postglacial yellow interval provide an age estimate of the boundary of ~8.2 cal ka BP (8.0–8.4 cal ka BP 2σ range; ). The increase in relative diatom abundance at or near the boundary is attributed, at least in part, to greater production and export to the seabed of large centric diatoms, associated with the enhanced Si and phosphate nutrient content provided by the greater inflow of ASW through Nares Strait (Jones et al. Citation2003). We attribute the coincident, nearly complete loss of calcareous foraminifera and the foraminiferal assemblage dominance by agglutinated taxa coinciding with low benthic and planktic foraminiferal abundances to accentuated CaCO3 dissolution. Quantitative XRD analysis shows nearly absent calcite and a steady background of ten to fifteen weight percentage dolomite. These observations fit with the known undersaturation of calcite and aragonite in ASW (Azetsu-Scott et al. Citation2010). CaCO3 dissolution also is accentuated by production and burial of organic matter and acidification of pore waters. Jackson et al. (Citation2021) attributed periods of agglutinated fauna in northeastern Baffin Bay to corrosive brines formed when the NOW polynya is strong and better preservation of CaCO3 foraminifera when the NOW polynya is weak. NOW-associated processes may explain the shifts from nearly 100 percent agglutinated to periods with up to 25 percent calcareous benthic foraminifera in the later postglacial interval (green). Unfortunately, altogether, processes that drive CaCO3 dissolution are preeminent after ~8.2 cal ka BP at these northwestern Baffin Bay sites and the cores do not contain enough well-preserved calcareous foraminifera for radiocarbon dating to ascertain the timing of the minor calcareous intervals in the post 8.2 cal ka BP sediments. This interval involves establishment of the modern oceanographic circulation after opening of Nares Strait, including formation of the NOW polynya, but the lack of dating control makes it difficult to determine when the NOW began in these cores.
Conclusions
We studied the retreat history of the LSIS leading to opening of Parry Channel and the paleoceanography accompanying ice retreat and opening of the throughflows between the Arctic Ocean and Baffin Bay that led to the modern ocean circulation. We focused on four environmental intervals in three cores to uncover how the environments in northern Baffin Bay responded to deglaciation resulting in the opening of the Parry Channel and the later opening of Nares Strait. By providing new radiocarbon dates, our study refines the timing of retreat of the LSIS, showing significant ice retreat into Lancaster Sound ~15.3 cal ka BP. This new timing indicates that BBDC events 1 and 0 did not begin until the LSIS had retreated ~450 km from its maximum LGM position offshore. The BBDC events 1 and 0 began once the LSIS had retreated back to the Paleozoic bedrock and began to calve icebergs laden with Paleozoic carbonate. Previous lack of recognition of glacial erosion of Cretaceous and younger mudstones suggests that there is a lot to learn about the ice stream history with the knowledge that kaolinite as well as detrital carbonate is a product of glacial erosion in Lancaster Sound and along the Baffin Island shelf (Harrison, Brent, and Oakey Citation2011; Jenner, Campbell, and Piper Citation2018; Andrews, Jenner, and Campbell Citation2020).
Using the best age constraint in core 64PC, the updated age for BBDC 1 is 14.5 to 12.8 cal ka BP and for BBDC 0, 12.5–10.5 cal ka BP (). These ages differ slightly from previously proposed ages for the onset and end of BBDC 1 of 15–14 cal ka BP (Q. Simon et al. Citation2016), 14.2–13.7 cal ka BP (Jackson et al. Citation2017), and 14.4–13.8 (Sheldon et al. Citation2016; Jennings et al. Citation2017) and the onset and end of BBDC 0 of 12.2–10.7 cal ka BP (Q. Simon et al. Citation2016) and 12.7–11 cal ka BP (Jackson et al. Citation2017). There are several detrital carbonate events in central West Greenland slope cores that partially coincide with BBDC 0, but carbonate deposition is not continuous throughout BBDC 0’s full age range: 13–12.3 cal ka BP and 11.6–11.4 cal ka BP (Jennings et al. Citation2017) as well as a detrital carbonate event on the shelf dating between 11.6 and 10.6 cal ka BP (Jennings et al. Citation2014). We find it reasonable that the ages of the BBDC events vary slightly in Baffin Bay and are discontinuous due to the likelihood that iceberg transit and melt would not be consistent throughout Baffin Bay. Core 64PC should have the most complete record of the full duration of BBDC events 1 and 0 because it was proximal to the LSIS outlet and in the path of other northern Baffin Bay potential ice stream sources of detrital carbonate, such as Smith Sound.
The end of BBDC 0 is marked by the opening of Parry Channel to Arctic–Atlantic throughflow in all three cores at 10.5/6 cal ka BP (). We consider this interval between 10.6 and 8.2 cal ka BP, with an open Parry Channel and closed Nares Strait as the Holocene climatic optimum in northern Baffin Bay. It is expressed by abundant planktic and benthic calcareous foraminifera with species assemblages expressive of sea-ice edge productivity and mixing of Atlantic water and ASW. Other regional climate records indicate warmer summer air temperatures and seasonal sea ice (Lecavalier et al. Citation2017; ). The progressively decreasing Δ of paired benthic and planktic dates within this zone and the dominance by I. norcrossi suggests increased mixing of Atlantic water and ASW in the upper ~850 m of the water column and potential formation of intermediate water in Baffin Bay during this period. Increasingly poor preservation of calcareous foraminiferal taxa in the upper part of the early postglacial interval is attributed to loss of the buffering effect of detrital carbonate and possibly the increasing inflow of ASW as Parry Channel shallowed.
The prominent increase in diatom abundance and shift to agglutinated fauna after ~8.2 cal ka BP is interpreted to reflect the opening of Nares Strait and influx of additional, nutrient-rich, corrosive ASW that marks the shift toward modern ocean circulation in Baffin Bay.
Supplemental Material
Download Zip (781 KB)Acknowledgments
We thank Kate Jarrett, GSC-Atlantic, for providing samples and access to data and the GSC core repository. Data generated from this study will be archived in the GSC-Atlantic Expedition database and the U.S. Arctic Data Center. We thank Wendy Roth, CU Boulder and Kate Jarrett, GSC-Atlantic for their help with sampling and sample processing. We thank Professor Marit-Solveig Seidenkrantz and an anonymous reviewer for their helpful comments and suggestions that improved this article.
Disclosure statement
No potential conflict of interest was reported by the authors.
Data Availability Statement
The data that support the findings of this study are openly available in the NSF Arctic Data Center at http://doi.org/10.18739/A2GM81Q31.
Supplementary material
Supplemental data for this article can be accessed online at https://doi.org/10.1080/15230430.2022.2110689.
Additional information
Funding
References
- Aksu, A. E., and D. J. W. Piper. 1987. Late Quaternary sedimentation in Baffin Bay. Canadian Journal of Earth Sciences 24 (9):1833–46. doi:10.1139/e87-174.
- Andrews, J. T. 2019. Baffin Bay/Nares Strait surface (seafloor) sediment mineralogy: Further investigations and methods to elucidate spatial variations in provenance. Canadian Journal of Earth Sciences 56 (8):814–28. doi:10.1139/cjes-2018-0207.
- Andrews, J. T., D. D. Eberl, and D. Scott. 2011. Surface (sea floor) and near-surface (box cores) sediment mineralogy in Baffin Bay as a key to sediment provenance and ice sheet variations. Canadian Journal of Earth Sciences 48 (9):1307–28. doi:10.1139/e11-021.
- Andrews, J. T., K. Jenner, and C. D. Campbell. 2020. Linking marine core lithofacies and mineral and grain-size compositions on the Baffin Island margin: Changes in provenance and transport. Journal of Sedimentary Research 90 (7):1–13. doi:10.2110/jsr.2020.50.
- Andrews, J. T., M. E. Kirby, A. Aksu, D. C. Barber, and D. Meese. 1998. Late Quaternary detrital carbonate events in Baffin Bay (671–741N): Do they correlate with and contribute to Heinrich events in the North Atlantic? Quaternary Science Reviews 17 (12):1125–37. doi:10.1016/S0277-3791(97)00064-4.
- Atkinson, E. A., M. Fustic, M. C. Hanna, and C. J. Lister. 2017. Qualitative assessment of petroleum potential in Lancaster Sound region, Nunavut. Geological Survey of Canada, Open File 8297, 18.
- Azetsu-Scott, K., A. Clarke, K. Falkner, J. Hamilton, P. E. Jones, C. Lee, B. Petrie, S. Prinsenberg, M. Starr, and P. Yeats. 2010. Calcium carbonate saturation states in the waters of the Canadian Arctic Archipelago and the Labrador Sea. Journal of Geophysical Research 115 (C11):C11021 doi:10.1029/2009JC005917.
- Belkin, I. M. 2004. Propagation of the “Great Salinity Anomaly” of the 1990s around the northern North Atlantic. Geophysical Research Letters 31 (8):L08306. doi:10.1029/2003GL019334.
- Belkin, I. M., S. Levitus, J. Antonov, and I. S.-A. Malmberg. 1998. “Great Salinity Anomalies” in the North Atlantic. Progress in Oceanography 41 (1):1–68. doi:10.1016/S0079-6611(98)00015-9.
- Bennett, R., D. C. Campbell, and M. F. A. Furze. 2013. The shallow stratigraphy and geohazards of the northern Baffin Island shelf: Studies to 2012. Geological Survey of Canada, Ottawa, Open File 7355, 42.
- Bennett, R., D. C. Campbell, M. F. A. Furze, and J. W. Haggart. 2014. The shallow stratigraphy and geohazards of the NE Baffin Shelf and Lancaster Sound. Bulletin of Canadian Petroleum Geology 62 (4):217–31. doi:10.2113/gscpgbull.62.4.217.
- Bennett, R., B. Maclean, S. Blasco, and J. Hughes-Clarke. 2016. Glacial lineations in Navy Board Inlet, Nunavut, Canada. Geological Society, London, Memoirs 46 (1):49–50. doi:10.1144/M46.56.
- Berger, A., and M. F. Loutre. 1991. Insolation values of the climate of the last 10 million years. Quaternary Science Reviews 10 (4):297–318. doi:10.1016/0277-3791(91)90033-Q.
- Blaauw, M., and J. A. Christen. 2011. Flexible paleoclimate age-depth models using an autoregressive gamma process. Bayesian Analysis 6 (3):457–74. doi:10.1214/ba/1339616472.
- Blake, W., Jr. 1992. Holocene emergence at Cape Herschel, east-central Ellesmere Island, Arctic Canada: Implications for ice sheet configuration. Canadian Journal of Earth Sciences 29 (9):1958–80. doi:10.1139/e92-153.
- Brouard, E., and P. Lajeunesse. 2017. Maximum extent and decay of the Laurentide ice sheet in Western Baffin Bay during the last glacial episode. Scientific Reports 7:10711. doi:10.1038/s41598-017-11010-9.
- Cage, A. G., A. J. Pieńkowski, A. Jennings, K. L. Knudsen, and M.-S. Seidenkrantz. 2021. Comparative analysis of six common foraminiferal species of the genera cassidulina, paracassidulina, and islandiella from the Arctic–North Atlantic domain. Journal of Micropalaeontology 40 (1):37–60. doi:10.5194/jm-40-37-2021.
- Campbell, C., and A. de Vernal. 2009. Marine geology and paleoceanography of Baffin Bay and adjacent areas Nain, NL to Halifax, NS August 28–September 23, 2008. Geological Survey of Canada Open File 5989:212.
- Campbell, D. C., K. A. Jenner, J. Higgins, and D. J. W. Piper. 2017. Analysis of piston cores and high-resolution sub-bottom profiler data, Baffin Bay slope, Nunavut. Geological Survey of Canada, Open File 8135, 179.
- Caralp, M. H. 1989. Abundance of Bulimia exilis and Melonis barleeanum: Relationship to the quality of marine organic matter, Geo-Marine Letters 9 (1):37–43. doi:10.1007/BF02262816.
- Corliss, B. H. 1991. Morphology and microhabitat preferences of benthic foraminifera from the north-west Atlantic Ocean, Marine Micropaleontology 17 (3–4):195–236. doi:10.1016/0377-8398(91)90014-W.
- Coulthard, R. D., M. F. A. Furze, A. J. Pienkowski, F. C. Nixon, and J. H. England. 2010. New marine DR values for Arctic Canada. Quaternary Geochronology 5 (4):419–34. doi:10.1016/j.quageo.2010.03.002.
- Curry, B., C. Lee, and B. Petrie. 2011. Volume, freshwater, and heat fluxes through Davis Strait, 2004-05. Journal of Physical Oceanography 41 (3):429–36. doi:10.1175/2010JPO4536.1.
- Curry, R., and C. Mauritzen. 2005. Dilution of the northern North Atlantic Ocean in recent decades. Science 308 (5729):1772–74. doi:10.1126/science.1109477.
- Dalton, A. S., M. Margold, C. R. Stokes, L. Tarasov, A. S. Dyke, R. S. Adams, S. Allard, H. E. Arends, N. Atkinson, J. W. Attig, et al. 2020. An updated radiocarbon-based ice margin chronology for the last deglaciation of the North American ice sheet complex. Quaternary Science Reviews 234:106223.
- De Angelis, H., and J. Kleman. 2005. Palaeo-ice streams in the northern Keewatin sector of the Laurentide ice sheet. Annals of Glaciology 42:135–44. doi:10.3189/172756405781812925.
- De Angelis, H., and J. Kleman. 2007. Palaeo-ice streams in the Foxe/Baffin sector of the Laurentide ice sheet. Quaternary Science Reviews 26 (9–10):1313–31. doi:10.1016/j.quascirev.2007.02.010.
- Dickson, R. R., J. Meincke, S. A. Malmberg, and J. Lee. 1988. The “Great Salinity Anomaly” in the northern North Atlantic 1968 – 1982. Progress in Oceanography 20 (2):103–51. doi:10.1016/0079-6611(88)90049-3.
- Dowdeswell, J. A., K. A. Hogan, C. O Cofaigh, E. M. G. Fugelli, J. Evans, and R. Noormets. 2014. Late Quaternary ice flow in a West Greenland fjord and cross-shelf trough system: Submarine landforms from Rink Isbrae to Uummannaq shelf and slope. Quaternary Science Reviews 92:292e309. doi:10.1016/j.quascirev.2013.09.007.
- Dunbar, M. 1969. The geophysical position of the North Water. Arctic 22 (4):438–41. doi:10.14430/arctic3235.
- Dyke, A. S. 1993. Glacial and sea level history of Lowther and Griffith Islands, northwest territories: A hint of tectonics. Géographie Physique et Quaternaire 47 (2):133–45. doi:10.7202/032944ar.
- Dyke, A. S. 1999. Last Glacial Maximum and deglaciation of Devon Island, Arctic Canada: Support for an Innuitian ice sheet. Quaternary Science Reviews 18 (3):393–420. doi:10.1016/S0277-3791(98)00005-5.
- Dyke, A. S., J. T. Andrews, P. U. Clark, J. H. England, G. H. Miller, J. Shaw, and J. J. Veillette. 2002. The Laurentide and Innuitian ice sheet during the Last Glacial Maximum. Quaternary Science Reviews 21 (1–3):9–31. doi:10.1016/S0277-3791(01)00095-6.
- Dyke, A. S., J. Hooper, and J. Savelle. 1996. A History of Sea Ice in the Canadian Arctic Archipelago Based on Postglacial Remains of the Bowhead Whale (Balaena Mysticetus). Arctic 49:211–320. doi:10.14430/arctic1200.
- Dyke, A. S., A. Moore, and L. Robertson. 2003. Deglaciation of North America: Thirty two digital maps at 1:7,000,000 scale with accompanying digital chronological database and one poster (two sheets) with full map series. Geological Survey of Canada Open File 1574.
- Eberl, D. D. 2003. User guide to RockJock: A program for determining quantitative mineralogy from X-ray diffraction data. United States Geological Survey, Open File Report 03-78, 40. Washington, DC.
- England, J. 1999. Coalescent Greenland and Innuitian ice during the Last Glacial Maximum: Revising the Quaternary of the Canadian High Arctic. Quaternary Science Reviews 18 (3):421–26. doi:10.1016/S0277-3791(98)00070-5.
- England, J., N. Atkinson, J. B. Bednarski, A. S. Dyke, D. A. Hodgson, and C. Ó’Cofaigh. 2006. The Innuitian ice sheet: Configuration, dynamics and chronology. Quaternary Science Reviews 25 (7–8):689–703. doi:10.1016/j.quascirev.2005.08.007.
- England, J., A. S. Dyke, R. D. Coulthard, R. Mcneely, and A. Aitken. 2013. The exaggerated radiocarbon age of deposit-feeding molluscs in calcareous environments. Boreas 42 (2):362–73. doi:10.1111/j.1502-3885.2012.00256.x.
- England, J., and M. F. A. Furze. 2008. New evidence from the western Canadian Arctic Archipelago for the resubmergence of Bering Strait. Quaternary Research 70 (1):60–67. doi:10.1016/j.yqres.2008.03.001
- Furze, M., A. Pieńkowski, M. McNeely, R. Bennett, and A. Cage. 2018. Deglaciation and ice shelf development at the northeast margin of the Laurentide ice sheet during the Younger Dryas chronozone. Boreas 47. doi:10.1111/bor.12265.
- Georgiadis, E., J. Giraudeau, A. Jennings, A. Limoges, R. Jackson, S. Ribeiro, and G. Massé. 2020. Local and regional controls on Holocene sea ice dynamics and oceanography in Nares Strait, Northwest Greenland. Marine Geology 422:106115. doi:10.1016/j.margeo.2020.106115.
- Georgiadis, E., J. Giraudeau, P. Martinez, P. Lajeunesse, G. St-Onge, S. Schmidt, and G. Massé. 2018. Deglacial to postglacial history of Nares Strait, Northwest Greenland: A marine perspective from Kane Basin. Climate of the Past 14 (12):1991–2010. doi:10.5194/cp-14-1991-2018.
- Grobe, H. 1987. A simple method for the determination of ice-rafted debris in sediment cores. Polarforschung 57 (3):123–26.
- Hald, M., and S. Korsun. 1997. Distribution of modern benthic foraminifera from fjords of Svalbard. European Arctic Journal of Foraminiferal Research 27 (2):101–22. doi:10.2113/gsjfr.27.2.101.
- Hald, M., and P. I. Steinsund. 1996. Benthic foraminifera and carbonate dissolution in the surface sediments of the Barents and Kara Sea. In Surface-sediment composition and sedimentary processes in central Arctic Ocean and along the Eurasian continental margin, eds. R. Stein, G. I. Ivanov, M. A. Levitan, and K. Fahl, vol. 212, 285–307. eds. R. Stein, G. I. Ivanov, M. A. Levitan, and K. Fahl. Amsterdam: Elsevier Science B.V.
- Hald, M., P. I. Steinsund, T. Dokken, S. Korsun, L. Polyak, and R. Aspeli. 1994. Recent and late Quaternary distribution of E. excavatum forma clavata in Arctic seas. Cushman Foundation Special Publication 32:141–53.
- Harrison, J., T. Brent, and G. Oakey. 2011. Chapter 40: Baffin Fan and its inverted rift system of Arctic eastern Canada: Stratigraphy, tectonics and petroleum resource potential. Geological Society, London, Memoirs 35 (1);595–626. doi:10.1144/M35.40.
- Hogan, K. A., C. Cofaigh, A. Jennings, J. Dowdeswell, and J. Hiemstra (2016). Deglaciation of a major palaeo-ice stream in Disko Trough, West Greenland. Quaternary Science Reviews. 147:5–26. doi:10.1016/j.quascirev.2016.01.018.
- Hooper, J. 1996. Glacial history and Holocene sea level regression in the Foxe/Baffin sector of the Laurentide ice sheet, Northwest Baffin Island, Arctic Canada. PhD thesis., University of Alberta, Edmonton.
- Ingram, R. G., J. Bacle, D. G. Barber, Y. Gratton, and H. Melling. 2002. An overview of physical processes in the North Water. Deep-Sea Research II 49 (22–23):4893–906. doi:10.1016/S0967-0645(02)00169-8.
- Jackson, R., A. Carlson, C. Hillaire-Marcel, L. Wacker, C. Vogt, and M. Kucera. 2017. Asynchronous instability of the North American-Arctic and Greenland ice sheets during the last deglaciation. Quaternary Science Reviews 164:140. doi 10.1016/j.quascirev.2017.03.020.
- Jackson, R., A. B. Kvorning, A. Limoges, E. Georgiadis, S. M. Olsen, P. Tallberg, T. J. Andersen, N. Mikkelsen, J. Giraudeau, G. Massé, et al. 2021. Holocene polynya dynamics and their interaction with oceanic heat transport in northernmost Baffin Bay. Scientific Reports 11 (1):10095. doi:10.1038/s41598-021-88517-9.
- Jahn, A., and M. M. Holland. 2013. Implications of Arctic Sea ice changes for North Atlantic deep convection and the meridional overturning circulation in ccsm4-cmip5 simulations. Geophysical Research Letters 40, 6, 11 6 doi:10.1002/grl.50183.
- Jakobsson, M., L. Mayer, B. Coakley, J. Dowdeswell, S. Forbes, B. Fridman, H. Hodnesdal, R. Noormets, R. Pedersen, M. Rebesco, et al. 2012. The International Bathymetric Chart of the Arctic Ocean (IBCAO) version 3.0. Geophysical Research Letters 39:12. doi:10.1029/2012GL052219.
- Jenner, K. A., D. Campbell, and D. Piper. 2018. Along-slope variations in sediment lithofacies and depositional processes since the Last Glacial Maximum on the northeast Baffin margin, Canada. Marine Geology 405:92–107. doi:10.1016/j.margeo.2018.07.012.
- Jennings, A. E., J. T. Andrews, C. Ó Cofaigh, G. St-Onge, S. Belt, P. Cabedo-Sanz, C. Pearce, C. Hillaire-Marcel, and D. C. Campbell. 2018. Baffin Bay paleoenvironments in the LGM and HS1: Resolving the ice-shelf question. Marine Geology 402:5–16. doi:10.1016/j.margeo.2017.09.002.
- Jennings, A. E., J. Andrews, C. Ó Cofaigh, G. St-Onge, C. Sheldon, S. Belt, P. Cabedo-Sanz, and C. Hillaire-Marcel. 2017. Ocean forcing of ice sheet retreat in central west Greenland from LGM to the early Holocene. Earth and Planetary Science Letters 472:1–13. doi:10.1016/j.epsl.2017.05.007.
- Jennings, A. E., J. T. Andrews, B. Oliver, M. Walczak, and A. Mix. 2019. Retreat of the Smith Sound Ice Stream in the early Holocene. Boreas 48 (4):825–40. doi:10.1111/bor.12391.
- Jennings, A. E., J. Andrews, C. Pearce, L. Wilson, and S. Olafsdottir. 2014. Detrital carbonate peaks on the Labrador shelf, a 13–7 ka template for freshwater forcing from the Hudson Strait outlet of the Laurentide ice sheet into the subpolar gyre. Quaternary Science Reviews 107:62-80.
- Jennings, A. E., J. Andrews, B. Reilly, M. Walczak, M. Jakobsson, A. Mix, J. Stoner, K. Nicholls, and M. Cheseby. 2020. Modern foraminiferal assemblages in northern Nares Strait, Petermann Fjord, and beneath Petermann ice tongue, NW Greenland. Arctic, Antarctic, and Alpine Research 52 (1):491–511. doi:10.1080/15230430.2020.1806986.
- Jennings, A. E., and G. Helgadóttir. 1994. Foraminiferal assemblages from the fjords and shelf of eastern Greenland. Journal of Foraminiferal Research 24 (2):123–44. doi:10.2113/gsjfr.24.2.123.
- Jennings, A., B. Reilly, J. Andrews, K. Hogan, M. Walczak, M. Jakobsson, J. Stoner, A. Mix, K. Nicholls, M. O’Regan, et al. 2022. Modern and early Holocene ice shelf sediment facies from Petermann Fjord and northern Nares Strait, northwest Greenland. Quaternary Science Reviews 283:107460. doi:10.1016/j.quascirev.2022.107460.
- Jennings, A. E., M.-S. Seidenkrantz, and K. L. Knudsen. 2020. Glomulina oculus, new calcareous foraminiferal species from the high Arctic: A potential indicator of a nearby marine-terminating glacier. Journal of Foraminiferal Research 50 (2):219–34. doi:10.2113/gsjfr.52.2.219.
- Jennings, A. E., C. Sheldon, T. M. Cronin, P. Francus, J. Stoner, and J. Andrews. 2011. The Holocene history of Nares Strait: Transition from glacial bay to Arctic-Atlantic throughflow. Oceanography 24 (3):26–41. doi:10.5670/oceanog.2011.52.
- Jennings, A. E., N. J. Weiner, G. Helgadóttir, and J. T. Andrews. 2004. Modern foraminiferal faunas of southwestern to northern Iceland shelf: Oceanographic and environmental controls. Journal of Foraminiferal Research 34 (3):180–207. doi:10.2113/34.3.180.
- Jones, E. P., J. H. Swift, L. G. Anderson, M. Lipizer, G. Civitarese, K. K. Falkner, G. Kattner, and F. McLaughlin. 2003. Tracing Pacific water in the North Atlantic Ocean. Journal of Geophysical Research 108 (C4):3116. doi:10.1029/2001JC001141
- Kassambara, A. (2017). Practical guide to cluster analysis in R. Unsupervised machine learning. Sthda.com.
- Kassambara, A., and F. Mundt. 2020. Factoextra: Extract and Visualize the Results of Multivariate Data Analyses. R Package Version 1.0.7. https://CRAN.R-project.org/package=factoextra
- Klassen, R. A., and D. A. Fisher. 1988. Basal flow conditions at the northeastern margin of the Laurentide ice sheet, Lancaster Sound. Canadian Journal of Earth Sciences 25 (11):1740–50. doi:10.1139/e88-165.
- Klein, B., B. LeBlanc, Z.-P. Mei, R. Beret, J. Michaud, C. J. Mundy, C. H. von Quillfeldt, M. Ève Garneau, S. Roy, Y. Gratton, et al. 2002. Phytoplankton biomass, production and potential export in the North Water. Deep Sea Research Part II: Topical Studies in Oceanography 49 (22–23):4983–5002. doi:10.1016/S0967-0645(02)00174-1.
- Knudsen, K. L., and M.-S. Seidenkrantz. 1994. Stainforthia feylingi new species from Arctic to subarctic environments, previously recorded as Stainforthia schreibersiana (Czjzek). Cushman Foundation for Foraminiferal Research, Special Publication 32:5–13.
- Knudsen, K. L., B. Stabell, M.-S. Seidenkrantz, J. Eirıksson, and W. Blake. 2008. Deglacial and Holocene conditions in northernmost Baffin Bay: Sediments, foraminifera, diatoms and stable isotopes. Boreas 37 (3)346–76. doi:10.1111/j.1502-3885.2008.00035.x.
- Koenigk, T., U. Mikolajewicz, H. Haak, and J. Jungclaus. 2007. Arctic freshwater export in the 20th and 21st centuries. Journal of Geophysical Research 112:G04S41.
- Korsun, S. A., and M. Hald. 1998. Modern benthic foraminifera off tide water glaciers, Novaja Semlja, Russian Arctic. Arctic and Alpine Research 30 (1):61–77. doi:10.2307/1551746.
- Korsun, S. A., I. A. Pogodina, S. L. Forman, and D. J. Lubinski. 1995. Recent foraminifera in glaciomarine sediments from three Arctic fjords of Novaja Zemlja and Svalbard, Polar Research 14 (1):15–32. doi:10.3402/polar.v14i1.6648.
- Korsun, S. A., and L. V. Polyak. 1989. Distribution of benthic foraminiferal morphogroups in the Barents Sea. Okeanologiya 29 (5):838–44.
- Kovach Computing Services. 1998. Multivariate statistical package, 127. Pentraeth, Wales: Kovach Computing Services.
- Lane, T., D. Roberts, B. Rea, C. Cofaigh, A. Vieli, and A. Rodes. 2014. Controls upon the Last Glacial Maximum deglaciation of the northern Uummannaq ice stream system, West Greenland. Quaternary Science Reviews 92:324–44. doi:10.1016/j.quascirev.2013.09.013.
- Lecavalier, B. S., D. A. Fisher, G. A. Milne, B. M. Vinther, L. Tarasov, P. Huybrechts, D. Lacelle, B. Main, J. Zheng, J. Bourgeois, et al. 2017. High Arctic Holocene temperature record from the Agassiz ice cap and Greenland ice sheet evolution. Proceedings of the National Academy of Sciences 114 (23):5952–57. doi:10.1073/pnas.1616287114.
- Lewis, L., D. Ponton, L. Legendre, and B. Leblanc. 1996. Springtime sensible heat, nutrients and phytoplankton in the Northwater Polynya, Canadian Arctic. Continental Shelf Research 16 (14):1775–92. doi:10.1016/0278-4343(96)00015-5.
- Li, G., D. J. W. Piper, and D. C. Campbell. 2011. The Quaternary Lancaster Sound trough-mouth fan, NW Baffin Bay. Journal of Quaternary Science 26 (5):511–22. doi:10.1002/jqs.1479.
- Lloyd, J. M. 2006. Modern distribution of benthic foraminifera from Disko Bugt, West Greenland. Journal of Foraminiferal Research 36 (4):315–31. doi:10.2113/gsjfr.36.4.315.
- MacLean, B., S. Blasco, R. Bennett, J. England, W. Rainey, J. Hughes-Clarke, and J. Beaudoin. 2010. Ice keel seabed features in marine channels of the central Canadian Arctic Archipelago: Evidence for former ice streams and iceberg scouring. Quaternary Science Reviews 29 (17–18):2280–310. doi:10.1016/j.quascirev.2010.05.032.
- MacLean, B., S. Blasco, R. Bennett, T. Lakeman, A. J. Pieńkowski, M. F. A. Furze, J. Hughes Clarke, and E. Patton. 2017. Seafloor features delineate Late Wisconsinan ice stream configurations in eastern Parry Channel, Canadian Arctic Archipelago. Quaternary Science Reviews 160:67–84. doi:10.1016/j.quascirev.2017.02.001.
- MacLean, B., and R. K. H. Falconer. 1979. Geological-geophysical studies in Baffin Bay and Scott Inlet-Buchan Gulf and Cape Dyer-Cumberland Sound areas of the Baffin Island shelf, Current Research Geological Survey of Canada 79-01B:231–44.
- MacLean, B., R. K. H. Falconer, and D. B. Clarke. 1978. Tertiary basalts of western Davis Strait: Bedrock core samples and geophysical data. Canadian Journal of Earth Sciences 15 (5):773–80. doi:10.1139/e78-083
- MacLean, B., G. Sonnichsen, G. Vilks, C. Powell, K. Moran, A. Jennings, D. Hodgson, and B. Deonarine. 1989. Marine geological and geotechnical investigations in Wellington, Byam Martin, Austin, and adjacent channels, Canadian Arctic Archipelago. Geological Survey of Canada, Paper, 89-11, 1–69.
- Margold, M., C. R. Stokes, and C. D. Clark. 2015. Ice streams in the Laurentide ice sheet: Identification, characteristics and comparison to modern ice sheets. Earth-Science Reviews 143:117–46.
- McNeely, R., and J. Brennan. 2005. Geological Survey of Canada revised shell dates. Geological Survey of Canada, Open File 5019, p. 530. Natural Resources Canada. doi:10.4095/221215.
- McNeely, M., M. F. A. Furze, A. J. Pienkowski, and R. Bennett. 2013. A late Quaternary deglacial record of Bylot Island and the eastern Northwest Passage, 168. Edmonton: CANQUA. Program and Abstracts.
- Melling, H., Y. Gratton, and G. Ingram. 2001. Ocean circulation within the North Water polynya of Baffin Bay. Atmosphere-Ocean 39 (3):301–25. doi:10.1080/07055900.2001.9649683.
- Miall, A. D., H. R. Balkwill, and W. S. Hopkins Jr. 1980. Cretaceous and Tertiary sediments of Eclipse Trough, Bylot Island area, Arctic Canada, and their regional setting. Geological Survey of Canada, Paper 79-23, 1–20.
- Miller, R. L., and J. S. Kahn. 1962. Statistical analysis in the geological sciences. New York: John Wiley and Sons, Inc.
- Münchow, A., K. K. Falkner, and H. Melling. 2006. Spatial continuity of measured seawater and tracer fluxes through Nares Strait, a dynamically wide channel bordering the Canadian Archipelago. Journal of Marine Research 65 (6):759–88. doi:10.1357/002224007784219048.
- Münchow, A., K. Kelly, K. K. Falkner, and H. Melling. 2015. Baffin Island and West Greenland current systems in northern Baffin Bay. Progress in Oceanography 132:305–37. doi:10.1016/j.pocean.2014.04.001.
- Ó Cofaigh, C., J. T. Andrews, A. E. Jennings, J. A. Dowdeswell, K. A. Hogan, A. A. Kilfeather, and C. Sheldon. 2013b. Glacimarine lithofacies, provenance and depositional processes on a West Greenland trough- mouth fan. Journal of Quaternary Science 28 (1):13–26. doi:10.1002/jqs.2569.
- Ó Cofaigh, C., J. A. Dowdeswell, A. E. Jennings, K. A. Hogan, A. Kilfeather, J. F. Hiemstra, R. Noormets, J. Evans, D. J. McCarthy, J. T. Andrews, et al. 2013a. An extensive and dynamic ice sheet on the west Greenland shelf during the last glacial cycle. Geology 41 (2):219–22. doi:10.1130/G33759.1.
- Parnell, J., S. Bowden, J. T. Andrews, and C. Taylor. 2007. Biomarker determination as a provenance tool for detrital carbonate events (Heinrich events?): Fingerprinting Quaternary glacial sources in Baffin Bay. Earth and Planetary Science Letters 257 (1–2):71–82. doi:10.1016/j.epsl.2007.02.021.
- Pico, T., J. X. Mitrovica, and A. C. Mix. 2020. Sea level fingerprinting of the Bering Strait flooding history detects the source of the Younger Dryas climate event. Science Advances 6 (9):eaay2935. doi:10.1126/sciadv.aay2935.
- Pieńkowski, A. J., J. H. England, M. F. A. Furze, S. Blasco, P. J. Mudie, and B. MacLean. 2013. 11,000 years of environmental change in the Northwest Passage: A multiproxy core record from central Parry Channel, Canadian High Arctic. Marine Geology 341:68–85. doi:10.1016/j.margeo.2013.04.008.
- Pieńkowski, A. J., J. H. England, M. F. A. Furze, B. MacLean, and S. Blasco. 2014. The late Quaternary environmental evolution of marine Arctic Canada: Barrow Strait to Lancaster Sound. Quaternary Science Reviews 91:184–203. doi:10.1016/j.quascirev.2013.09.025.
- Pieńkowski, A. J., J. H. England, M. F. A. Furze, F. Marret, F. Eynaud, G. Vilks, B. Maclean, S. Blasco, and J. D. Scourse. 2012. The deglacial to postglacial marine environments of SE Barrow Strait, Canadian Arctic Archipelago. Boreas 41 (2):141–79. doi:10.1111/j.1502-3885.2011.00227.x.
- Polyak, L., S. Korsun, L. A. Febo, V. Stanovoy, T. Khusid, M. Hald, B. E. Paulsen, and D. J. Lubinski. 2002. Benthic foraminiferal assemblages from the southern Kara Sea, a river-influenced Arctic marine environment. Journal of Foraminiferal Research 32 (3):252–73. doi:10.2113/32.3.252.
- Polyak, L., and A. Solheim. 1994. Late- and postglacial environments in the northern Barents Sea, west of Franz Josef Land. Polar Research 13 (2):197–207. doi:10.3402/polar.v13i2.6693.
- Praeg, D., B. Maclean, and G. Sonnichsen. 2007. Quaternary geology of the northeast Baffin Island continental shelf, Cape Aston to Buchan Gulf (70° to 72°N). Geological Survey of Canada, Open File 5409, 98
- Rasmussen, S. O., B. M. Vinther, H. B. Clausen, and K. K. Andersen. 2007. Early Holocene climate oscillations recorded in three Greenland ice cores. Quaternary Science Reviews 26 (15–16)1907–14. doi:10.1016/j.quascirev.2007.06.015.
- Reimer, P. J., E. Bard, A. Bayliss, J. W. Beck, P. G. Blackwell, C. B. Ramsey, P. M. Grootes, T. P. Guilderson, D. L. Hoffmann, A. G. Hogg, et al. 2013. IntCal13 and Marine13 radiocarbon age calibration curves 0-50,000 years cal BP. Radiocarbon 55 (4):1869–87. doi:10.2458/azu_js_rc.55.16947.
- Ribeiro, S., A. Limoges, G. Massé, K. L. Johansen, W. Colgan, K. Weckström, R. Jackson, E. Georgiadis, N. Mikkelsen, A. Kuijpers, et al. 2021. Vulnerability of the North Water ecosystem to climate change. Nature Communications 12 (1):4475. doi:10.1038/s41467-021-24742-0.
- Rudels, B. 2019. Arctic ocean circulation. In Encyclopedia of ocean sciences, eds. J. K. Cochran, J. H. Bokuniewicz, and L. P. Yager, vol. 3, 262–77.Amsterdam Netherlands: Elsevier. doi:10.1016/B978-0-12-409548-9.11209-6.
- Rytter, F., K. L. Knudsen, M.-S. Seidenkrantz, and J. Eiríksson. 2002. Modern distribution of benthic foraminifera on the North Icelandic shelf and slope. Journal of Foraminiferal Research 32(3):217–44. doi:10.2113/32.3.217.
- Schafer, C. T., and F. E. Cole. 1988. Environmental associations of Baffin Island fjord agglutinated foraminifera. Abhandlungen der Geologischen Bundesanstalt in Wien 41:307–23.
- Schroder-Adams, C. J., F. E. Cole, F. S. Medioli, P. J. Mudie, D. B. Scott, and L. Dobbin. 1990. Recent Arctic shelf foraminifera: Seasonally ice covered vs. perennially ice covered areas. The Journal of Foraminiferal Research. 20(1):8–36. doi:10.2113/gsjfr.20.1.8.
- Scott, D. B., and G. Vilks. 1991. Benthic foraminifera in the surface sediments of the deep-sea Arctic Ocean. The Journal of Foraminiferal Research 21 (1):20. doi:10.2113/gsjfr.21.1.20.
- Seidenkrantz, M.-S. 1995. Cassidulina tereti Tappan and Cassidulina neoteretis new species (Foraminifera): Stratigraphic markers for deep sea and outer shelf areas. Journal of Micropalaeontology 14 (2):145–57. doi:10.1144/jm.14.2.145.
- Seidenkrantz, M.-S. 2013. Benthic foraminifera as palaeo sea-ice indicators in the subarctic realm-examples from the Labrador Sea-Baffin Bay region. Quaternary Science Reviews 79:135–44. doi:10.1016/j.quascirev.2013.03.014.
- Serreze, M. C., A. P. Barrett, A. G. Slater, R. A. Woodgate, K. Aagaard, R. B. Lammers, M. Steele, R. Moritz, M. Meredith, and C. M. Lee. 2006. The large-scale freshwater cycle of the Arctic. Journal of Geophysical Research 111 (C11):C11010. doi:10.1029/2005JC003424.
- Shaw, J., D. Piper, G. B. J. Fader, E. King, B. Todd, T. Bell, M. J. Batterson, and D. Liverman. 2006. A conceptual model of the glaciation of Atlantic Canada. Quaternary Science Reviews 25 (17–18):2059–81. doi:10.1016/j.quascirev.2006.03.002.
- Sheldon, C., A. Jennings, J. T. Andrews, C. Ó Cofaigh, K. Hogan, J. A. Dowdeswell, and M. S. Seidenkrantz. 2016. Ice stream retreat following the LGM and onset of the west Greenland current in Uummannaq Trough, west Greenland. Quaternary Science Reviews 147:27–46. doi:10.1016/j.quascirev.2016.01.019.
- Simon, Q., C. Hillaire-Marcel, G. St-Onge, and J. T. Andrews. 2014. North-eastern Laurentide, western Greenland and southern Innuitian ice stream dynamics during the last glacial cycle. Journal of Quaternary Science 29 (1):14–26. doi:10.1002/jqs.2648.
- Simon, K. M., T. S. James, and A. S. Dyke. 2015. A new glacial isostatic adjustment model of the Innuitian ice sheet, Arctic Canada. Quaternary Science Reviews 119:11–21. doi:10.1016/j.quascirev.2015.04.007.
- Simon, Q., N. Thouveny, D. L. Bourlès, L. Nuttin, C. Hillaire-Marcel, and G. St-Onge. 2016. Authigenic 10Be/9Be ratios and 10Be-fluxes (230Thxs-normalized) in central Baffin Bay sediments during the last glacial cycle: Paleoenvironmental implications. Quaternary Science Reviews 140:142–62. doi:10.1016/j.quascirev.2016.03.027.
- Slabon, P., B. Dorschel, W. Jokat, R. Myklebust, D. Hebbeln, and C. Gebhardt. 2016. Greenland ice sheet retreat history in the northeast Baffin Bay based on high-resolution bathymetry. Quaternary Science Reviews 154:182–98. doi:10.1016/j.quascirev.2016.10.022.
- Steinsund, P. I. 1994. Benthic foraminifera in surface sediments of the Barents and Kara seas: modern and late Quaternary applications.” PhD thesis., University of Tromsø, Tromsø, University of Tromsø, 111 pp.
- Tang, C., C. Ross, T. Yao, B. Petrie, B. Detracey, and E. Dunlap. 2004. The circulation, water masses and sea-ice of Baffin Bay. Progress in Oceanography 63 (4):183–228. doi:10.1016/j.pocean.2004.09.005.
- Tiedemann, J. 2012, Parallel Data, Tools and Interfaces in OPUS. In Proceedings of the 8th International Conference on Language Resources and Evaluation (LREC'2012).
- Tremblay, J.-E., Y. Gratton, J. Fauchot, and N. M. Price. 2002. Climatic and oceanic forcing of new, net, and diatom production in the North Water. Deep Sea Research Part II: Topical Studies in Oceanography 49 (22–23):4927–46. doi:10.1016/S0967-0645(02)00171-6.
- Vavrus, S. J., A. M. Holland, A. Jahn, D. A. Bailey, and B. A. Blazey. 2012. Twenty-first-century Arctic climate change in CCSM4. Journal of Climate 25 (8):2696–710. doi:10.1175/JCLI-D-11-00220.1.
- Vermeesch, P. (2006). Tectonic discrimination of basalts with classification trees. Geochimica et Cosmochimica Acta, 70 (7):1839–48. doi:10.1016/j.gca.2005.12.016.
- Vilks, G. 1980. Postglacial basin sedimentation on Labrador shelf. Geological Survey Paper 78-28, 17.
- Vogel, H., P. Rosén, B. Wagner, M. Melles, and P. Persson. 2008. Fourier transform infrared spectroscopy, a new cost-effective tool for quantitative analysis of biogeochemical properties in long sediment records. Journal of Paleolimnology 40 (2):689–702. doi:10.1007/s10933-008-9193-7.
- Williams, K. M., J. T. Andrews, A. E. Jennings, S. K. Short, W. N. Mode, and J. P. M. Syvitski. 1995. The Eastern Canadian Arctic at ca. 6 ka: A time of transition. Geographie Physique et Quaternaire 49 (1):13–27.doi: 10.7202/033026ar.
- Wollenburg, J. E., J. Knies, and A. Mackensen. 2004. High-resolution paleoproductivity fluctuations during the past 24 kyr as indicated by benthic foraminifera in the marginal Arctic Ocean. Palaeogeography, Palaeoclimatology, Palaeoecology. 204 (3–4):209–38. doi: 10.1016/S0031-0182(03)00726-0.
- Wollenburg, J. E., and A. Mackensen. 1998. Living benthic foraminifera from the central Arctic Ocean: Faunal composition, standing stock and diversity, Marine Micropaleontology, 34:153–85 doi: 10.1016/S0377-8398(98)00007-3.
- Wood, M., E. Rignot, I. Fenty, D. Menemenlis, R. Millan, M. Morlighem, J. Mouginot, and H. Seroussi. 2018. Ocean-induced melt triggers glacier retreat in Northwest Greenland. Geophysical Research Letters 45 (16):8334–42. doi: 10.1029/2018GL078024.
- Yang, Q., T. H. Dixon, P. G. Myers, J. Bonin, D. Chambers, M. R. van den Broeke, M. H. Ribergaard, and J. Mortensen. 2016. Recent increases in Arctic freshwater flux affects Labrador Sea convection and Atlantic overturning circulation. Nature Communications 7 (1):10525. doi: 10.1038/ncomms10525.