
ABSTRACT
Environmental changes for the past ca. 50 years were studied in a short sediment core from inner Krossfjorden, Svalbard, investigating benthic foraminifera and stable isotopes (δ18O, δ13C). A depth–age model based on anthropogenic 137Cs time markers indicates that record covers the period from 1955 to 2007 and has sediment accumulation rates of ca. 0.3 to 1 cm/year. The benthic foraminifera are arctic and/or common in glaciomarine environments. Six fauna assemblages were identified using stratigraphically constrained cluster analysis. Benthic foraminiferal fauna assemblages are mainly dominated by Cassidulina reniforme. Elphidium clavatum is dominant from 1973 to 1986 and 2002 to 2007, likely due to greater turbidity in the water column. We interpret the increased percentages of Spiroplectammina biformis over the same intervals to reflect a slightly lower salinity probably caused by meltwater. During a short time period, 1970 to 1973, Stainforthia concava dominates the benthic foraminiferal fauna interpreted to reflect increased productivity within a marginal ice zone. Other species as Islandiella norcrossi, Nonionellina labradorica, Islandiella helenae, and Melonis barleanus also indicate more nutrient-rich waters are present but not very abundant throughout the record probably due to the glacier proximal position of the study site. The stable isotope record (δ18O) shows lighter values from 2001 to 2007, which seem to correlate well with oceanographic monitoring data showing increasing core temperatures of West Spitsbergen Current.
Introduction
The Arctic has undergone great changes in recent decades. Air temperature has increased, glaciers and sea ice have declined, and ocean temperatures are increasing (e.g., Hanssen-Bauer et al. Citation2019). In addition to a warming of arctic water masses, they are becoming less stratified, a trend interpreted as “Atlantification” (e.g., Ingvaldsen et al. Citation2021). These changes have been documented using instrumental oceanographic records; for example, ocean temperature and sea ice extent. However, these records are limited spatially and temporally. In Svalbard, one oceanographic record from Isfjorden goes back ca. 150 years (Pavlov et al. Citation2013), whereas others only go back ca. 30 to 60 years. The oceanography of Kongsfjorden in western Svalbard is one of these shorter records because it has only been monitored on a regular basis since 1994 (Hop and Wiencke Citation2019). In this study, we aim to reconstruct bottom water conditions in the Kongsfjorden–Krossfjorden fjord system on a longer temporal scale using marine proxy data based on benthic foraminifera (fauna assemblages and stable isotope analysis). By reconstructing a record that goes farther back than the monitoring data, it is possible to evaluate the recent environmental changes beyond the instrumental record. To obtain data on temperature, salinity, or other environmental parameters of the water masses from the past when it was not possible to get instrumental measurements of these factors, fossil microfauna (foraminifera) from the marine sediments can be investigated together with their chemical composition. Benthic foraminifera are good monitors of environmental changes because they are very abundant in the surface sediments and very diverse even in arctic coastal and fjord settings (Murray Citation2006). Furthermore, they have a short life cycle, enabling a quick response to environmental changes. After death, the shells of the benthic foraminifera are preserved in the sediment, enabling baseline studies of conditions back in time without anthropogenic influence (e.g., Schönfeld et al. Citation2012). Annual sampling of modern benthic foraminifera in Kongsfjorden has shown how changes in species composition and changes of foraminiferal production reflect changing water masses (Jernas et al. Citation2018). Paleoceanographic records from Svalbard based on benthic foraminifera and stable isotope analysis (δ13C, δ18O) have also proved to reflect ocean–atmosphere fluctuations on a longer timescale (e.g., Skirbekk et al. Citation2010; Jernas et al. Citation2013; Rasmussen et al. Citation2014). Studies from outer Kongsfjorden and Hinlopen north of Svalbard based on benthic foraminifera show generally warmer and less glacially influenced conditions, presumably related to enhanced inflow of Atlantic Water (AW) during the last century (Jernas et al. Citation2013). A paleoceanographic record based on diatoms has already been established in Krossfjorden by Guruvayoorappan et al. (Citation2020) using a multicore from the same cast as the current study. The reconstructions show that sea surface temperatures (SSTs) have increased and sea ice has decreased over the last sixty years (Guruvayoorappan et al. Citation2020). Based on diatom assemblages, Guruvayoorappan et al. (Citation2020) suggested that the sea surface warming and decreasing sea ice are caused by greenhouse gas forcing and ocean–atmospheric interaction rather than an increasing influence from AW. In this study, we aim to investigate the benthic environment and fluctuations of bottom water conditions using benthic foraminifera.
Study area
Krossfjorden is part of the Kongsfjorden–Krossfjorden system located in West Spitsbergen (). Krossfjorden is a ca. 30 km long and relatively narrow fjord (4 km) with water depths reaching ca. 400 m (MacLachlan, Howe, and Vardy Citation2010). The fjord head is dominated by a tidal glacier, Lilliehöökbreen, with a glacier front approximately 4 km from the current core site during the time of the sampling in 2016 (). The water masses in Krossfjorden are influenced by meltwater from the glacier and sea ice in addition to inflowing water masses from the shelf. Relatively warm AW flows north with the West Spitsbergen Current (WSC) along the margin of West Spitsbergen () and comes onto the shelf with the Spitsbergen Trough Current and into the Kongsfjorden–Krossfjorden system at deep to intermediate water depths (e.g., Nilsen et al. Citation2016). Cold, less saline Arctic water masses also flow into the fjord system from the Spitsbergen Polar Current (Svendsen et al. Citation2002; Cottier et al. Citation2007). Meltwater from the tidal glaciers greatly influences the inner part of Krossfjorden, making the water masses generally colder and less saline than the outer part of the fjord, also resulting in less marine productivity and biomass in the inner part of Krossfjorden (Piquet et al. Citation2014). The suspended sediments in meltwater plumes released from the meltwater also increase the turbidity and reduce the light penetration (e.g., Keck et al. Citation1999). The sediment-charged meltwater affects all trophic levels and the benthic ecosystem (e.g., Włodarska-Kowalczuk, Pearson, and Kendall Citation2005). Seasonal sea ice is formed in the inner parts of the Kongsfjorden–Krossfjorden system fjord during winter, the inner parts become land fast, and all sea ice breaks up in late spring/early summer (e.g., Svendsen et al. Citation2002; Pavlova, Gerland, and Hop Citation2019). The sea ice melting and meltwater from the glacier make the upper water column less dense, driving an estuarine circulation that brings AW into the fjord at depth (e.g., Svendsen et al. Citation2002). This is, however, a less important driver because it has been shown that local winds drive the inflow of AW during both summer and winter (Sundfjord et al. Citation2017). In addition to melting sea ice, the solar radiation warms the surface water masses in the fjord, which also decreases the density and strengthens stratification (). The density of the upper water masses increases again during autumn and winter when they cool, and brines are released during sea ice formation. When the upper water masses become dense enough, vertical mixing occurs together with sinking of brines, breaking down the stratification (e.g., Cottier et al. Citation2010; Tverberg et al. Citation2019).
Figure 1. (a) Overall map showing the location of Svalbard and the study area. (b) Bathymetric map showing the main surface currents, West Spitsbergen Current (WSC) and East Spitsbergen Current (ESC). (c) Bathymetric map of Krossfjorden showing the core site (green filled circle) and additional surface currents, Spitsbergen Polar Current (SPC) and Spitsbergen Trough Current (STC). Additionally, dashed purple line indicates the inflowing Atlantic Water (AW) to Krossfjorden at deep to intermediate water depths. White dashed line indicates the direction of meltwater from the glacier front.
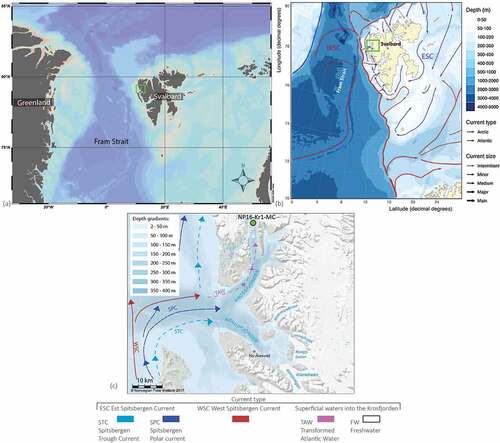
Figure 2. Close-up of the inner part of Krossfjorden showing the site of NP16-Kro1-MC A and the glacier front positions of Lilliehöökbreen (König, Kohler, and Nuth Citation2013; Moholdt et al. Citation2021). Scale is indicated in the figure.
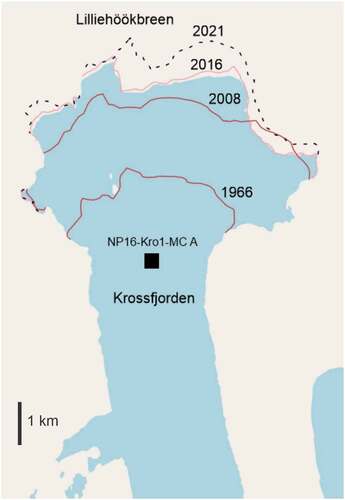
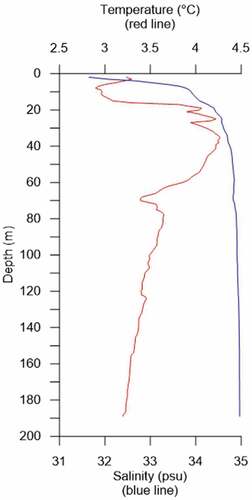
Figure 3. Temperature (red line) and salinity profile (blue line) from CTD (conductivity, temperature and density) cast carried out prior to coring, 2 August 2016 (Husum and Wold Citation2016).
Over the last five decades, AW inflow and sea-ice cover in the Kongsfjorden–Krossfjorden system have changed. In general, the temperature of AW within WSC on the shelf outside of the Kongsfjorden–Krossfjorden system has increased approximately 1°C from 1962 to 2020 (Norwegian Polar Institute Citation2022a, Citation2022b). The inflow of AW into West Spitsbergen fjords influences the tidewater glaciers and may accelerate the tidewater glacial melting (e.g., Luckman et al. Citation2015). Further, it has been demonstrated that calving rates of a tidewater glacier in the adjoining Kongsfjorden were strongly correlated with ocean temperatures during the 2016 melt season (Schild et al. Citation2018). All monitored glacier-covered areas in Svalbard have decreased on average by 7 percent when comparing their area from the period 1961–1990 to the 2000s (Hanssen-Bauer et al. Citation2019). This is also observed in Krossfjorden as the glacier front of the Lilliehöökbreen has generally retreated () since its first observation was recorded (König, Kohler, and Nuth Citation2013). Overall seasonal sea-ice cover (length of season with sea ice, geographical extent and thickness) in fjords on Western Spitsbergen has also decreased during the past two decades (e.g., Pavlova, Gerland, and Hop Citation2019; Johansson et al. Citation2020).
Material and methods
A 32-cm-long sediment core NP16-Kro1-MC-A was collected from a water depth of approximately 106 m in the inner part of Krossfjorden (79°17.76′N; 11°36.48′E) from R/V Lance in early August 2016 using a multicorer. The multicorer is equipped with six transparent tubes with an inner diameter of 10.4 cm and a length of 80 cm. The core was sampled at 1-cm resolution immediately onboard in order to avoid any postrecovery compaction. One sediment core from the same cast was opened, showing homogenous marine mud, and when extruding NP16-Kro-MC-A it was confirmed that the cores consisted of homogenous marine mud.
Chronology
Guruvayoorappan et al. (Citation2020) developed a depth–age model for the multicores from the current study site using Bayesian techniques in the OxCal 4.2 calibration programme (Bronk Ramsey Citation2009) and two anthropogenic 137Cs time markers from NP16-Kro1-MC-B and the age of the core top (). The sediment cores from the cast were undisturbed and appeared very similar regarding length, surface, and homogenous down-core lithology. Hence, the depth–age model from NP16-Kro1-MC-B (length 33 cm) was applied to the current sediment core NP16-Kro1-MC-A ().
Table 1. Time markers (core depth and age) used for developing depth–age model by Guruvayoorappan et al. (Citation2020).
Analytical methods
The samples were stored at maximum 5°C until they were oven-dried overnight at 50°C and wet-sieved using the mesh size of 63 µm following Murray (Citation2006). After drying, the >63 µm size fraction was dry-sieved at the 100 µm size. The ˃100 µm fraction was used for foraminiferal analysis (Knudsen and Austin Citation1996). At least 300 benthic specimens were picked and identified to species level, following the benthic taxonomy by Ellis and Messina (Citation1940–present), Loeblich and Tappan (Citation1987), and Darling et al. (Citation2016). Flux of foraminifera was calculated by multiplying concentration (individuals * g−1) with sediment accumulation rate (cm * year−1) and bulk sediment density (g * cm−3) following Ehrmann and Thiede (Citation1985). Bulk sediment density was assumed to be 0.5 g * cm−3 following Jernas et al. (Citation2013). Number of species, dominance (Simpson Citation1949), and Shannon-Wiener Index (H; Buzas and Gibson Citation1969) were calculated and a stratigraphically constrained cluster analysis of the samples was done using the software Paleontological Statistics PAST (Hammer, Harper, and Ryan Citation2001). Stable oxygen and carbon isotope values were measured on tests from Cassidulina reniforme from the 100 µm to 1 mm size fraction. The analysis of stable isotopes was performed at the Muséum National d’Histoire Naturelle, Paris, using a Thermo Fisher Scientific gas mass spectrometer (Delta V Advantage). Reproducibility was ±0.03 per mill for δ13C and ±0.04 per mill for δ18O. All isotopic data were expressed in per mill unit vs VPDB (Vienna Pee Dee Belemnite) calcite standard.
Results
The investigated record covers the period 1956 to 2007 (). The concentration of benthic foraminifera varies between 22 and 140 specimens per gram of dry sediment (). The calcareous benthic foraminifera are well preserved, showing no signs of dissolution. The flux varies in older parts of the record from 1956 to 1973 around an average value of 18 specimens/cm2/year (). It decreases and increases from 1973 to 1986 with an average value of 10. After 1986 it shows an increasing trend, reaching 42 specimens/cm2/year. The calcareous specimens constitute between 62 and 84 percent of the fauna assemblage with the lowest values in the period 1973 to 1986 (). Here the agglutinated specimens constitute their maximum part in the whole record (up to 38 percent). A total of fifty-seven species have been identified, showing an increasing trend from 1970 toward 2007, where the maximum amount of species (thirty-three) is observed (). Dominance is between 0.1 and 0.3 and the Shannon-Wiener Index (H) is on average 2.2 (). The highest values of dominance are found during two separate intervals, 1958 to 1970 and 1986 to 2002.
Figure 4. Concentration (individuals * g−1) and flux (individuals * cm−2 * year−1) of benthic foraminifera in core NP16-Kro1-MC A, percentage of calcareous and agglutinated forms, and diversity parameters. The shaded areas show the fauna assemblage zones identified by cluster analysis.
The stratigraphically constrained cluster analysis reveals six clusters and foraminiferal assemblage zones (). The foraminiferal assemblage zones encompass from one to seven samples each covering from two to sixteen years (). It has to be noted that each age has a range that may be up to eighteen years on the 95.4 percent confidence level (). The oldest foraminiferal assemblage zone (Zone 1) ranges from 1956 to 1958. This foraminiferal assemblage zone is dominated by Cassidulina reniforme, constituting 26 to 29 percent of the fauna assemblage (). The agglutinated species Labrospira crassimargo is also very frequent at 12 to 18 percent (). Other frequent species are Stainforthia concava, Elphidium clavatum, and Islandiella norcrossi that reach up to 11, 9, and 8 percent, respectively. Quinqueloculina agglutinans and Spiroplectammina biformis constitute on average 9 and 7 percent each (). Stainforthia fusiformis is also somewhat frequent, reaching up to ca. 7 percent (). Stainforthia loeblichi constitutes between 0 and 2 percent in Zone 1 and throughout the record it fluctuates between 0 and 2 percent ().
Figure 5. Stratigraphically constrained cluster analysis including all samples.
Foraminiferal assemblage Zone 2 covers 1958 to 1970. Zone 2 is still dominated by C. reniforme, which has strongly increased to 49 percent on average (). E. clavatum has also increased, reaching up to 14 percent. Zone 2 also differs from Zone 1 by decreased abundances of Q. agglutinans and S. biformis, decreasing to ca. 2 and 3 percent (). Additionally, Haplophragmoides fragile, Cribrostomoides kosterensis, and Textularia earlandi appear at single levels within Zone 2, reaching up to 7 and 3 percent ().
Foraminiferal assemblage Zone 3 covers a short period, 1970 to 1973, and is defined by a sudden dominance by Stainforthia concava with 37 percent (). C. reniforme is reduced to less than 20 percent. E. clavatum does not change and constitutes ca. 12 percent. The most frequent agglutinated species, L. crassimargo, Q. agglutinans, and S. biformis, show minor changes in frequency compared to zone 2 (). The frequency of Cibicides lobatulus fluctuates throughout the current record between 0 and 2 percent. In Zone 3 it appears at almost 2 percent ().
Foraminiferal assemblage Zone 4 occurring from 1973 to 1986 is characterized by a decreased abundance of C. reniforme. This decrease results in both C. reniforme and E. clavatum representing ca. 25 percent of the relative abundance (). It also causes the most frequent agglutinated species L. crassimargo, Q. agglutinans, and S. biformis to occur with higher relative frequencies reaching 15, 10, and 16 percent. H. fragile increases, reaching 3 percent (). Nonionoides turgidus constituted 6 percent in 1983 and Melonis barleanus consituted 3 percent in 1985, whereas C. lobatulus and Bucella frigida constituted up to 2 and 1 percent, respectively ().
C. reniforme increased strongly after 1986 up to 52 percent, defining foraminiferal assemblage Zone 5, which ranges from 1986 to 2002. The relative abundance of E. clavatum decreased to less than 25 percent (). The relative abundance of S. concava was relatively stable around 5 percent. L. crassimargo and H. fragile were markedly reduced in Zone 5, whereas Q. agglutinans and S. biformis decreased less and more gradually (). However, Adercotryma glomeratum increased from 1 to 4 percent within Zone 5. Islandiella helenae and Bolivinella pseudopunctata both were reduced in Zone 5. Yet, other calcareous species, Elphidium albiumbilicatum, Haynesina germinica, and Pullenia osloensis, which hitherto only constituted a very minor part of the fauna assemblages, increased and occurred consistently, with 1 to 2 percent throughout Zone 5 ().
Foraminiferal assemblage Zone 6 ranges from 2002 to 2007 (). It is characterized by an increase of E. clavatum up to ca. 30 percent (). C. reniforme is still frequent, with an average value of 22 percent. L. crassimargo increases in cluster 6 from 1 to 7 percent (). I. norcrossi and S. concava do not change compared to Zone 5; however, Nonionellina labradorica increased, reaching a maximum value of 11 percent in the current record. This also applies to A. glomeratum and Nonionella auricula, which reached maximum values of 9 and 5 percent, respectively ().
Figure 6. (a) Relative abundance (black line, upper x-axis) and flux (gray area, lower x-axis) of main calcareous species. The upper panel show species that constitutes a minimum of 2 percent of the fauna assemblage in at least two samples. The lower panel show species that constitutes a minimum of 1 percent of the fauna assemblage in at least two samples. The shaded areas show the fauna assemblage zones identified by cluster analysis. (b) Relative abundance (black line, upper x-axis) and flux (gray area, lower x-axis) of main agglutinated species that constitutes a minimum of 1 percent of the fauna assemblage in at least two samples. The shaded areas show the fauna assemblage zones identified by cluster analysis.
The stable isotope analysis shows an average δ13C value of −1.3 per mill. In the oldest part of the record values fluctuate between −1.6 and −1.0 per mill, yet after 1975, δ13C values generally remained higher than −1.3 per mill, reaching up −1.1 per mill (). The average δ18O values is 4.3 per mill, and prior to 1963 values were generally lower, decreasing to 4.1 per mill. From 1963 to 2001 δ18O values are higher than average, reaching 4.5 per mill. However, after 2001 the values decreased and remained lower than average ().
Figure 7. Stable isotope analysis (δ13C, δ18O) of NP16-Kro1-MC A. The shaded areas show the fauna assemblage zones identified by cluster analysis.
Discussion
From 1956 to 1958 (Zone 1) the results show a glaciomarine environment. The zone is dominated by C. reniforme (), which is an arctic species (Sejrup and Guiltbault Citation1980; Steinsund Citation1994) often found in glacial fjords (e.g., Korsun et al. Citation1995; Hald and Korsun Citation1997; Włodarska-Kowalczuk, Pawłowska, and Zajączkowski Citation2013; Jernas et al. Citation2018). E. clavatum and C. reniforme have been found to co-dominate the glacier-proximal fauna assemblages, whereas N. labradorica and I. norcrossi appear and become more frequent in glacier-distal settings (e.g., Korsun Citation2000; Forwick et al. Citation2010). L. crassimargo is also abundant in arctic fjords and seems to prefer a more stable marine environment that is not influenced by fluctuating meltwater inputs (Madsen and Knudsen Citation1994). I. norcrossi is relatively frequent in this time period, indicating that the water masses are nutrient rich, which may occur in a marginal ice zone with high biological productivity (e.g., Steinsund Citation1994; Polyak et al. Citation2002; Cage et al. Citation2021). This is in accordance with the diatom record, which shows an increased presence of sea ice in the beginning of this zone (Guruvayoorappan et al. Citation2020). I. norcrossi has also been associated with cold marine water masses, chilled AW, on the north Iceland shelf (Rytter et al. Citation2002; Jennings et al. Citation2004). Yet, the frequency of S. biformis could indicate relatively low-salinity water masses (Lloyd Citation2006).
During the period 1958 to 1970 (Zone 2) C. reniforme becomes very dominant, which could suggest a reduced influence by meltwater and less turbid water masses (). This is also an interval in which some of the highest values of dominance are observed (). C. reniforme does not tolerate turbidity and meltwater very well and is often found distal to glacier fronts (e.g., Hald and Korsun Citation1997; Korsun and Hald Citation1998; Forwick et al. Citation2010). Previous observations of living (stained) foraminifera show that as the distance to the glacier front increases, E. clavatum is the first calcareous species to appear and C. reniforme is the second, appearing further away from the glacier as the influence of turbidity and meltwater decrease further away from the glacier front (e.g., Hald and Korsun Citation1997; Forwick et al. Citation2010). Surface water masses at the core site are dominated by arctic water diatoms (Guruvayoorappan et al. Citation2020).
A short period stands out from 1970 to 1973 (Zone 3) with a very high abundance of S. concava (). Stainforthia species have been found to be opportunistic and able to utilize of pulses of high seasonal productivity (Alve Citation1995; Gustafsson and Nordberg Citation2001). Hence, we speculate that there has been a very brief period/pulse of increased high seasonal productivity causing S. concava to peak at this time. Increased productivity is also indicated by a peak of benthic foraminiferal flux and a depletion in benthic δ13C (). Further, Guruvayoorappan et al. (Citation2020) observed a peak of percentage of marginal ice zone (%MIZ) diatoms, indicating increased productivity and increased sea ice presence during this time interval (). This suggests that the core site experienced a brief period of increased marginal ice zone conditions as the sea ice increased and moved across the core site for a brief period. The change concurs with an advance of sea ice extent in the Greenland and Barents Seas surrounding Svalbard from the 1950s to the 1970s (Isaksson et al. Citation2005).
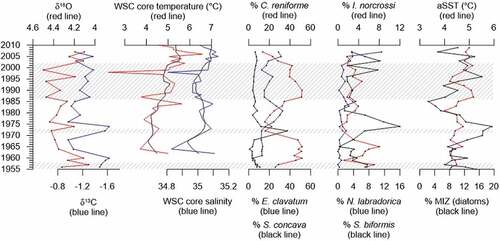
Figure 8. (a) Stable isotopes (δ13C, δ18O) from NP16-Kro1-MC A. (b) Temperature and salinity in the core of West Spitsbergen Current measured during late summer (Norwegian Polar Institute Citation2022a, Citation2022b). (c), (d) Selected benthic foraminiferal species (%) from NP16-Kro1-MC A. (e) Reconstructed SST (August) and MIZ diatoms (%) from Guruvayoorappan et al. (Citation2020). The shaded areas show the fauna assemblage zones identified by cluster analysis.
S. concava decreased and a new period was identified from 1973 to 1986 (Zone 4). C. reniforme also decreased, and E. clavatum became the dominant species (). This was probably due to increased turbidity (e.g., Hald and Korsun Citation1997; Korsun and Hald Citation1998). S. biformis increased after 1973, which could indicate relatively low-salinity water masses (Lloyd Citation2006). The foraminiferal flux was at its lowest values in this zone and the number of agglutinated forms reached their maximum abundance (). This could indicate that calcareous forms were poorly preserved, yet the foraminiferal tests show no signs of dissolution in this zone or in in other parts of the record. The diatom record is relatively stable, showing a dominance of arctic water diatoms (Guruvayoorappan et al. Citation2020).
From 1986 to 2002 (Zone 5) C. reniforme becomes very dominant again, showing an environment with less turbidity in the water column (). A. glomeratum also increased during this period (), indicating water masses with relatively high salinity (Jernas et al. Citation2018), which are also favored by C. reniforme (e.g., Hald and Korsun Citation1997). N. labradorica, I. helenae, and M. barleanus increased, indicating that more nutrients were possibly available on the sea floor (e.g., Jennings et al. Citation2004). This appear to be somewhat in accordance with the diatom record, which shows an increasing %MIZ diatoms from 1985 to 1995 (Guruvayoorappan et al. Citation2020).
The youngest zone of the record (Zone 6), from 2002 to 2007, most likely reflects an environment with increased turbidity, because E. clavatum becomes most abundant species again (). The abundances of I. norcrossi and N. labradorica are overall relatively low in this zone and thus they do not seem to indicate more ice-distal environments (e.g., Hald and Korsun Citation1997; Forwick et al. Citation2010). However, N. labradorica reached peak values in 2007, pointing to increased influence of nutrient-rich water masses (e.g., Hald and Korsun Citation1997; Jernas et al. Citation2018). The relative abundance of MIZ diatoms did not increase at this time (). This increase of N. labradorica was also observed in Kongsfjorden, because N. labradorica became very frequent from 2006 to 2008 (Jernas et al. Citation2018). Annual oceanographic monitoring in Kongsfjorden showed that 2006 to 2007 displayed the warmest and higher saline water masses in Kongsfjorden for the time period 1994 to 2014 (Tverberg et al. Citation2019). Hence, this increase of N. labradorica seems to indicate more nutrient-rich conditions and probably a greater AW influence in both Kongsfjorden and the current study site in Krossfjorden.
Stable isotope analysis shows that δ18O values in this record are relatively stable, except for two intervals, 1956 to 1963 and 2001 to 2007 (), showing lower values indicating warmer and/or less saline water masses probably caused by meltwater. Oceanographic monitoring has shown increased temperature and salinity of the core of the WSC transporting AW northwards (Norwegian Polar Institute Citation2022a, Citation2022b) since 1962 (). When comparing these records, it seems that the lighter δ18O values observed after 2000 may be caused by higher bottom water temperatures ().
The benthic foraminiferal faunal assemblages indicate that bottom water temperatures remained relatively stable in the period 1956 to 2007. Yet, the benthic foraminiferal faunal assemblages varied due to meltwater-driven changes of salinity and turbidity. The changes of the benthic foraminiferal faunal assemblage indicate periods of increased turbidity and possibly more glacier-proximal conditions in 1973 to 1986 (Zone 4) and possibly after 2002 (Zone 6). More glacier-proximal conditions could also be caused by increased iceberg production and meltwater associated with this. The glacier front of Lilliehöökbreen has been mapped using cartographic data prior to 2001 (König, Kohler, and Nuth Citation2013) and satellite data from 2001 and onwards (König, Kohler, and Nuth Citation2013; Moholdt et al. Citation2021). The data show that the glacier front generally retreated approximately 2 km from the first observations in 1966 to 2016 (sampling year), and no re-advances or stillstands have been observed for the periods where the benthic foraminifera indicate more turbidity (). There are no records of whether the retreat of the glacier front was an overall process or was associated with time periods of increased calving of icebergs and pulses of meltwater. The homogenous down-core lithology does not suggest any episodic depositional events. The benthic foraminiferal fauna does not reflect an overall increased distance to/overall retreat of the glacier front. During the melt season (spring to autumn), meltwater is discharged from the glaciers regardless of glacier movements (e.g., Lydersen et al. Citation2014), and the fluctuations of turbidity observed in this study are not connected to glacier re-advances. Any major influences of meltwater also seem negligible because the δ18O data are relatively stable (). Yet, δ18O data may seem to reflect slightly warmer bottom water temperatures from 2001 to 2007 (). This difference between signals could be because calcification may represent a specific season as observed by Skirbekk et al. (Citation2016), and the arctic/glaciomarine benthic foraminiferal fauna assemblages reflect an annual average signal.
Guruvayoorappan et al. (Citation2020) identified the abundance of MIZ diatoms and reconstructed SSTs at the core site. There is no one-to-one correlation between the current proxy record of bottom water conditions and the proxy record by Guruvayoorappan et al. (Citation2020) on surface water conditions (), suggesting a stratified water column. Yet, benthic foraminiferal faunal Zone 3 possibly indicates that a short period/pulse of increased high seasonal productivity occurred from 1970 to 1973, which is within the period of maximum frequency of MIZ diatoms from 1968 to 1976 (Guruvayoorappan et al. Citation2020). This could suggest a period of less stratification, allowing movement of nutrients to or from surface to bottom water masses. Guruvayoorappan et al. (Citation2020) found a clear warming trend of the surface waters by 0.6°C and overall decrease of MIZ diatoms; that is, less seasonal sea ice presence in the period 1953 to 2014. After 2000, the benthic δ18O values seem to indicate higher bottom water temperatures, which correlates with the overall trends of warming of SSTs and decrease of sea ice observed by Guruvayoorappan et al. (Citation2020), suggesting decreased stratification and/or different processes increasing the water temperatures. In their study, Guruvayoorappan et al. (Citation2020) found a dominance of arctic diatom species and suggested that the observed warming is due to greenhouse gas forcing and ocean–atmosphere interactions rather than Atlantification. The instrumental oceanographic record shows that the core temperature of the WSC increases concurrently with the current benthic δ18O values after 2000 (), which could suggest that Atlantification may be causing bottom water temperatures to increase. Yet the benthic foraminiferal fauna assemblages representing bottom water conditions are still dominated by arctic/glaciomarine species.
The benthic foraminiferal species (e.g., I. helenae and N. labradorica) indicating nutrient-rich water masses are not very abundant (). I. helenae, a species associated with marginal ice zones (e.g., Seidenkrantz Citation2013), does not correlate with MIZ diatoms from Guruvayoorappan et al. (Citation2020). This is probably due to the location of the study site, which is too glacier proximal for I. helenae to thrive. This also seems to be the case for N. labradorica, which has been found to dominate modern benthic foraminiferal fauna assemblages in outer part of Kongsfjorden for the last ca. 2,000 years (Jernas et al. Citation2013, Citation2018). N. labradorica reaches its highest frequency in the youngest sample, and we speculate that this is a start toward a less glacially dominated environment with warmer bottom water masses and less sea ice, where the benthic foraminiferal fauna assemblages and the environment in the inner part of Krossfjorden will experience conditions more like those of outer Kongsfjorden.
Conclusions
Six benthic foraminiferal fauna assemblages have been identified in the time period 1955 to 2007 in inner Krossfjorden reflecting fluctuations of turbidity and meltwater. The glaciomarine fauna assemblage is dominated by C. reniforme and E. clavatum together with L. crassimargo. An exception is the short period from 1970 to 1973 during which S. concava dominates, reflecting a period or pulse of increased high seasonal productivity, also indicated by a depletion of the benthic δ13C values. The inner part of Krossfjorden in this period is influenced by a marginal ice zone as shown by diatoms (Guruvayoorappan et al. Citation2020). During the periods 1973 to 1986 (Zone 4) and 2002 to 2007 (Zone 6), E. clavatum dominates, probably reflecting increased turbidity in the water column. The salinity may also be reduced because S. biformis is at its highest frequencies during these times as well. The glacier front of Lilliehöökbreen retreated 2 km away from the core site from 1966 to 2016, and there have not been any glacier advances, so periods of increased turbidity are not linked to specific glacier advances. However, meltwater is continuously discharged from the glacier and both the volume of meltwater and amount of sediments entrained in the meltwater may vary. Species like I. norcrossi, N. labradorica, I. helenae, and M. barleanus occur during the whole investigated time interval, but their abundances are generally low due to the relative glacier-proximal position of the study site. The δ18O record is relatively stable except for two intervals, 1956 to 1963 and 2001 to 2007, where the latter interval seems to be caused by warmer water masses.
Acknowledgments
We thank participants and crew on the Kongsfjorden cruise with RV Lance in 2016 for assisting in sediment coring.
Disclosure statement
No potential conflict of interest was reported by the authors.
Additional information
Funding
References
- Alve, E. 1995. Benthic foraminiferal distribution and recolonization of formerly anoxic environments in Drammensfjord, southern Norway. Marine Micropaleontology 25 (2–3):169–694. doi:10.1016/0377-8398(95)00007-N.
- Bronk Ramsey, C. 2009. Bayesian analysis of radiocarbon dates. Radiocarbon 51 (1):337–60. doi:10.1017/S0033822200033865.
- Buzas, M. A., and T. G. Gibson. 1969. Species diversity: Benthonic foraminifera in Western North Atlantic. Science 163 (3862):72–75. doi:10.1126/science.163.3862.72.
- Cage, A. G., A. J. Pieńkowski, A. Jennings, K. L. Knudsen, and M. S. Seidenkrantz. 2021. Comparative analysis of six common foraminiferal species of the genera Cassidulina, Paracassidulina, and Islandiella from the Arctic–North Atlantic domain. Journal of Micropalaeontology 40 (1):37–60. doi:10.5194/jm-40-37-2021.
- Cottier, F. R., F. Nilsen, M. E. Inall, S. Gerland, V. Tverberg, and H. Svendsen. 2007. Wintertime warming of an Arctic shelf in response to large-scale atmospheric circulation. Geophysical Research Letters 34 (10):1–5. doi:10.1029/2007GL029948.
- Cottier, F. R., F. Nilsen, R. Skogseth, V. Tverberg, J. Skarðhamar, and H. Svendsen. 2010. Arctic fjords: A review of the oceanographic environment and dominant physical processes. Geological Society, London, Special Publications 344, 35–50.
- Darling, K. F., M. Schweizer, K. L. Knudsen, K. M. Evans, C. Bird, A. Roberts, H. L. Filipsson, J.-H. Kim, G. Gudmundsson, C. M. Wade, et al. 2016. The genetic diversity, phylogeography and morphology of Elphidiidae (Foraminifera) in the Northeast Atlantic. Marine Micropaleontology 129:1–23. doi:10.1016/j.marmicro.2016.09.001.
- Ehrmann, W. U., and J. Thiede. 1985. History of Mesozoic and Cenozoic sediment fluxes to the North Atlantic Ocean. Contributions to Sedimentology 15:1–109.
- Ellis, B. E., and A. R. Messina. 1940–present. Catalogue of Foraminifera. New York: American Museum of Natural History.
- Forwick, M., T. O. Vorren, M. Hald, S. Korsun, Y. Roh, C. Vogt, and K.-C. Yoo. 2010. Spatial and temporal influence of glaciers and rivers on the sedimentary environment in Sassenfjorden and Tempelfjorden, Spitsbergen. Geological Society, London, Special Publications 344 (1):163–93. doi:10.1144/SP344.13.
- Guruvayoorappan, H., A. Miettinen, D. V. Divine, M. Moros, L. C. Orme, and R. J. Mohan. 2020. Ocean surface warming in Krossfjorden, Svalbard, during the last 60 years. Arktos 2 (1–3):1–13. doi:10.1007/s41063-019-00071-x.
- Gustafsson, M., and K. Nordberg. 2001. Living (stained) benthic foraminiferal response to primary production and hydrography in the deepest part of the Gullmar Fjord, Swedish West Coast, with comparisons to Hoglund’s 1927 material. Journal of Foraminiferal Research 31 (1):2–11. doi:10.2113/0310002.
- Hald, M., and S. Korsun. 1997. Distribution of modern benthic foraminifera from fjords of Svalbard, European Arctic. The Journal of Foraminiferal Research 27 (2):101–22. doi:10.2113/gsjfr.27.2.101.
- Hammer, Ø., D. A. T. Harper, and P. D. Ryan. 2001. PAST: Paleontological statistics software package for education and data analysis. Paleontologica Electronica 4:1–9.
- Hanssen-Bauer, I., E. J. Førland, H. Hisdal, S. Mayer, S. Sandø, and S. Sorteberg. 2019. Climate in Svalbard 2100 – A knowledge base for climate adaptation. NCCS report. Norwegian Centre for Climate Services, 1–105.
- Hop, H., and C. Wiencke. 2019. The ecosystem of Kongsfjorden, Svalbard. In The ecosystem of Kongsfjorden, Svalbard, ed. H. Hop and C. Wiencke, 1–20. Cham: Springer International Publishing.
- Husum, K., and A. Wold. 2016. Kongsfjorden - Rijpfjorden cruise report (MOSJ-ICE). 1–85.
- Ingvaldsen, R. B., K. M. Assmann, R. Primicerio, M. Fossheim, I. V. Polyakov, and A. V. Dolgov. 2021. Physical manifestations and ecological implications of Arctic Atlantification. Nature Reviews Earth & Environment 2 (12):874–89. doi:10.1038/s43017-021-00228-x.
- Isaksson, E., D. Divine, J. Kohler, T. Martma, V. Pohjola, H. Motoyama, and O. Watanabe. 2005. Climate oscillations as recorded in Svalbard ice core ω18 O records between ad 1200 and 1997. Geografiska Annaler: Series A, Physical Geography 87 (1):203–14. doi:10.1111/j.0435-3676.2005.00253.x.
- Jennings, A. E., N. J. Weiner, G. Helgadottir, and J. T. Andrews. 2004. Modern foraminiferal faunas of the southwestern to northern Iceland shelf: Oceanographic and environmental controls. Journal of Foraminiferal Research 34 (3):180–207. doi:10.2113/34.3.180.
- Jernas, P., D. Klitgaard-Kristensen, K. Husum, N. Koc, V. Tverberg, P. Loubere, M. Prins, N. Dijkstra, and M. Gluchowska. 2018. Annual changes in Arctic fjord environment and modern benthic foraminiferal fauna: Evidence from Kongsfjorden, Svalbard. Global and Planetary Change 163:119–40. doi:10.1016/j.gloplacha.2017.11.013.
- Jernas, P., D. Klitgaard Kristensen, K. Husum, L. Wilson, and N. Koç. 2013. Palaeoenvironmental changes of the last two millennia on the western and northern Svalbard shelf. Boreas 42 (1):236–55. doi:10.1111/j.1502-3885.2012.00293.x.
- Johansson, A. M., E. Malnes, S. Gerland, A. Cristea, A. P. Doulgeris, D. V. Divine, O. Pavlova, and T. R. Lauknes. 2020. Consistent ice and open water classification combining historical synthetic aperture radar satellite images from ERS-1/2, Envisat ASAR, RADARSAT-2 and Sentinel-1A/B. Annals of Glaciology 61 (82):40–50. doi:10.1017/aog.2019.52.
- Keck, A., J. Wiktor, R. Hapter, and R. Nilsen. 1999. Phytoplankton assemblages related to physical gradients in an Arctic, glacier-fed fjord in summer. ICES Journal of Marine Science 56:203–14. doi:10.1006/jmsc.1999.0631.
- Knudsen, K. L., W. E. N. Austin. 1996. Late glacial foraminifera. In Paleoceanography in the European Arctic Margin during the last deglaciation, ed. J. T. Andrews, W. E. N. Austin, H. Bergsten, and A. E. Jennings, 7–11. London: Geological Society Special Publication.
- König, M., J. Kohler, and C. Nuth. 2013. Glacier area outlines - Svalbard [Data set]. Norwegian Polar Institute. doi:10.21334/npolar.2013.89f430f8.
- Korsun, S. 2000. Seasonal dynamics of benthic foraminifera in a glacially fed fjord of Svalbard, European Arctic. The Journal of Foraminiferal Research 30 (4):251–71. doi:10.2113/0300251.
- Korsun, S., and M. Hald. 1998. Modern benthic foraminifera off Novaya Zemlya tidewater glaciers, Russian Arctic. Arctic and Alpine Research 30 (1):61–77. doi:10.2307/1551746.
- Korsun, S., I. A. Pogodina, S. L. Forman, and D. Lubinski. 1995. Recent foraminifera in glaciomarine sediments from three Arctic fjords of Novaja Zemlja and Svalbard. Polar Research 14 (1):15–31. doi:10.3402/polar.v14i1.6648.
- Lloyd, J. J. 2006. Late Holocene environmental change in Disko Bugt, west Greenland: Interaction between climate, ocean circulation and Jakobshavn Isbrae. Boreas 35 (1):35–49. doi:10.1080/03009480500359061.
- Loeblich, A. R., and H. Tappan. 1987. Foraminiferal genera and their classification, 1–970. New York: Van Nostrand Reinhold Co.
- Luckman, A., D. I. Benn, F. Cottier, S. Bevan, F. Nilsen, and M. Inall. 2015. Calving rates at tidewater glaciers vary strongly with ocean temperature. Nature Communications 6 (1):1–7. doi:10.1038/ncomms9566.
- Lydersen, C., P. Assmy, S. Falk-Petersen, J. Kohler, K. M. Kovacs, M. Reigstad, H. Steen, H. Strom, A. Sundfjord, O. Varpe, et al. 2014. The importance of tidewater glaciers for marine mammals and seabirds in Svalbard, Norway. Journal of Marine Systems 129:452–71. doi:10.1016/j.jmarsys.2013.09.006.
- MacLachlan, S. E., J. A. Howe, and M. E. Vardy. 2010. Morphodynamic evolution of Kongsfjorden-Krossfjorden, Svalbard, during the Late Weichselian and Holocene. Geological Society, London, Special Publications 344, 195–205.
- Madsen, H. B., and K. L. Knudsen. 1994. Recent foraminifera in shelf sediments of the Scoresby Sund fjord, East Greenland. Boreas 23 (4):495–504. doi:10.1111/j.1502-3885.1994.tb00617.x.
- Moholdt, G., J. Maton, M. Majerska, and J. Kohler. 2021. Annual frontlines of marine-terminating glaciers on Svalbard [Data set]. Tromso, Norway: Norwegian Polar Institute. https://doi.org/10.21334/npolar.2021.d60a919a.
- Murray, J. 2006. Ecology and applications of benthic foraminifera, 1–425. Cambridge: Cambridge University Press.
- Nilsen, F., R. Skogseth, J. Vaardal-Lunde, and M. Inall. 2016. A simple shelf circulation model: Intrusion of Atlantic Water on the West Spitsbergen Shelf. Journal of Physical Oceanography 46 (4):1209–30. doi:10.1175/JPO-D-15-0058.1.
- Norwegian Polar Institute. 2022a. Annual maximum temperature in the West Spitsbergen Current. Environmental monitoring of Svalbard and Jan Mayen (MOSJ). http://www.mosj.no/en/climate/ocean/temperature-salinity-fram-strait.html.
- Norwegian Polar Institute. 2022b. Salinity in the core of the West-Spitsbergen current. Environmental monitoring of Svalbard and Jan Mayen (MOSJ). http://www.mosj.no/en/climate/ocean/temperature-salinity-fram-strait.html.
- Pavlov, A. K., V. Tverberg, B. V. Ivanov, F. Nilsen, S. Falk-Petersen, and M. A. Granskog. 2013. Warming of Atlantic Water in two west Spitsbergen fjords over the last century (1912-2009). Polar Research 32 (1):1–14. doi:10.3402/polar.v32i0.11206.
- Pavlova, O., S. Gerland, H. Hop. 2019. changes in sea-ice extent and thickness in Kongsfjorden, Svalbard (2003–2016). in The ecosystem of Kongsfjorden, Svalbard, ed. H. Hop and C. Wiencke, 105–36. Cham: Springer International Publishing.
- Piquet, A. M. T., W. H. van de Poll, R. J. W. Visser, C. Wiencke, H. Bolhuis, and A. G. J. Buma. 2014. Springtime phytoplankton dynamics in Arctic Krossfjorden and Kongsfjorden (Spitsbergen) as a function of glacier proximity. Biogeosciences 11 (8):2263–79. doi:10.5194/bg-11-2263-2014.
- Polyak, L., S. Korsun, L. Febo, V. Stanovoy, T. Khusid, M. Hald, B. E. Paulsen, and D. Lubinski. 2002. Benthic foraminiferal asssemblages from the southern Kara Sea, a river-influenced Arctic marine environment. Journal of Foraminiferal Research 32 (3):252–73. doi:10.2113/32.3.252.
- Rasmussen, T. L., E. Thomsen, K. Skirbekk, M. Ślubowska-Woldengen, D. Klitgaard Kristensen, and N. Koç. 2014. Spatial and temporal distribution of Holocene temperature maxima in the northern Nordic seas: Interplay of Atlantic-, Arctic- and polar water masses. Quaternary Science Reviews 92:280–91. doi:10.1016/j.quascirev.2013.10.034.
- Rytter, F., K. L. Knudsen, M. S. Seidenkrantz, and J. Eiriksson. 2002. Modern distribution of benthic foraminifera on the north Icelandic shelf and slope. Journal of Foraminiferal Research 32 (3):217–44. doi:10.2113/32.3.217.
- Schild, K. M., C. E. Renshaw, D. I. Benn, A. Luckman, R. L. Hawley, P. How, L. Trusel, F. R. Cottier, A. Pramanik, and N. R. J. Hulton. 2018. Glacier calving rates due to subglacial discharge, fjord circulation, and free convection. Journal of Geophysical Research: Earth Surface 123 (9):2189–204. doi:10.1029/2017JF004520.
- Schönfeld, J., E. Alve, E. Geslin, F. Jorissen, S. Korsun, S. Spezzaferri, and F. G. Members. 2012. The FOBIMO (FOraminiferal BIo-MOnitoring) initiative - towards a standardised protocol for soft-bottom benthic foraminiferal monitoring studies. Marine Micropaleontology 94–95:1–13. doi:10.1016/j.marmicro.2012.06.001.
- Seidenkrantz, M.-S. 2013. Benthic foraminifera as palaeo sea-ice indicators in the subarctic realm – Examples from the Labrador Sea–Baffin Bay region. Quaternary Science Reviews 79:135–44. doi:10.1016/j.quascirev.2013.03.014.
- Sejrup, H. P., and J. P. Guiltbault. 1980. Cassidulina reniforme and C. obtusa (Foraminifera), taxonomy, distribution, and ecology. Sarsia 65 (2):70–85. doi:10.1080/00364827.1980.10431476.
- Simpson, E. H. 1949. Measurement of diversity. Nature 163 (4148):688. doi:10.1038/163688a0.
- Skirbekk, K., M. Hald, T. M. Marchitto, J. Junttila, D. K. Kristensen, and S. Aagaard-Sørensen. 2016. Benthic foraminiferal growth seasons implied from Mg/Ca-temperature correlations for three Arctic species. Geochemistry Geophysics Geosystems 17:4684–704.
- Skirbekk, K., D. Klitgaard Kristensen, T. L. Rasmussen, N. Koc, and M. Forwick. 2010. Holocene climate variations at the entrance to a warm Arctic fjord: Evidence from Kongsfjorden trough, Svalbard. In Fjord systems and archives, ed. J. A. Howe, W. E. N. Austin, M. Forwick, and M. Paetzel, 289–304. London: Geological Society.
- Steinsund, P. I. 1994. Benthic foraminifera in the surface sediments of the Barents and Kara Seas: Modern and late Quaternary applications, 1–111. Tromsø, Norway: Department of Geology, University of Tromsø.
- Sundfjord, A., J. Albretsen, Y. Kasajima, R. Skogseth, J. Kohler, C. Nuth, J. Skarðhamar, F. Cottier, F. Nilsen, L. Asplin, et al. 2017. Effects of glacier runoff and wind on surface layer dynamics and Atlantic Water exchange in Kongsfjorden, Svalbard; a model study. Estuarine, Coastal and Shelf Science 187:260–72. doi:10.1016/j.ecss.2017.01.015.
- Svendsen, H., A. Beszczynska-Moller, J. O. Hagen, B. Lefauconnier, V. Tverberg, S. Gerland, J. B. Orbaek, K. Bischof, C. Papucci, M. Zajaczkowski, et al. 2002. The physical environment of Kongsfjorden-Krossfjorden, an Arctic fjord system in Svalbard. Polar Research 21:133–66.
- Tverberg, V., R. Skogseth, F. Cottier, A. Sundfjord, W. Walczowski, M. E. Inall, E. Falck, O. Pavlova, and F. Nilsen. 2019. The Kongsfjorden transect: Seasonal and inter-annual variability in hydrography. In The ecosystem of Kongsfjorden, Svalbard, ed. H. Hop and C. Wiencke, 49–104. Cham: Springer International Publishing.
- Włodarska-Kowalczuk, M., J. Pawłowska, and M. Zajączkowski. 2013. Do foraminifera mirror diversity and distribution patterns of macrobenthic fauna in an Arctic glacial fjord? Marine Micropaleontology 103:30–39. doi:10.1016/j.marmicro.2013.07.002.
- Włodarska-Kowalczuk, M., T. H. Pearson, and M. A. Kendall. 2005. Benthic response to chronic natural physical disturbance by glacial sedimentation in an Arctic Fjord. Marine Ecology Progress Series 303:31–41. doi:10.3354/meps303031.