
ABSTRACT
Warming across the low Arctic is increasing tundra vegetation productivity and facilitating the expansion of upright shrubs. We modeled the effects of warming on habitat suitability in green alder, dwarf birch, Labrador tea, bog bilberry, and lingonberry and assessed the influence of data type (true absence or pseudo-absence) on species distribution models (SDMs). We generated SDMs using the two absence data types under current (1970–2000) and future (2061–2080) climate projections. Our results show that warming leads to range expansion of all shrubs, though responses vary in magnitude and extent, with mean increases in suitability ranging from 0.080 (Labrador tea) to 0.369 (lingonberry) with true absences. Differences in driving variables and suitability projections suggest that physiological and ecological variability between species mediate responses to warming. Between data types, we observed inconsistencies in model performance, suitability projections, and variable importance. Bog bilberry and lingonberry exhibited larger differences in suitability (0.201 and 0.288, respectively), whereas alder showed similar responses (difference of 0.01). These results are important to consider when assessing changes in habitat suitability or identifying environmental or climatic determinants of species’ distributions. We suggest further development of open data repositories, facilitating access to true absence data to support conservation and land use planning.
Introduction
Warming air temperatures and altered precipitation at high latitudes are driving shifts in tundra vegetation, increases in the frequency of the disturbance associated with permafrost thaw, and changes in the extent of surface water (Kokelj et al. Citation2015; Vincent et al. Citation2015; Intergovernmental Panel on Climate Change Citation2019; Travers-Smith, Lantz, and Fraser Citation2021). Field-based and remote sensing research shows that increases in the productivity of tundra vegetation have been caused primarily by the proliferation of tundra shrubs (Lantz, Marsh, and Kokelj Citation2013; A. Chen et al. Citation2021; Seider et al. Citation2022). Increased growth and reproduction in response to natural and experimental warming has also been observed in alder and birch (Tape, Sturm, and Racine Citation2006; Walker et al. Citation2006; Ropars and Boudreau Citation2012; Moffat et al. Citation2016; Bjorkman et al. Citation2020; Travers‐Smith and Lantz Citation2020; Mekonnen, Riley, Berner et al. Citation2021), but additional research is required to explore the climate sensitivity of other common tundra shrubs.
Documenting variation in the responses of different shrub species to climate change is important because vegetation structure has a significant impact on carbon cycling, permafrost dynamics (McGuire et al. Citation2006), and the climate system (Bonan et al. Citation2003; Port, Brovkin, and Claussen Citation2012). As such, understanding the influence of shrubs and vegetation change on these processes is important for existing global climate models. Accurate projections of changes in shrub abundance are also important because shrubs are expected to significantly impact wildlife habitat (Joly et al. Citation2007; Ehlers et al. Citation2021) and subsistence hunting in northern communities (Wildlife Management Advisory Council, North Slope & Aklavik Hunters and Trappers Committee Citation2018).
Species distribution modeling is a common technique used to quantify the influence of climate and terrain factors on the ranges of terrestrial vegetation and to assess the impacts of climate warming on their future distributions (Guisan and Zimmermann Citation2000). Many species distribution models (SDMs) utilize presence-only data, which are widely available in open-access repositories such as the Global Biodiversity Information System (gbif.org). With the exception of profile techniques (e.g., BIOCLIM, DOMAIN, ecological niche factor analysis), models built using presence-only data rely on randomly selected pseudo-absence (or background) data to represent absence locations. These are used to provide information on the total variability in environmental predictors across a selected area (Phillips et al. Citation2009) and to represent locations where species are not present for logistic regression or other binary response methods that require absence data (Wisz and Guisan Citation2009).
In their review of 250 SDM studies, Santini et al. (Citation2021) found over 84 percent of SDMs used pseudo-absences or background data. However, a lack of best practices to determine pseudo-absence locations adds to the confusion and reduced interpretability of SDM studies using this approach (Barbet‐Massin et al. Citation2012; Santini et al. Citation2021). Previous studies have shown that the use of pseudo-absence data can negatively impact model performance and interpretation through sampling bias and poor data quality and spatial accuracy (Pearce and Boyce Citation2006). When pseudo-absence locations do not complement spatial coverage and sampling effort of presence observations, model predictions lose the ability to accurately portray distributions across the entire study domain (Phillips et al. Citation2009). On the contrary, standard performance metrics indicate that many studies using pseudo-absence data have also performed favorably (Barbet-Massin et al. Citation2018; Zhang et al. Citation2019; Kaky et al. Citation2020), which suggests the need for further investigation into overall performance of such data.
This study focusses on the Beaufort Delta region in the western Canadian Arctic, the area experiencing the most rapid temperature increases in Canada (Vincent et al. Citation2015). This warming is increasing the productivity of tundra landscapes (Tape, Sturm, and Racine Citation2006; Lantz, Marsh, and Kokelj Citation2013; Fraser et al. Citation2014; Campbell et al. Citation2021; Seider et al. Citation2022) and facilitating widespread shrub proliferation (Lantz, Marsh, and Kokelj Citation2013; Moffat et al. Citation2016; Travers‐Smith and Lantz Citation2020). In our analysis, we explore differences in the sensitivity of five common tundra shrub species to climate change by comparing projected changes in habitat suitability with climate warming. Specifically, we developed SDMs for green alder (Alnus viridis), dwarf birch (Betula glandulosa and B. nana), Labrador tea (Ledum decumbens), bog bilberry (Vaccinium uliginosum), and lingonberry (Vaccinium vitis-idaea) and applied a future high-emissions climate scenario projecting habitat suitability to the period between 2061 and 2080. With these models, we also investigate how data type (true absence or pseudo-absence) influences (1) SDM performance, (2) estimates of habitat suitability, and (3) projections of change in habitat suitability for the five shrub species. By exploring the use of different data types, we also seek to understand how differences in the data type may influence the application of SDMs, particularly with regards to regional vegetation distributions in a warming climate. These models were built under the assumption of a stationary relationship with respect to the environment. Our models are not mechanistic and do not account for seed dispersal or establishment, which could be important for potential future distributions of these species. Our investigation into how SDM parameterization potentially affects habitat suitability projections can provide insights on the use of this technique and its application in conservation and land use planning.
Methods
Study area
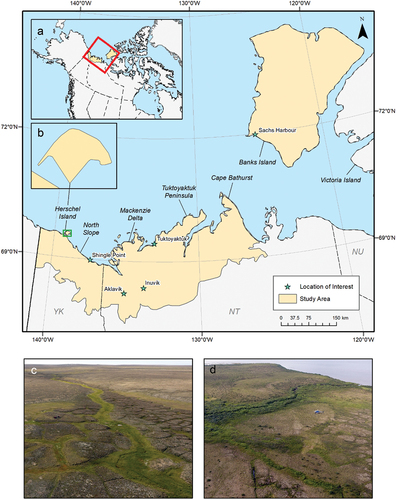
This study focuses on the Beaufort Delta region of northern Yukon and Northwest Territories, covering an area of approximately 161,000 km2 (). The southern portion of this area includes the Yukon and Tuktoyaktuk Coastal Plains and the Bathurst Peninsula ecoregions, which are characterized by rolling hills dominated by shrub and tussock tundra as well as low-lying wetland habitats (Yukon Ecoregions Working Group Citation2004; Ecosystem Classification Group Citation2012). The Yukon and Tuktoyaktuk Coastal Plain ecoregions are separated by the Mackenzie Delta ecoregion, which consists of low-lying alluvial terrain where a mosaic of forest, woodland, shrubland, and sedge wetland is strongly influenced by the hydrology of the delta (D. Gill Citation1972, Citation1973; C. Pearce Citation1986; Burn and Kokelj Citation2009). The northern part of the study area includes the Banks Island Coastal Plain and Banks Island Lowland ecoregions, a mid-Arctic landscape characterized by hummocky tills and glaciofluvial plains with some exposed bedrock throughout (Ecosystem Classification Group Citation2012). Vegetation communities on Banks Island are controlled primarily by soil moisture (Campbell et al. Citation2021) with well-drained upland terrain occupied by a mix of barrens and dwarf shrub tundra and wetter lowland terrain dominated by more productive sedge tundra (Ecosystem Classification Group Citation2012). All regions within the study area are underlain by continuous permafrost and exhibit common permafrost features such as polygonal terrain, hummocks, and thaw slumps (Rampton Citation1982, Citation1988; Yukon Ecoregions Working Group Citation2004; Ecosystem Classification Group Citation2012). With the exception of the Yukon Coastal Plain and of the northern tip of Tuktoyaktuk Peninsula, the study area was covered by the Laurentide Ice Sheet during the Wisconsinan Glaciation (Jessop Citation1971; Rampton Citation1988; Ecosystem Classification Group Citation2012).
Figure 1. Map of the study area in the Beaufort Delta region. (a) The extent of main map (red) in North America and (b) an enlargement of Herschel Island (the green rectangle on the main map). (c) A photograph of typical terrain and ground cover on Banks Island (photo by T. Lantz). (d) A photograph of typical terrain and ground cover on the Tuktoyaktuk Coastlands (photo by J. Seider).
Study design overview
To investigate the effect of climate warming on the distribution of tundra shrubs, we used SDMs to project habitat suitability for five common tundra shrubs (alder, birch, Labrador tea, bog bilberry, and lingonberry) under a high-emissions climate scenario for 2061 to 2080. To assess the influence of data type on ensemble SDM performance and predictions of habitat suitability, we created two models for each species: one using true absence data and one using pseudo-absence data. Because all other model parameters and environmental variables remain constant, we attribute differences in model performance and predictions of suitability to data type.
Species
We selected species for this analysis representing a variety shrub functional types and growth forms. Green alder (Alnus viridis, also known as A. crispa or, more recently, A. alnobetula) is a deciduous tall shrub. This shrub has a broad distribution across the Northern Hemisphere and is known to establish on newly exposed mineral soils after disturbance (Furlow Citation1979). Green alder is primarily a subarctic species (Furlow Citation1997), but several recent studies have documented increases in alder stand density and abundance across the low Arctic tundra of Alaska (Tape, Sturm, and Racine Citation2006), Northwest Territories (Travers‐Smith and Lantz Citation2020), Labrador (Larking et al. Citation2021), and Siberia (Frost and Epstein Citation2014). We used a species complex including Betula glandulosa and B. nana to describe dwarf birch, a deciduous dwarf shrub. These dwarf birches are both found on nutrient-poor, well-drained, moist acidic soils across the circumpolar range (De Groot, Thomas, and Wein Citation1997). They are taxonomically confused, particularly where their ranges overlap and hybridization makes species identification difficult (De Groot, Thomas, and Wein Citation1997). For this reason, we consider observations of both of these species to represent this deciduous shrub species complex. Marsh Labrador tea (Ledum decumbens, also known as L. palustre or, more recently, Rhododendrom tomentosum) is a low shrub with evergreen leaves. This species is commonly found in mesic dwarf shrub or lichen heaths across a largely circumpolar range (Scoggan Citation1979). Bog bilberry (Vaccinium uliginosum) is a deciduous shrub commonly found in nutrient-poor, moist-to-wet acidic soils with a circumpolar range (Jacquemart Citation1996). Finally, lingonberry (V. vitis-idaea) is an evergreen dwarf shrub common across the low Arctic and southern boreal forest on dry to moist soils (Taulavuori, Laine, and Taulavuori Citation2013). Throughout this article, we refer to each species by its common name.
Plot-level presence/absence data used to parameterize models were obtained from a number of sources. Vegetation data from the Northwest Territories were collected from surveys conducted between 2005 and 2019 (see Lantz et al. Citation2009; Lantz, Gergel, and Henry Citation2010; Gill et al. Citation2014; Steedman Citation2014; Cameron and Lantz Citation2016; Chen Citation2020; Travers‐Smith and Lantz Citation2020; Shipman Citation2021; Seider et al. Citation2022). Vegetation cover data from across northern Yukon were obtained, with permission, from the Yukon Biophysical Inventory System (Yukon Territorial Government Citation2021). These data were collected from field surveys conducted between 2000 and 2015. Data from southern Banks Island were obtained, with permission, from the Canadian Wildlife Service (see Campbell et al. Citation2021). To use these percentage cover data in our SDMs, we converted them to presence/absence for each species at each site (see Supplementary Figures S1 to S5 for the spatial distributions of presence/absence points for each species). The spatial accuracy of the plot locations for all of these data sources is much greater than the 30-arcsecond resolution of the environmental predictors. To minimize the possibility of pseudoreplication and to ensure that models were not trained using multiple observations within the same cell, we implemented a spatial thinning procedure to ensure that no two observations were closer than 5 km using the “ensemble.spatialThin” function from the BiodiversityR package (v2.12–3; Kindt and Coe Citation2005). We chose the thinning distance of 5 km as a conservative buffer because the spatial resolution of 30 arcseconds of predictor variables at the northernmost point of our study area is approximately 1 km. The prevalence of each species is listed in .
Table 1. Percent of all plots sampled with observed presence (prevalence) of modeled species from field survey data.
To use these data in presence-only models, we converted presence/absence data to presence-only data by removing any observations of true absences from the data. We then used a random pseudo-absence strategy selecting points with a minimum distance of 5 km from presence locations to generate pseudo-absence points using the “BIOMOD_FormatingData” function. This strategy implements a random selection of points from all possible cells of predictor data outside the predetermined buffer (see Fournier et al. Citation2017; Kaky et al. Citation2020), providing a sample of predictor variability that can be contrasted to the variability within presence locations (Phillips et al. Citation2009). The total number of pseudo-absence points in each selection equals the number of observed presence locations.
Climate predictor variables
Historic (1970–2000) climate data (30-arcsecond resolution) used to parameterize our models were obtained from the WorldClim v2.1 data set (Fick and Hijmans Citation2017). Climate parameters in this data set consist of nineteen ecologically relevant variables derived from average monthly temperature and precipitation values (Fick and Hijmans Citation2017). We performed a hierarchical cluster analysis following the method used by Fournier et al. (Citation2017) on these data and grouped the nineteen variables using the resulting correlation matrix. Variables were grouped if they had a Pearson’s r greater than 0.7. We then selected one variable from each group to best represent a diversity of climate factors relating to temperature and precipitation. Based on this clustering, we chose the following seven variables to represent climate across the study area: annual mean temperature, mean diurnal range, isothermality, temperature seasonality, mean temperature of the coldest quarter, precipitation seasonality, and precipitation of the warmest quarter ().
Table 2. Bioclimatic variables from WorldClim (Fick and Hijmans Citation2017) used in this analysis.
Species range projections utilized downscaled global climate model (GCM) data from the Coupled Model Intercomparison Project Phase 5 (CMIP5; Taylor, Stouffer, and Meehl Citation2012). To obtain these data, we followed methods described in Lee, Williams, and Pearson (Citation2019) and used a multimodel ensemble of four GCMs (CCSM4 from the National Center for Atmospheric Research, GFDL-CM3 from the Geophysical Fluid Dynamics Laboratory, HadGEM2-ES from the Met Office Hadley Center, and MPI-ESM-LR from the Max Planck Institute for Meteorology). We chose the Representative Concentration Pathway (RCP) 8.5 scenario developed for CMIP5 to base our models on the most severe estimates of future warming. This worst-case scenario presents a future defined by high carbon emissions with radiative forcing of 8.5 W/m2 by 2100 (Moss et al. Citation2010). These GCMs are available as downscaled data using WorldClim (v1.4) as the climate baseline and averaged from 2061 to 2080 to 30-arcsecond resolution (Hijmans et al. Citation2005). To create the ensemble climate projection, we took a simple average of each individual bioclimatic variable from each GCM, as obtained from WorldClim, using the terra package. Maps of each variable under current and future climate conditions are presented in Supplementary Figures S6 and S7.
Environmental predictor variables
We used elevation data from the ArcticDEM available from the Polar Geospatial Center (Porter et al. Citation2018) to create a 2-m resolution digital elevation model (DEM) across the study area. We aggregated the DEM to 30-m resolution by taking the mean of the subpixels before applying any further transformations to improve data processing efficiency. Cells of missing data in this DEM were filled using the Multi-Error-Removed Improved Terrain DEM (Yamazaki et al. Citation2017) that we resampled to match the resolution and extent of the ArcticDEM area using the bilinear method in the “resample” function of the terra package. We calculated slope using the “terrain” function from the terra package and the vector ruggedness measure (VRM) using the tool developed by Sappington, Longshore, and Thompson (Citation2007) implemented in ESRI ArcMap (v10.6.1). VRM provides a measure of ruggedness that is independent of slope and is represented as an index value between 0 and 1, where 0 is considered flat and 1 is most rugged (Sappington, Longshore, and Thompson Citation2007). Throughout this article, we refer to VRM as “ruggedness.” We also calculated aspect and the topographic wetness index for this analysis; however, in early model iterations these variables were among the least important and were dropped from subsequent models. We resampled all environmental data from 30 meters to match the 30-arcsecond resolution used in this analysis using the bilinear method of the “resample” function in the terra package. Maps of elevation, slope, and ruggedness are presented in Supplementary Figure S8. We also used the National Aeronautic and Space Administration’s Arctic Boreal and Vulnerability Experiment annual land cover classification (Wang et al. Citation2019) to remove any cells from the analysis that were classified as “water” in 2014 (the last available year of data).
Species distribution modeling
We constructed SDMs for five common tundra shrub species to investigate the relative response of each species to climate change under projected climate warming scenarios. We also evaluated the influence of data type (presence/absence data or presence/pseudo-absence data) on model performance and suitability predictions.
Ensemble SDMs were generated using the biomod2 package (v4.0; Thuiller et al. Citation2022) in the R statistical software (R Core Team Citation2019). Ensemble models included generalized linear models, generalized boosted models (GBM), multiple adaptive regression splines, artificial neural networks, and random forest (RF) algorithms, which were set to use default modeling options in the biomod2 package. These models represent a mix of traditional linear techniques (generalized linear models and multiple adaptive regression splines), decision trees (GBM and RF), and machine learning (artificial neural networks, GBM, and RF) algorithms (see ). Ensemble SDM analyses commonly use a wide variety of such algorithms with successful results (Fournier et al. Citation2017; Lee, Williams, and Pearson Citation2019; Kaky et al. Citation2020). We chose to use an ensemble method because recent work has shown that no single SDM algorithm has superior prediction power (Segurado and Araújo Citation2004; Hao et al. Citation2020). The ensemble method has also been shown to outperform individual models in SDM studies (Marmion et al. Citation2009). We generated ensemble models to create projections of species habitat suitability by taking the mean of individual models. We also used ensemble models to project future habitat suitability using CMIP5 RCP8.5 climate data.
Table 3. Model descriptions.
To independently evaluate the performance of ensemble SDMs, we used independent validation data to calculate a series of performance metrics listed in . For each ensemble model, we set aside a random subset of 10 percent of the data for this purpose. Because individual metrics provide different information on model performance and there can be disagreement with the influence of data on performance metrics (such as prevalence on area under the receiver operating characteristic curve [AUC]; see Allouche, Tsoar, and Kadmon Citation2006; Leroy et al. Citation2018), we use multiple metrics to test model performance (). Because all metrics seek to highlight different aspects of the performance and accuracy of modeled results, considering many such metrics allowed us to better understand the overall performance for comparative purposes. We also created a null model with 100 randomly allocated “presence” locations and 100 randomly allocated “absence” locations (similar to sample size of the three shrubs) to determine the relative performance of each SDM model against random predictions.
Table 4. Description of performance metrics used for model evaluation.
We used the variable importance function in biomod2 to understand the potential drivers of shrub species’ distributions in the Beaufort Delta region and to assess the influence of environmental predictors on habitat suitability under projected climate warming. This function calculates variable importance by randomizing a single variable in each of five randomized permutations to calculate the correlation between the predictions of the complete and randomized variable ensemble models (Thuiller et al. Citation2022). Variables that have a lower correlation value when removed from the model are assumed have greater influence on model predictions.
Results
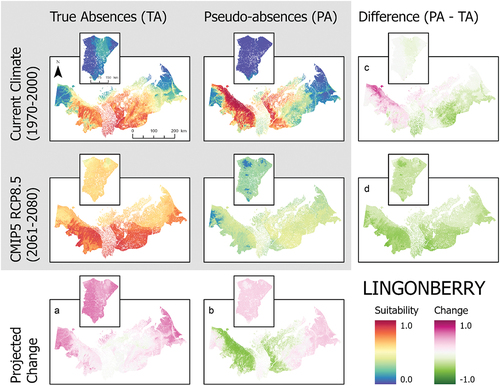
Our SDMs projected that climate warming will enhance habitat suitability of all shrubs considered in this study beyond the current range limits of all species (; ). However, contrary to our expectations, climate warming also reduced habitat suitability for species in the core regions (area of highest suitability) of their current habitat suitability projections (). This was particularly in the pseudo-absence models. These general trends of change are observable with both data types, although true absence data tend to result in greater increases of habitat suitability (). Projected shifts in habitat suitability in response to climate warming showed similar patterns among true absence models, but the magnitude of change differed considerably among species. The greatest increase in suitability across the entire study area was lingonberry, with an increase in suitability of 0.369. The species with the lowest observed change in habitat suitability was Labrador tea, increasing by 0.080 (). On Banks Island, habitat suitability showed large increases in response to climate for all shrub species modeled ().
Table 5. Mean and standard deviation of habitat suitability across the entire study area for each model under current (1970 to 2000) and future (2061 to 2080) climate.
Figure 2. Ensemble habitat suitability maps (gray box) for alder (Alnus viridis) projected under current and future climate conditions using true absence and pseudo-absence models. Banks Island is inset over the mainland portion of the study area for enhanced visualization. Plots (A)–(D) correspond to differences between climate projections and data types along the columns and rows.
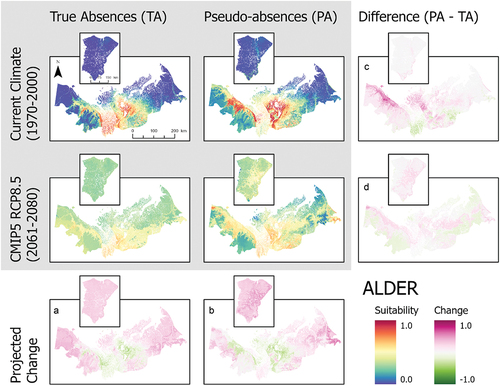
Figure 3. Ensemble habitat suitability maps (gray box) for birch (Betula nana and B. glandulosa) projected under current and future climate conditions using true absence and pseudo-absence models. Banks Island is inset over the mainland portion of the study area for enhanced visualization. Plots (A)–(D) correspond to differences between climate projections and data types along the columns and rows.
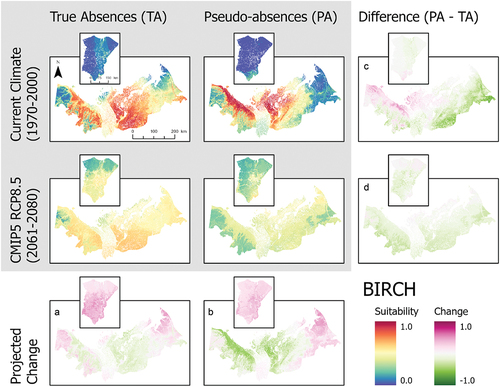
Figure 4. Ensemble habitat suitability maps (gray box) for marsh Labrador tea (Ledum decumbens) projected under current and future climate conditions using true absence and pseudo-absence models. Banks Island is inset over the mainland portion of the study area for enhanced visualization. Plots (A)–(D) correspond to differences between climate projections and data types along the columns and rows.
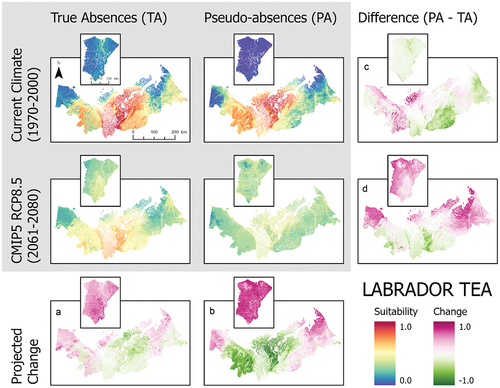
Figure 5. Ensemble habitat suitability maps (gray box) for bog bilberry (Vaccinium uliginosum) projected under current and future climate conditions using true absence and pseudo-absence models. Banks Island is inset over the mainland portion of the study area for enhanced visualization. Plots (A)–(D) correspond to differences between climate projections and data types along the columns and rows.
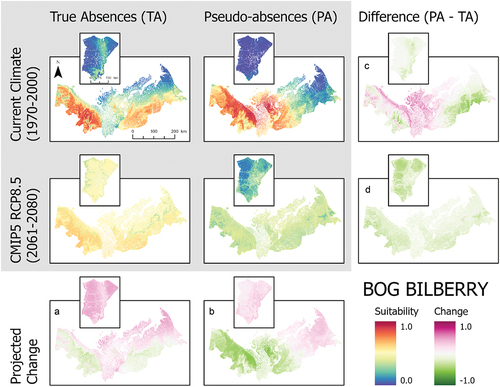
Figure 6. Ensemble habitat suitability maps (gray box) for lingonberry (Vaccinium vitis-idaea) projected under current and future climate conditions using true absences and pseudo-absences models. Banks Island is inset over the mainland portion of the study area for enhanced visualization. Plots (A)–(D) correspond to differences between climate projections and data types along the columns and rows.
The SDMs constructed in this analysis ran with moderate or reasonable model performance but exhibited considerable variation among performance metrics (). With respect to the two most commonly used model performance metrics, AUC and true skill statistic (TSS), on average, AUC noted marginally better performance on pseudo-absence data and TSS showed better performance with true absence data (). On average, percentage correctly classified, specificity, TSS, and overprediction rate (OPR) indicate better performance for SDMs with the implementation of true absence data ().
Table 6. Ensemble model performance metrics calculated using independent data.
These SDMs also showed large differences in habitat suitability projections for current climate conditions between true absence and pseudo-absence models (). For alder, the pseudo-absence model projected greater suitability along the coastal margin of the Yukon North Slope and near the communities of Inuvik and Tuktoyaktuk compared to the true absence model, which had the highest habitat suitability along the southern part of the study area in the Mackenzie Delta (). Birch and lingonberry had similar habitat suitability, but the spatial pattern varied between models using true absence and pseudo-absence data (). The true absence models for birch and lingonberry showed high suitability over a large area including the Tuktoyaktuk Coastlands. In contrast, the pseudo-absence models for these species had the highest suitability across the Yukon North Slope and a more restricted portion of the Tuktoyaktuk Coastlands. Labrador tea exhibited similar suitability between data types (). The projected suitability of bog bilberry also showed differences between data types, highlighting higher suitability in the Richardson Mountains using true absence data, but with pseudo-absence data the modeled area of suitability also included the more coastal areas of the Yukon North Slope and parts of the Tuktoyaktuk Coastlands (). Lastly, in the cases of bog bilberry and lingonberry, there were notable differences between true absence and pseudo-absence models on Banks Island, with suitability exceeding 0.5 in the true absence models for these species ().
When considered across both data types, the three most commonly important variables across all species are the annual mean temperature, precipitation of the warmest quarter, and elevation (). Differences in variable importance between data types were otherwise species dependent. True absence and pseudo-absence models also showed variation in the most important variables driving model projections (). This is particularly notable for bog bilberry in which the most important variable for true absence is mean diurnal range but ranked least important in the pseudo-absence model ().
Table 7. Ranking of the top five variables for each model in order of importance (1 is most important) for each species for both true absence (TA) and pseudo-absence (PA) models.
Figure 7. Importance scores for the predictor variables used in true absence ensemble SDM for each species.
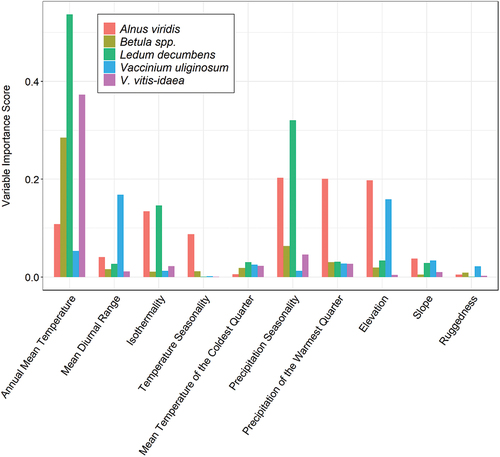
The rank and magnitude of important variables also differed substantially between species in true absence models (). For example, annual mean temperature was key in predicting the distributions of birch, Labrador tea, and lingonberry, whereas alder and bog bilberry showed a greater reliance on variables derived from elevation or precipitation data (). Of all variables in true absence models, annual mean temperature, precipitation seasonality, and precipitation of the warmest quarter were most often of high importance across all modeled species ().
Discussion
Tundra shrub response dynamics
Our results support existing literature showing that climate warming will drive range expansion in tundra shrubs (Epstein et al. Citation2004; Myers-Smith and Hik Citation2018; Mekonnen, Riley, Berner et al. Citation2021), but suggests that the magnitude of change will differ considerably among species. Our models also highlight the potential for high Arctic landscapes not currently dominated by shrubs to become climatically suitable in the near future. This finding is consistent with recent remote sensing and field-based studies that have documented the proliferation of shrubs in tundra landscapes across the circumpolar region (Tape, Sturm, and Racine Citation2006; Myers-Smith et al. Citation2011; Jørgensen, Meilby, and Kollmann Citation2013; Lantz, Marsh, and Kokelj Citation2013; Fraser et al. Citation2014; Frost and Epstein Citation2014; Martin et al. Citation2017). Of particular note, greater increases in temperature across Banks Island compared to the Yukon North Slope, Tuktoyaktuk Coastlands, and Bathurst Peninsula (Supplementary Figure S6a) resulted in predictions of higher future suitability in this region.
Our finding that future habitat suitability differed among species suggests that shrubs will respond individualistically to climate warming based on resource requirements and physiological adaptations (Chapin et al. Citation1996). This is also evidenced by our observations of differences in variable importance among the species we modeled using true absence data. The importance of precipitation seasonality, particularly for alder and Labrador tea, shows that climate-driven expansion in these species will likely be mediated by soil moisture. Precipitation seasonality is linked to the temporal availability of water across the landscape, which, in conjunction with the physical properties of soil, influences a plant’s ability to access and retain moisture (O’Donnell and Ignizio Citation2012; Renne et al. Citation2019). This explanation is consistent with recent findings showing that growth and productivity of alder in upslope areas is moisture limited (Black, Wallace, and Baltzer Citation2021). Higher soil moisture has also been associated with proliferation of tundra shrubs in general (Tape, Sturm, and Racine Citation2006; Frost and Epstein Citation2014; Myers-Smith et al. Citation2015; Cameron and Lantz Citation2016; Ackerman et al. Citation2017) and increased vegetation growth (Elmendorf et al. Citation2012; Ackerman et al. Citation2017; Bjorkman et al. Citation2018) on these dynamic landscapes.
Our analysis also suggests that physiological tolerances in birch and lingonberry will mediate how their ranges will respond to ongoing warming. The relatively high importance of annual mean temperature in these models compared to variability in precipitation variables for these species suggests that birch and lingonberry will be less moisture limited under a warmer climate (). This finding is consistent with previous research showing the greater tolerance of lingonberry to a range of environmental conditions (Taulavuori, Laine, and Taulavuori Citation2013). Several studies also show that these species can respond rapidly to increased temperature. Lingonberry exhibits increased shoot growth in response to rising temperature (Shevtsova, Haukioja, and Ojala Citation1997) and dwarf birch responds to experimental warming with earlier germination and higher recruitment (Milbau et al. Citation2009). Dwarf birch is also capable of rapid secondary growth and reproduction under warming-induced increases in soil nutrient mineralization (Bret‐Harte, Shaver, and Chapin Citation2002).
It is important to note that the observed shifts in habitat suitability predicted by our SDMs do not consider all ecological factors that can limit dispersal and recruitment such as biotic (i.e., species interactions) or abiotic (i.e., seedbed conditions) vectors (Angers-Blondin, Myers-Smith, and Boudreau Citation2018) or unreasonably large distances (i.e., across large water bodies). For example, small populations of birch, Labrador tea, bog bilberry, and lingonberry on Banks Island (Aiken et al. Citation2007) provide seed sources that could facilitate range expansion consistent with our SDMs. Yet, the absence of alder on Banks Island suggests that seed limitation will cause range expansion in this species to lag behind the presence of a suitable climate. Increased density of birch (Ropars and Boudreau Citation2012) and alder (Travers‐Smith and Lantz Citation2020) across the low Arctic and subarctic without significant range expansion also indicates that dispersal limitation can cause temporal lags between warming and range expansion (Svenning and Sandel Citation2013).
In addition to dispersal limitations, tundra vegetation dynamics are heavily influenced by disturbance (Lantz et al. Citation2009; Lantz, Gergel, and Henry Citation2010; Wang et al. Citation2020; Chen, Hu, and Lara Citation2021; Lantz, Zhang, and Kokelj Citation2022). Wildfire, in particular, can cause significant responses in shrub growth, which can be either positive or negative depending on fire size, frequency, severity, and substrate (Lantz, Gergel, and Henry Citation2010; Chen Citation2020; Travers‐Smith and Lantz Citation2020; Chen, Hu, and Lara Citation2021). Thermokarst processes have also been associated with increased shrub abundance (Lantz et al. Citation2009; Frost et al. Citation2013; Wolter et al. Citation2016; Huebner, Buchwal, and Bret-Harte Citation2022; Lantz, Zhang, and Kokelj Citation2022) and are likely to play a role in changing shrub distributions. Advances in landscape and global modeling efforts and our understanding of vegetation ecology and responses to disturbance are crucial for understanding how landscapes are changing and how they will influence larger systems.
Differences in suitability among models parameterized with true absence and pseudo-absence data highlight the sensitivity of SDMs and suggest that model outputs should be compared to expert knowledge and ecological information of processes known to drive dispersal and recruitment. Additionally, combined modeling approaches including mechanistic models, longitudinal studies, and other experimental data sources could improve model design and interpretation. The statistical outputs of SDMs based on observations of presences and absences also do not account for factors including microsite availability and predation that frequently limit recruitment (Soberón and Nakamura Citation2009). Differences in the projected response of alder, birch, Labrador tea, bog bilberry, and lingonberry also highlight the importance of using species-based assessments of change to parameterize larger scale dynamic vegetation models. Dynamic vegetation models are commonplace in coupled Earth system models and GCMs, and advances in the implementation and accuracy of species-based modeling will benefit climate projections (Quillet, Peng, and Garneau Citation2010). This is clearly demonstrated by Druel et al. (Citation2019), whose implementation of a dynamic global vegetation model (ORCHIDEE Land Surface Model) did not reproduce significant shrub expansion that has been observed across the circumpolar north (Tape, Sturm, and Racine Citation2006; Lantz, Marsh, and Kokelj Citation2013; Fraser et al. Citation2014; Moffat et al. Citation2016; Myers-Smith and Hik Citation2018). This is likely the product of local heterogeneity in microclimate or microtopographic conditions (see Ropars and Boudreau Citation2012; Gamon et al. Citation2013; Bjorkman et al. Citation2018; Mekonnen, Riley, Grant et al. Citation2021; Seider et al. Citation2022), an idea supported by Druel et al. (Citation2019) and our own results highlighting the importance of species-specific response data. Parametrizing Earth system models appropriately is important because terrestrial vegetation impacts the climate system by influencing energy fluxes (i.e., surface reflectance, carbon exchange) and surface conditions (i.e., moisture, nutrients, temperature; Mekonnen, Riley, Grant et al. Citation2021). Coupled Earth system models typically ignore dynamic trait-based vegetation response to climate in favor of static functional tolerances (Van Bodegom et al. Citation2012; Wullschleger et al. Citation2014). Though simplification is necessary in global models, the use of broad vegetation functional types (grass, tree, cropland, etc.) may not accurately characterize vegetation change at high latitudes. Individual-based models (see Kruse et al. Citation2016) can be used to incorporate ecophysiological responses and species traits to determine responses to climate change. There are also promising advances in joint species distribution modeling, using a combination of traditional single-species SDM methods and ordination techniques to understand the interactions of multiple species from a community ecology perspective (Ovaskainen and Abrego Citation2020). These models can more directly account for interactions among species and can handle rare species better than traditional SDMs (Ovaskainen and Abrego Citation2020). With these advances in mind, it is still important to consider the data type used in modeling efforts. Our results show that data type can have a strong influence on models and, as such, decisions regarding which parameterization data to use must be made carefully.
Influence of data type
Our analysis shows that the data type used to parameterize SDMs impacts model performance and predictions and is a critical consideration in model interpretation. Projected species distributions, model performance, and ranked variable importance from models built using pseudo-absence data deviated considerably from models that used true absence data. Differences between true absence and pseudo-absence models suggest that true absence data are needed to reliably define low suitability habitats that are not adequately sampled through the pseudo-absence selection process (Brotons et al. Citation2004; Soberón and Nakamura Citation2009).
Differences in projected habitat suitability in our pseudo-absence models were likely caused by the random allocation of pseudo-absence locations across a wider range of climate and terrain conditions compared to true absences. Because pseudo-absences are not definitive locations of absence, they do not accurately represent limiting environmental conditions but provide a random sample of representative background data (Soberón and Nakamura Citation2009). Further, the possible allocation of pseudo-absence locations within the actual distribution of a species results in lower suitability estimates than true absence models that include nonambiguous absence data. Another common SDM algorithm that uses pseudo-absence data (referred to as background data) called MAXENT (Phillips, Anderson, and Schapire Citation2006) has also been shown to be highly sensitive to sampling bias caused in both presence and background data (Elith et al. Citation2006, Citation2011). Although true absence models are generally preferred because they provide information on low habitat suitability (Brotons et al. Citation2004), the accessibility of presence-only data makes the use of pseudo-absences in SDMs very popular (Santini et al. Citation2021).
The widespread use of pseudo-absence models (Santini et al. Citation2021) is concerning because our results indicate that models built using pseudo-absence data yield different results than those built using true absence data. There is also no clear evidence to support best practices for pseudo-absence selection (Santini et al. Citation2021), and the optimal number of pseudo-absence points has been found to vary considerably between modeling algorithms (Barbet‐Massin et al. Citation2012). The spatial extent from which pseudo-absences are selected also poses potential problems, because too large or small an area can create models that are not biologically relevant (Vanderwal et al. Citation2009). To facilitate the development of accurate, reliable, and better performing models, we encourage the use of open data repositories to make true absence data more widely accessible. In addition, we suggest the use of comprehensive, systematic presence/absence data collection as part of botanical inventories (Saarela, Sokoloff, and Bull Citation2017; Saarela et al. Citation2020).
Our results have important implications for predicting vegetation changes across Arctic and Subarctic ecosystems in support of conservation and land management decision making (Guisan et al. Citation2013). Recent work has stressed the importance of including SDM research in International Union for Conservation of Nature Red List developments (Breiner et al. Citation2017), conservation of endemic and rare species (Marcer et al. Citation2013; Wang et al. Citation2015), and monitoring species invasion in protected areas (Pěknicová and Berchová-Bímová Citation2016; Barbet-Massin et al. Citation2018). In all of these cases, models built with pseudo-absence data that may not adequately describe species’ distributions and responses to change may contribute to ineffective or potentially harmful decisions (Vanderwal et al. Citation2009).
Data availability
The metadata information for this analysis has been uploaded to the Polar Data Catalogue (www.polardata.ca/pdcsearch/PDCSearchDOI.jsp?doi_id=13274). Most of the data used are available by request from the authors, but data obtained from the Yukon Government and Canadian Wildlife Service are subject to sharing restrictions.
Supplemental Material
Download Zip (1.4 MB)Acknowledgments
Thank you to all field staff and students from the Arctic Landscape Ecology Lab who, over the last decade, helped collect much of the data used in this analysis. We also acknowledge Nadele Flynn (Yukon Government) and Danica Hogan (Canadian Wildlife Service) for facilitating access to additional data from northern Yukon and Banks Island, NWT. The authors also thank the two anonymous reviewers for their insightful comments and suggestions.
Disclosure statement
No potential conflict of interest was reported by the authors.
Supplementary material
Supplemental data for this article can be accessed online at https://doi.org/10.1080/15230430.2022.2121243
Additional information
Funding
References
- Ackerman, D., D. Griffin, S. E. Hobbie, and J. C. Finlay. 2017. Arctic shrub growth trajectories differ across soil moisture levels. Global Change Biology 23 (10):4294–302. doi:10.1111/gcb.13677.
- Aiken, S., M. Dallwitz, L. Consaul, C. Mcjannet, G. Boles, G. Argus, J. Gillett, P. Scott, R. Elven, M. Leblanc, et al. 2007. Flora of the Canadian Arctic archipelago. Ottawa: NRC Research Press.
- Allouche, O., A. Tsoar, and R. Kadmon. 2006. Assessing the accuracy of species distribution models: Prevalence, kappa and the true skill statistic (TSS). Journal of Applied Ecology 43 (6):1223–32. doi:10.1111/j.1365-2664.2006.01214.x.
- Angers-Blondin, S., I. H. Myers-Smith, and S. Boudreau. 2018. Plant–plant interactions could limit recruitment and range expansion of tall shrubs into alpine and Arctic tundra. Polar Biology 41 (11):2211–19. doi:10.1007/s00300-018-2355-9.
- Barbet‐Massin, M., F. Jiguet, C. H. Albert, and W. Thuiller. 2012. Selecting pseudo‐absences for species distribution models: How, where and how many? Methods in Ecology and Evolution 3 (2):327–38. doi:10.1111/j.2041-210X.2011.00172.x.
- Barbet-Massin, M., Q. Rome, C. Villemant, and F. Courchamp. 2018. Can species distribution models really predict the expansion of invasive species? Plos One 13 (3):e0193085. doi:10.1371/journal.pone.0193085.
- Bjorkman, A. D., M. G. Criado, I. H. Myers-Smith, V. Ravolainen, I. S. Jónsdóttir, K. B. Westergaard, J. P. Lawler, M. Aronsson, B. Bennett, and H. Gardfjell. 2020. Status and trends in Arctic vegetation: Evidence from experimental warming and long-term monitoring. Ambio 49 (3):678–92. doi:10.1007/s13280-019-01161-6.
- Bjorkman, A. D., I. H. Myers-Smith, S. C. Elmendorf, S. Normand, N. Rüger, P. S. Beck, A. Blach-Overgaard, et al. 2018. Plant functional trait change across a warming tundra biome. Nature 562 (7725):57–62. doi:10.1038/s41586-018-0563-7.
- Black, K. L., C. A. Wallace, and J. L. Baltzer. 2021. Seasonal thaw and landscape position determine foliar functional traits and whole-plant water use in tall shrubs on the low Arctic tundra. New Phytologist 231 (1):94–107. doi:10.1111/nph.17375.
- Bonan, G. B., S. Levis, S. Sitch, M. Vertenstein, and K. W. Oleson. 2003. A dynamic global vegetation model for use with climate models: Concepts and description of simulated vegetation dynamics. Global Change Biology 9 (11):1543–66. doi:10.1046/j.1365-2486.2003.00681.x.
- Breiner, F. T., A. Guisan, M. P. Nobis, and A. Bergamini. 2017. Including environmental niche information to improve IUCN Red List assessments. Diversity and Distributions 23 (5):484–95. doi:10.1111/ddi.12545.
- Bret‐Harte, M. S., G. R. Shaver, and F. S. Chapin. 2002. Primary and secondary stem growth in Arctic shrubs: Implications for community response to environmental change. Journal of Ecology 90 (2):251–67. doi:10.1046/j.1365-2745.2001.00657.x.
- Brotons, L., W. Thuiller, M. B. Araújo, and A. H. Hirzel. 2004. Presence‐absence versus presence‐only modelling methods for predicting bird habitat suitability. Ecography 27 (4):437–48. doi:10.1111/j.0906-7590.2004.03764.x.
- Burn, C. R., and S. Kokelj. 2009. The environment and permafrost of the Mackenzie Delta area. Permafrost and Periglacial Processes 20 (2):83–105. doi:10.1002/ppp.655.
- Cameron, E. A., and T. C. Lantz. 2016. Drivers of tall shrub proliferation adjacent to the Dempster Highway, Northwest Territories, Canada. Environmental Research Letters 11 (4):045006. doi:10.1088/1748-9326/11/4/045006.
- Campbell, T. K. F., T. C. Lantz, R. H. Fraser, and D. Hogan. 2021. High Arctic vegetation change mediated by hydrological conditions. Ecosystems 24 (1):106–21. doi:10.1007/s10021-020-00506-7.
- Chapin, F. S., M. S. Bret-Harte, S. E. Hobbie, and H. Zhong. 1996. Plant functional types as predictors of transient responses of Arctic vegetation to global change. Journal of Vegetation Science 7 (3):347–58. doi:10.2307/3236278.
- Chen, A. 2020. The effects of climate change and fire on tundra vegetation change in the western Canadian Arctic. MSc Thesis, University of Victoria.
- Chen, Y., F. S. Hu, and M. J. Lara. 2021. Divergent shrub-cover responses driven by climate, wildfire, and permafrost interactions in Arctic tundra ecosystems. Global Change Biology 27 (3):652–63. doi:10.1111/gcb.15451.
- Chen, A., T. C. Lantz, T. Hermosilla, and M. A. Wulder. 2021. Biophysical controls of increased tundra productivity in the western Canadian Arctic. Remote Sensing of Environment 258:112358. doi:10.1016/j.rse.2021.112358.
- De Groot, W., P. Thomas, and R. W. Wein. 1997. Betula nana L. and Betula glandulosa Michx. Journal of Ecology 85 (2):241–64. doi:10.2307/2960655.
- Druel, A., P. Ciais, G. Krinner, and P. Peylin. 2019. Modeling the vegetation dynamics of northern shrubs and mosses in the ORCHIDEE land surface model. Journal of Advances in Modeling Earth Systems 11 (7):2020–35. doi:10.1029/2018MS001531.
- Ecosystem Classification Group. 2012. Ecological regions of the Northwest Territories, Southern Arctic. Yellowknife, NT: Department of Environment and Natural Resources, Government of Northwest Territories.
- Ehlers, L., G. Coulombe, J. Herriges, T. Bentzen, M. Suitor, K. Joly, and M. Hebblewhite. 2021. Critical summer foraging tradeoffs in a subarctic ungulate. Ecology and Evolution 11 (24):17835–72. doi:10.1002/ece3.8349.
- Elith, J., H. Graham, C. P. Anderson, R. Dudík, M. Ferrier, S. Guisan, A. J. Hijmans, R. Huettmann, F. R. Leathwick, J. Lehmann, et al. 2006. Novel methods improve prediction of species’ distributions from occurrence data. Ecography 29 (2):129–51. doi:10.1111/j.2006.0906-7590.04596.x.
- Elith, J., S. J. Phillips, T. Hastie, M. Dudík, Y. E. Chee, and C. J. Yates. 2011. A statistical explanation of MaxEnt for ecologists. Diversity and Distributions 17 (1):43–57. doi:10.1111/j.1472-4642.2010.00725.x.
- Elmendorf, S. C., G. H. Henry, R. D. Hollister, R. G. Björk, N. Boulanger-Lapointe, E. J. Cooper, J. H. Cornelissen, et al. 2012. Plot-scale evidence of tundra vegetation change and links to recent summer warming. Nature Climate Change 2 (6):453–57. doi:10.1038/nclimate1465.
- Epstein, H. E., M. P. Calef, M. D. Walker, F. S. Chapin, and A. M. Starfield. 2004. Detecting changes in Arctic tundra plant communities in response to warming over decadal time scales. Global Change Biology 10 (8):1325–34. doi:10.1111/j.1529-8817.2003.00810.x.
- Fick, S. E., and R. J. Hijmans. 2017. WorldClim 2: New 1‐km spatial resolution climate surfaces for global land areas. International Journal of Climatology 37 (12):4302–15. doi:10.1002/joc.5086.
- Fournier, A., M. Barbet-Massin, Q. Rome, and F. Courchamp. 2017. Predicting species distribution combining multi-scale drivers. Global Ecology and Conservation 12:215–26. doi:10.1016/j.gecco.2017.11.002.
- Fraser, R. H., T. C. Lantz, I. Olthof, S. V. Kokelj, and R. A. Sims. 2014. Warming-induced shrub expansion and lichen decline in the Western Canadian Arctic. Ecosystems 17 (7):1151–68. doi:10.1007/s10021-014-9783-3.
- Frost, G. V., and H. E. Epstein. 2014. Tall shrub and tree expansion in Siberian tundra ecotones since the 1960s. Global Change Biology 20 (4):1264–77. doi:10.1111/gcb.12406.
- Frost, G. V., H. E. Epstein, D. A. Walker, G. Matyshak, and K. Ermokhina. 2013. Patterned-ground facilitates shrub expansion in Low Arctic tundra. Environmental Research Letters 8 (1):015035. doi:10.1088/1748-9326/8/1/015035.
- Furlow, J. J. 1979. The systematics of the American species of Alnus (Betulaceae). Rhodora 81:1–121.
- Furlow, J. J. 1997. Alnus alnobetula. In Flora of North America North of Mexico, Flora of North America Editorial Committee, eds. New York: Oxford University Press.
- Gamon, J. A., K. F. Huemmrich, R. S. Stone, and C. E. Tweedie. 2013. Spatial and temporal variation in primary productivity (NDVI) of coastal Alaskan tundra: Decreased vegetation growth following earlier snowmelt. Remote Sensing of Environment 129:144–53. doi:10.1016/j.rse.2012.10.030.
- Gill, D. 1972. The point bar environment in the Mackenzie River Delta. Canadian Journal of Earth Sciences 9 (11):1382–93. doi:10.1139/e72-125.
- Gill, D. 1973. Floristics of a plant succession sequence in the Mackenzie Delta, Northwest Territories. Polarforschung 43:55–65.
- Gill, H. K., T. C. Lantz, B. O’neill, and S. V. Kokelj. 2014. Cumulative impacts and feedbacks of a gravel road on shrub tundra ecosystems in the Peel Plateau, Northwest Territories, Canada. Arctic, Antarctic, and Alpine Research 46 (4):947–61. doi:10.1657/1938-4246-46.4.947.
- Guisan, A., R. Tingley, J. B. Baumgartner, I. Naujokaitis-Lewis, P. R. Sutcliffe, A. I. T. Tulloch, T. J. Regan, L. Brotons, E. Mcdonald-Madden, C. Mantyka-Pringle, et al. 2013. Predicting species distributions for conservation decisions. Ecology Letters 16 (12):1424–35. doi:10.1111/ele.12189.
- Guisan, A., and N. E. Zimmermann. 2000. Predictive habitat distribution models in ecology. Ecological Modelling 135 (2–3):147–86. doi:10.1016/S0304-3800(00)00354-9.
- Hao, T., J. Elith, J. J. Lahoz-Monfort, and G. Guillera-Arroita. 2020. Testing whether ensemble modelling is advantageous for maximising predictive performance of species distribution models. Ecography 43 (4):549–58. doi:10.1111/ecog.04890.
- Hijmans, R. J., S. E. Cameron, J. L. Parra, P. G. Jones, and A. Jarvis. 2005. Very high resolution interpolated climate surfaces for global land areas. International Journal of Climatology 25 (15):1965–78. doi:10.1002/joc.1276.
- Huebner, D. C., A. Buchwal, and M. S. Bret-Harte. 2022. Retrogressive thaw slumps in the Alaskan Low Arctic may influence tundra shrub growth more strongly than climate. Ecosphere 13 (6):e4106. doi:10.1002/ecs2.4106.
- Intergovernmental Panel on Climate Change. 2019. IPCC special report on the ocean and cryosphere in a changing climate. [ H.-O. Pörtner, D.C. Roberts, V. Masson-Delmotte, P. Zhai, M. Tignor, E. Poloczanska, K. Mintenbeck, A. Alegría, M. Nicolai, A. Okem, J. Petzold, B. Rama, N.M. Weyer (eds.)].
- Jacquemart, A.-L. 1996. Vaccinium Uliginosum L. Journal of Ecology 84 (5):771–85. doi:10.2307/2261339.
- Jessop, A. M. 1971. The distribution of glacial perturbation of heat flow in Canada. Canadian Journal of Earth Sciences 8 (1):162–66. doi:10.1139/e71-012.
- Joly, K., R. R. Jandt, C. R. Meyers, and M. J. Cole. 2007. Changes in vegetative cover on Western Arctic Herd winter range from 1981 to 2005: Potential effects of grazing and climate change. Rangifer 27 (4):199–207. doi:10.7557/2.27.4.345.
- Jørgensen, R. H., H. Meilby, and J. Kollmann. 2013. Shrub expansion in SW Greenland under modest regional warming: disentangling effects of human disturbance and grazing. Arctic, Antarctic, and Alpine Research 45 (4):515–25. doi:10.1657/1938-4246-45.4.515.
- Kaky, E., V. Nolan, A. Alatawi, and F. Gilbert. 2020. A comparison between ensemble and MaxEnt species distribution modelling approaches for conservation: A case study with Egyptian medicinal plants. Ecological Informatics 60:101150. doi:10.1016/j.ecoinf.2020.101150.
- Kindt, R., and R. Coe. 2005. Tree diversity analysis. A manual and software for common statistical methods for ecological and biodiversity studies. In ICRAF, ed. World Agroforestry Centre, 2.123 ed. C, 2.123 ed. Nairobi, Kenya.
- Kokelj, S. V., J. Tunnicliffe, D. Lacelle, T. C. Lantz, K. S. Chin, and R. Fraser. 2015. Increased precipitation drives mega slump development and destabilization of ice-rich permafrost terrain, northwestern Canada. Global and Planetary Change 129:56–68.
- Kruse, S., M. Wieczorek, F. Jeltsch, and U. Herzschuh. 2016. Treeline dynamics in Siberia under changing climates as inferred from an individual-based model for Larix. Ecological Modelling 338:101–21. doi:10.1016/j.ecolmodel.2016.08.003.
- Lantz, T. C., S. E. Gergel, and G. H. R. Henry. 2010. Response of green alder (Alnus viridis subsp. fruticosa) patch dynamics and plant community composition to fire and regional temperature in north-western Canada. Journal of Biogeography 37:1597–610.
- Lantz, T. C., S. V. Kokelj, S. E. Gergel, and G. H. R. Henry. 2009. Relative impacts of disturbance and temperature: Persistent changes in microenvironment and vegetation in retrogressive thaw slumps. Global Change Biology 15 (7):1664–75. doi:10.1111/j.1365-2486.2009.01917.x.
- Lantz, T. C., P. Marsh, and S. V. Kokelj. 2013. Recent shrub proliferation in the Mackenzie Delta uplands and microclimatic implications. Ecosystems 16 (1):47–59. doi:10.1007/s10021-012-9595-2.
- Lantz, T. C., Y. Zhang, and S. V. Kokelj. 2022. Impacts of ecological succession and climate warming on permafrost aggradation in drained lake basins of the Tuktoyaktuk Coastlands, Northwest Territories, Canada. Permafrost and Periglacial Processes 33 (2):176–92. doi:10.1002/ppp.2143.
- Larking, T., E. Davis, R. Way, L. Hermanutz, and A. Trant. 2021. Recent greening driven by species-specific shrub growth characteristics in Nunatsiavut, Labrador, Canada. Arctic Science 7 (4): 784–797. doi:10.1139/as-2020-0031.
- Lee, C. K., P. H. Williams, and R. G. Pearson. 2019. Climate change vulnerability higher in Arctic than alpine bumblebees. Frontiers of Biogeography 11 (4). doi:10.21425/F5FBG42455.
- Leroy, B., R. Delsol, B. Hugueny, C. N. Meynard, C. Barhoumi, M. Barbet-Massin, and C. Bellard. 2018. Without quality presence–absence data, discrimination metrics such as TSS can be misleading measures of model performance. Journal of Biogeography 45:1994–2002.
- Marcer, A., L. Sáez, R. Molowny-Horas, X. Pons, and J. Pino. 2013. Using species distribution modelling to disentangle realised versus potential distributions for rare species conservation. Biological Conservation 166:221–30. doi:10.1016/j.biocon.2013.07.001.
- Marmion, M., M. Parviainen, M. Luoto, R. K. Heikkinen, and W. Thuiller. 2009. Evaluation of consensus methods in predictive species distribution modelling. Diversity and Distributions 15:59–69.
- Martin, A. C., E. S. Jeffers, G. Petrokofsky, I. Myers-Smith, and M. Macias-Fauria. 2017. Shrub growth and expansion in the Arctic tundra: An assessment of controlling factors using an evidence-based approach. Environmental Research Letters 12:085007.
- McGuire, A. D., F. S. Chapin, J. E. Walsh, and C. Wirth. 2006. Integrated regional changes in Arctic climate feedbacks: Implications for the global climate system. Annual Review of Environment and Resources 31 (1):61–91. doi:10.1146/annurev.energy.31.020105.100253.
- Mekonnen, Z. A., W. J. Riley, L. T. Berner, N. J. Bouskill, M. S. Torn, G. Iwahana, A. L. Breen, I. H. Myers-Smith, M. G. Criado, Y. Liu, et al. 2021. Arctic tundra shrubification: A review of mechanisms and impacts on ecosystem carbon balance. Environmental Research Letters 16:053001.
- Mekonnen, Z. A., W. J. Riley, R. F. Grant, V. G. Salmon, C. M. Iversen, S. C. Biraud, A. L. Breen, and M. J. Lara. 2021. Topographical controls on hillslope‐scale hydrology drive shrub distributions on the Seward Peninsula, Alaska. Journal of Geophysical Research: Biogeosciences 126:e2020JG005823.
- Milbau, A., B. J. Graae, A. Shevtsova, and I. Nijs. 2009. Effects of a warmer climate on seed germination in the subarctic. Annals of Botany 104 (2):287–96. doi:10.1093/aob/mcp117.
- Moffat, N. D., T. C. Lantz, R. H. Fraser, and I. Olthof. 2016. Recent vegetation change (1980–2013) in the tundra ecosystems of the Tuktoyaktuk Coastlands, NWT, Canada. Arctic, Antarctic, and Alpine Research 48:581–97.
- Moss, R. H., J. A. Edmonds, K. A. Hibbard, M. R. Manning, S. K. Rose, D. P. Van Vuuren, T. R. Carter, S. Emori, M. Kainuma, and T. Kram. 2010. The next generation of scenarios for climate change research and assessment. Nature 463 (7282):747–56. doi:10.1038/nature08823.
- Myers-Smith, I. H., S. C. Elmendorf, P. S. Beck, M. Wilmking, M. Hallinger, D. Blok, K. D. Tape, et al. 2015. Climate sensitivity of shrub growth across the tundra biome. Nature Climate Change 5 (9):887–91. doi:10.1038/nclimate2697.
- Myers-Smith, I. H., B. C. Forbes, M. Wilmking, M. Hallinger, T. Lantz, D. Blok, K. D. Tape, M. Macias-Fauria, U. Sass-Klaassen, and E. Lévesque. 2011. Shrub expansion in tundra ecosystems: Dynamics, impacts and research priorities. Environmental Research Letters 6 (4):045509. doi:10.1088/1748-9326/6/4/045509.
- Myers-Smith, I. H., and D. S. Hik. 2018. Climate warming as a driver of tundra shrubline advance. Journal of Ecology 106 (2):547–60. doi:10.1111/1365-2745.12817.
- O’Donnell, M. S., and D. A. Ignizio. 2012. Bioclimatic predictors for supporting ecological applications in the conterminous United States. US Geological Survey Data Series 691:4–9.
- Ovaskainen, O., and N. Abrego. 2020. Joint species distribution modelling: With applications in R. Cambridge: Cambridge University Press.
- Pearce, C. 1986. The distribution and ecology of the shoreline vegetation on the Mackenzie Delta, NWT. PhD Dissertation, University of Calgary.
- Pearce, J. L., and M. S. Boyce. 2006. Modelling distribution and abundance with presence-only data. Journal of Applied Ecology 43 (3):405–12. doi:10.1111/j.1365-2664.2005.01112.x.
- Pěknicová, J., and K. Berchová-Bímová. 2016. Application of species distribution models for protected areas threatened by invasive plants. Journal for Nature Conservation 34:1–7. doi:10.1016/j.jnc.2016.08.004.
- Phillips, S. J., R. P. Anderson, and R. E. Schapire. 2006. Maximum entropy modeling of species geographic distributions. Ecological Modelling 190 (3–4):231–59. doi:10.1016/j.ecolmodel.2005.03.026.
- Phillips, S. J., M. Dudík, J. Elith, C. H. Graham, A. Lehmann, J. Leathwick, and S. Ferrier. 2009. Sample selection bias and presence‐only distribution models: Implications for background and pseudo‐absence data. Ecological Applications 19 (1):181–97. doi:10.1890/07-2153.1.
- Port, U., V. Brovkin, and M. Claussen. 2012. The influence of vegetation dynamics on anthropogenic climate change. Earth System Dynamics 3 (2):233–43. doi:10.5194/esd-3-233-2012.
- Porter, C., P. Morin, I. Howat, M. Noh, B. Bates, K. Peterman, S. Keesey, M. Schlenk, J. Gardiner, K. Tomko, et al. 2018. Arctic DEM. 3 ed. Harvard Dataverse, V3.0. doi:10.7910/DVN/OHHUKH.
- Quillet, A., C. Peng, and M. Garneau. 2010. Toward dynamic global vegetation models for simulating vegetation–climate interactions and feedbacks: Recent developments, limitations, and future challenges. Environmental Reviews 18:333–53. doi:10.1139/A10-016.
- Rampton, V. 1982. Quaternary geology of the Yukon Coastal Plain. Ottawa, Ontario: Geological Survey of Canada.
- Rampton, V. 1988. Quaternary geology of the Tuktoyaktuk Coastlands, Northwest Territories. Ottawa, Ontario: Geological Survey of Canada.
- R Core Team. 2019. R: A language and environment for statistical computing. Vienna, Austria: R Foundation for Statistical Computing.
- Renne, R. R., J. B. Bradford, I. C. Burke, and W. K. Lauenroth. 2019. Soil texture and precipitation seasonality influence plant community structure in North American temperate shrub steppe. Ecology 100 (11):e02824. doi:10.1002/ecy.2824.
- Ropars, P., and S. Boudreau. 2012. Shrub expansion at the forest–tundra ecotone: Spatial heterogeneity linked to local topography. Environmental Research Letters 7 (1):015501. doi:10.1088/1748-9326/7/1/015501.
- Saarela, J. M., P. C. Sokoloff, and R. D. Bull. 2017. Vascular plant biodiversity of the lower Coppermine River valley and vicinity (Nunavut, Canada): An annotated checklist of an Arctic flora. PeerJ 5:e2835. doi:10.7717/peerj.2835.
- Saarela, J. M., P. C. Sokoloff, L. J. Gillespie, R. D. BULL, B. A. Bennett, and S. Ponomarenko. 2020. Vascular plants of Victoria Island (Northwest Territories and Nunavut, Canada): A specimen-based study of an Arctic flora. PhytoKeys 141:1–330. doi:10.3897/phytokeys.141.48810.
- Santini, L., A. Benítez-López, L. Maiorano, M. Čengić, and M. A. J. Huijbregts. 2021. Assessing the reliability of species distribution projections in climate change research. Diversity and Distributions 27 (6):1035–50. doi:10.1111/ddi.13252.
- Sappington, J. M., K. M. Longshore, and D. B. Thompson. 2007. Quantifying landscape ruggedness for animal habitat analysis: A case study using bighorn sheep in the Mojave Desert. The Journal of Wildlife Management 71 (5):1419–26. doi:10.2193/2005-723.
- Scoggan, H. J. 1979. The flora of Canada. Ottawa, Canada: National Museum of Natural Sciences.
- Segurado, P., and M. B. Araújo. 2004. An evaluation of methods for modelling species distributions. Journal of Biogeography 31 (10):1555–68. doi:10.1111/j.1365-2699.2004.01076.x.
- Seider, J. H., T. C. Lantz, T. Hermosilla, M. A. Wulder, and J. A. Wang. 2022. Biophysical determinants of shifting tundra vegetation productivity in the Beaufort Delta region of Canada. Ecosystems. doi:10.1007/s10021-021-00725-6.
- Shevtsova, A., E. Haukioja, and A. Ojala. 1997. Growth response of subarctic dwarf shrubs, empetrum nigrum and vaccinium vitis-idaea, to manipulated environmental conditions and species removal. Oikos 78 (3):440–58. doi:10.2307/3545606.
- Shipman, N. 2021. Summer 2019 vegetation monitoring in the Mackenzie Delta, NWT. Unpublished data.
- Soberón, J., and M. Nakamura. 2009. Niches and distributional areas: Concepts, methods, and assumptions. Proceedings of the National Academy of Sciences 106 (supplement_2):19644. doi:10.1073/pnas.0901637106.
- Steedman, A. E. 2014. The ecology and dynamics of ice wedge degradation in high-centre polygonal terrain in the uplands of the Mackenzie Delta region, Northwest Territories. MSc Thesis, University of Victoria.
- Svenning, J. C., and B. Sandel. 2013. Disequilibrium vegetation dynamics under future climate change. American Journal of Botany 100 (7):1266–86. doi:10.3732/ajb.1200469.
- Tape, K. D., M. Sturm, and C. Racine. 2006. The evidence for shrub expansion in Northern Alaska and the Pan‐Arctic. Global Change Biology 12 (4):686–702. doi:10.1111/j.1365-2486.2006.01128.x.
- Taulavuori, K., K. Laine, and E. Taulavuori. 2013. Experimental studies on Vaccinium myrtillus and Vaccinium vitis-idaea in relation to air pollution and global change at northern high latitudes: A review. Environmental and Experimental Botany 87:191–96. doi:10.1016/j.envexpbot.2012.10.002.
- Taylor, K. E., R. J. Stouffer, and G. A. Meehl. 2012. An overview of CMIP5 and the experiment design. Bulletin of the American Meteorological Society 93 (4):485–98. doi:10.1175/BAMS-D-11-00094.1.
- Thuiller, W., D. Georges, M. Gueguen, R. Engler, F. Breiner, and B. Lafourcade. 2022. Biomod2: Ensemble platform for species distribution modeling. R package version 4.0.
- Travers‐Smith, H. Z., and T. C. Lantz. 2020. Leading‐edge disequilibrium in alder and spruce populations across the forest–tundra ecotone. Ecosphere 11 (7):e03118. doi:10.1002/ecs2.3118.
- Travers-Smith, H. Z., T. C. Lantz, and R. H. Fraser. 2021. Surface water dynamics and rapid lake drainage in the Western Canadian Subarctic (1985–2020). Journal of Geophysical Research: Biogeosciences 126:e2021JG006445.
- van Bodegom, P. M., J. C. Douma, J. P. M. Witte, J. C. Ordoñez, R. P. Bartholomeus, and R. Aerts. 2012. Going beyond limitations of plant functional types when predicting global ecosystem–atmosphere fluxes: Exploring the merits of traits-based approaches. Global Ecology and Biogeography 21 (6):625–36. doi:10.1111/j.1466-8238.2011.00717.x.
- Vanderwal, J., L. P. Shoo, C. Graham, and S. E. Williams. 2009. Selecting pseudo-absence data for presence-only distribution modeling: How far should you stray from what you know? Ecological Modelling 220 (4):589–94. doi:10.1016/j.ecolmodel.2008.11.010.
- Vincent, L., X. Zhang, R. Brown, Y. Feng, E. Mekis, E. Milewska, H. Wan, and X. Wang. 2015. Observed trends in Canada’s climate and influence of low-frequency variability modes. Journal of Climate 28 (11):4545–60. doi:10.1175/JCLI-D-14-00697.1.
- Walker, M. D., C. H. Wahren, R. D. Hollister, G. H. Henry, L. E. Ahlquist, J. M. Alatalo, M. S. Bret-Harte, M. P. Calef, T. V. Callaghan, and A. B. Carroll. 2006. Plant community responses to experimental warming across the tundra biome. Proceedings of the National Academy of Sciences 103:1342–46. doi:10.1073/pnas.0503198103.
- Wang, J. A., D. Sulla‐menashe, C. E. Woodcock, O. Sonnentag, R. F. Keeling, and M. A. Friedl. 2020. Extensive land cover change across Arctic–Boreal Northwestern North America from disturbance and climate forcing. Global Change Biology 26 (2):807–22. doi:10.1111/gcb.14804.
- Wang, J. A., D. Sulla-Menashe, C. E. Woodcock, O. Sonnentag, R. Keeling, and M. Friedl. 2019. ABoVE: Landsat-derived annual dominant land cover across ABoVE core domain, 1984-2014. Oak Ridge, TN: ORNL DAAC.
- Wang, H.-H., C. L. Wonkka, M. L. Treglia, W. E. Grant, F. E. Smeins, and W. E. Rogers. 2015. Species distribution modelling for conservation of an endangered endemic orchid. AoB Plants 7:plv039. doi:10.1093/aobpla/plv039.
- Wildlife Management Advisory Council, North Slope & Aklavik Hunters and Trappers Committee. 2018. Yukon North Slope Inuvialuit traditional use study. Whitehorse, YK: Wildlife Management and Advisory Council (North Slope).
- Wisz, M. S., and A. Guisan. 2009. Do pseudo-absence selection strategies influence species distribution models and their predictions? An information-theoretic approach based on simulated data. BMC Ecology 9 (1):8. doi:10.1186/1472-6785-9-8.
- Wolter, J., H. Lantuit, M. Fritz, M. Macias-Fauria, I. Myers-Smith, and U. Herzschuh. 2016. Vegetation composition and shrub extent on the Yukon coast, Canada, are strongly linked to ice-wedge polygon degradation. Polar Research 35 (1):27489. doi:10.3402/polar.v35.27489.
- Wullschleger, S. D., H. E. Epstein, E. O. Box, E. S. Euskirchen, S. Goswami, C. M. Iversen, J. Kattge, R. J. Norby, P. M. Van Bodegom, and X. Xu. 2014. Plant functional types in Earth system models: Past experiences and future directions for application of dynamic vegetation models in high-latitude ecosystems. Annals of Botany 114 (1):1–16. doi:10.1093/aob/mcu077.
- Yamazaki, D., D. Ikeshima, R. Tawatari, T. Yamaguchi, F. O’loughlin, J. C. Neal, C. C. Sampson, S. Kanae, and P. D. Bates. 2017. A high-accuracy map of global terrain elevations. Geophysical Research Letters 44 (11):5844–53. doi:10.1002/2017GL072874.
- Yukon Ecoregions Working Group. 2004. Ecoregions of the Yukon Territory: Biophysical properties of Yukon landscapes. PARC Technical Bulletin.
- Yukon Territorial Government. 2021. Yukon biophysical inventory system. Online data repository. Geomatics Yukon. https://apps.gov.yk.ca/yeis-biophys.
- Zhang, Z., S. Xu, C. Capinha, R. Weterings, and T. Gao. 2019. Using species distribution model to predict the impact of climate change on the potential distribution of Japanese whiting Sillago japonica. Ecological Indicators 104:333–40. doi:10.1016/j.ecolind.2019.05.023.