
ABSTRACT
Most ecological studies are by necessity cast on rather short timescales, such that documenting change in phenomena that occur slowly (e.g., over decades to centuries) is quite difficult. Here, we explore variation in and covariation of two sources of information to address rates of treeline change on one mountain face in the central Rocky Mountains: repeat photography and remote sensing. The repeat photography work involved assembling and quantitatively comparing four photographs that span 148 years. The remote sensing analyses covered a shorter period (35 years) but provided quantitative measurements and fuller landscape coverage. The repeat photography results demonstrated pronounced elevational advance of erect forest, at a rate <0.3 m/year during 1873–1979 but accelerating to >1.8 m/year during 2004–2020. The remote sensing analyses reflected similar processes but also reflected considerable infilling of tree cover near treeline; consequent increases in Normalized Difference Vegetation Index (NDVI) values in the upper forested areas may thus indicate treeline advance or changes in forest characteristics below treeline. Overall, these results document (1) acceleration in rise of treeline at this site in recent decades and (2) elevational compression of vegetation zones above treeline, with important implications for conservation of nonforested alpine ecosystems. Integrating multiple streams of evidence offers complementary views and insights in analyzing this phenomenon.
Introduction
Treelines are a rather spectacular ecological phenomenon, manifesting as a more or less abrupt transition between dense forest and open alpine vegetation over just a short lateral distance. The dramatic nature of alpine treelines has attracted considerable research attention over decades, and numerous possible determinants of treeline position have been identified (reviewed in Stevens and Fox Citation1991). More recently, treelines and associated alpine habitats have been noted as being of particular concern and interest in the face of anthropogenic climate change (Intergovernmental Panel on Climate Change Citation1992; Cudlín et al. Citation2017; Gatti et al. Citation2019; Davis et al. Citation2020).
In the Rocky Mountains of western North America, considerable research has focused on the nature of treeline change and its possible drivers. For example, dendroecological investigations at field sites spanning >600 km of the southern Rocky Mountains in Colorado and New Mexico revealed an overall pattern of abundant young trees above the limit of closed-canopy forest, suggesting an overall treeline rise driven by climate and mediated by slope and aspect (Elliott and Kipfmueller Citation2010). Related work has documented an important role of local conditions in filtering and amplifying climate forcing, particularly on seasonal timescales (Elliott Citation2011, Citation2012; Elliott and Cowell Citation2015), in controlling treeline position. Other studies have noted stability in the elevation of treeline, for instance, in Glacier National Park (Butler, Malanson, and Cairns Citation1994) and in parts of the Colorado Rockies (Ives and Hansen-Bristow Citation1983). This lack of an obvious upslope treeline advance was generally accompanied by changes in tree density and growth patterns in timberline forests, however (Klasner and Fagre Citation2002), suggesting that the trees were responding to warming climates. Collectively, this work underlines the complexity of how overall climate forcing is mediated by local conditions or other factors to control where and when new trees become established (Butler et al. Citation2007; Malanson et al. Citation2007).
A persistent challenge in studying treeline dynamics, however, has been the rather short-term duration of most field studies relative to the longer timescales over which treeline changes occur. This situation is by no means unique to treeline research; although some important exceptions exist, there is a growing realization that only longer-term studies are able to detect and characterize many important ecological phenomena (Lindenmayer et al. Citation2012). Because establishment and growth of new trees in previously unforested areas, a prerequisite for upward treeline migration, is a relatively slow process, treeline change is a particularly apt example of a topic that requires approaches capable of detecting, assessing, and characterizing changes over longer timescales.
Treeline phenomena have been studied indirectly through consideration of the demography and population biology of the trees growing at high elevations (e.g., Kullman Citation2007). Longer-term perspectives on treeline change have been provided by dendrochronological analyses of living trees near treeline and dead wood preserved at higher elevations (e.g., Nicolussi et al. Citation2005). Several analyses, however, have marshaled information held in the form of historical photographs to provide deeper time views of treeline phenomena (e.g., Butler and DeChano Citation2001; Klasner and Fagre Citation2002; Jacob et al. Citation2015; Munroe Citation2003; Jiménez-García et al. Citation2021). Other studies have used time series of space-based, remotely sensed imagery to analyze treeline migration over three or more decades (e.g., Zhang et al. Citation2009; Jiménez-García et al. Citation2021). These deeper time information sources, though not providing the demographic detail offered by population-level studies, have the potential to inform about longer-term effects that may not be discernable in shorter-term studies.
This study explores these two sources of information (repeat photography and remote sensing), and how they compare and contrast, to evaluate treeline dynamics over timescales of decades to centuries at a single site in the Rocky Mountains of Colorado. The collection of images on which we base our repeat photography analysis spans 148 years, beginning with an iconic photograph taken in 1873 by the pioneering photographer William Henry Jackson. We complemented that photograph with three photographs taken by various authors of this contribution from the 1970s to present. A complementary view is provided by 35 years of remotely sensed imagery from various Landsat satellites. We derive insights from each data source, which collectively point to interesting and important conservation lessons for the region.
Methods
The data utilized in this study come from two very different sources: land-based photography and satellite-based remote sensing. The two types of information were analyzed to detect and characterize treeline changes on the east face of the Mount of the Holy Cross in central Colorado. Combining the two types of data yielded broader and complementary insights: deeper time information from the photo series and quantitative detail from the satellite images.
Repeat photography
This study is based on a famous 24 August 1873 photograph taken by William Henry Jackson of the U.S. Government Survey (later the U.S. Geological Survey) led by Ferdinand Hayden (Chambers Citation1988). This photograph became well known because of the prominent cross shape on the east face of the mountain created by a snow-filled couloir and transecting cliff. Although the mountain likely already had a name given to it by Indigenous peoples, this feature led the Hayden Survey to name it the Mount of the Holy Cross. For the purposes of this study, however, the photograph shows a broad view across a valley, from the mountain’s peak at 4,270 m down to ~3,500 m, with an obvious treeline in the lower-right portion of the photograph. This photograph also offers the distinct advantage that the site from which Jackson took the photograph is well defined, with a stone hikers’ shelter being an important component of the Holy Cross National Monument, which was decreed in 1933 and decommissioned in 1950, for lack of public attention (Janiskee Citation2010).
The other important advantage of the Mount of the Holy Cross is that it was the subject of at least two previous repeat photography efforts, led by one of the coauthors of this contribution (M.K.). The Rephotographic Survey Project visited and photographed the identical scene in 1978 and 2000, with photos published in the Project’s Second View (Klett Citation1984) and Third Views (Klett and Bajakian Citation2004), respectively. Images from the Rephotographic Survey Project form the backbone of our repeat photography-based inferences. Finally, coauthor K.B. revisited the photopoint on 1 September 2021, capturing a fourth and most recent image. The set of photographs available to us therefore spans 148 years.
To compare the photographs quantitively, we used the 1873 Jackson photo as a base and georectified the other three images to it using the “georeferencer” tool in QGIS (v3.20.0; QGIS.org Citation2022), importing the images in an arbitrary projection related to the pixels in the 1873 photograph’s digital image. We chose suites of twelve to twenty control points, representing locations that were clearly identifiable in both the original and each later photograph. Georectification was achieved via a second-order polynomial. We inspected the residuals presented in the georeferencer page for marked positive outliers (i.e., high values compared to other points) to detect any points that were in poor correspondence between the two photographs and that therefore created strain in the georectification process.
Following the methodology of Roush, Munroe, and Fagre (Citation2007), with minor modifications noted below, we created a hexagonal fishnet, with cell width of twenty pixel units. This cell width corresponds to 1 to 3 m of elevation, depending on the slope of the area involved, and matches the approximate precision with which we felt that we could score the position of treeline in the different images. We overlaid the fishnet on each of the photographs and created a field in the attributes table of the fishnet shapefile for each of the four photographs with a value of 0 (no vegetation), 1 (herbaceous or shrub vegetation, or nonerect, krummholz tree vegetation), or 2 (erect forest, with more or less vertically oriented, upright trees); we distinguished between herbaceous/shrubby vegetation and erect forest simply because the latter is most easily recognizable in the historical photographs, whereas the former can be difficult to discren. Assignments of cells to these different classes were based on visual interpretation and ≥50 percent coverage of a hexagon by a particular cover type; these assignments were generally straightforward. A few sectors of the original Jackson photograph were uncertain, mainly as a consequence of shadows, corresponding to only 2 to 3 percent of the overall photo, and so were eliminated from analysis. Cell counts in terms of coverage and change between photographs supported simple visualizations of change.
We obtained a digital elevation model (DEM) at a spatial resolution of 1/3 in. (~10 m horizontally) from the U.S. Geological Survey (Citation2017). The DEM was used in tandem with the photos to reference elevations for treeline changes, as well as for visualization purposes, in the 3D Viewer module of QGIS. We used a fine-grained color ramp to discern elevations associated with the details of the topography so that we could associate features with specific elevations. Although the true precision of our elevational determinations was most likely on the order of 5 m of elevation, we report the elevations to the nearest 1 m, because that was the vertical resolution of the DEMs available. Further visualization and verification of our elevational scorings were achieved via Google Earth (Google Earth Citation2022).
Remote sensing
We selected images from the Landsat satellite (30-m resolution, extending across Landsat platforms 4–8) from the U.S. Geological Survey's Earth Explorer (Citation2022), aiming to span the years 1986 to 2020 for the tile corresponding to Mount of the Holy Cross (path 34, row 33). We sought images that were entirely cloud-free and that were taken in July to September, which led to elimination of most of the images available, in the interest of assuring high image quality. These criteria led to identification of four images that were appropriate for our study and that spanned the time period between the earliest good imagery available and the present: 6 August 1986, 13 September 2000, 21 August 2009, and 4 September 2020. These images were georeferenced to geographic coordinates (under the WGS84 standard) by the data provider using standardized protocols. The remote sensing imagery thus covered an interval of thirty-five years, a time interval that is available only with the Landsat series, which drove our choice of this particular remotely sensed data product: other remotely sensed data products (1) have coarser spatial resolution (e.g., MODIS, at 250-m resolution), (2) have coarser spectral resolution (e.g., VIIRS), and/or do not extend as far back into the past (e.g., PALSAR).
From the Landsat images, we used bands 5 and 4 for the 2020 image (Landsat 8) and bands 4 and 3 for the remaining (earlier) images, to represent near infrared (NIR) and red bands, respectively. We calculated the Normalized Difference Vegetation Index (NDVI; Rouse et al. Citation1974) as [(NIR − red)/(NIR + red)] for each of the images. We analyzed changes in NDVI within the viewscape of the 1873 Jackson photo and related those changes to elevations drawn from the DEM (see above). We identified a relevant elevational range as 3,475 to 3,800 m (i.e., the treeline is at ~3,550 m, so 3,800 m is well above the limit of vegetation; the local valley floor’s elevation falls within this interval) and fit linear regression models to the NDVI–elevation relationship for each time period. We used an analysis of covariance to test for changes in slopes of these regression lines for different images. We calculated x intercepts for each of the four elevational regressions as an approximation of a zero-vegetation elevation to explore elevational shifts in NDVI values that may or may not correspond to treeline-related phenomena.
Results
The four photographs () captured essentially the same view at four times over 148 years. The fishnet analysis identified a marked expansion of erect forest up the eastern face of the mountain (), representing ~94 m of elevational shift over the time period of the repeat photography study. The latter three photographs signaled elevational advances of 28 m (1873–1978), 27 m (1978–2000), and 39 m (2000–2021) between each consecutive pair of photos, which translates into 0.27, 1.23, and 1.86 m/year for the three time intervals ().
Table 1. Summary of elevational position of treeline along the eastern face of the Mount of the Holy Cross, Colorado, as revealed by detailed inspection of four photographs: from William Henry Jackson (photograph taken 1873), Second View (Klett Citation1984), Third Views (Klett and Bajakian Citation2004), and a 2021 photograph taken by Kevin Berthiaume.
Figure 1. Four images of the east face of the Mount of the Holy Cross in Colorado. The red arrow in the 1978 image indicates the area of treeline advance that is the focus of the analyses presented in the text. The 1873 image was taken by William Henry Jackson; the 1978 and 2000 images were from repeat photography efforts, the Second View and Third Views (Klett Citation1984; Klett and Bajakian Citation2004), respectively. The 2021 view was taken by Kevin Berthiaume. Note the area of active forest expansion in the lower right portion of the view.
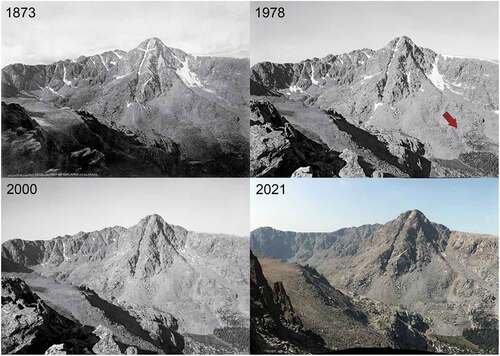
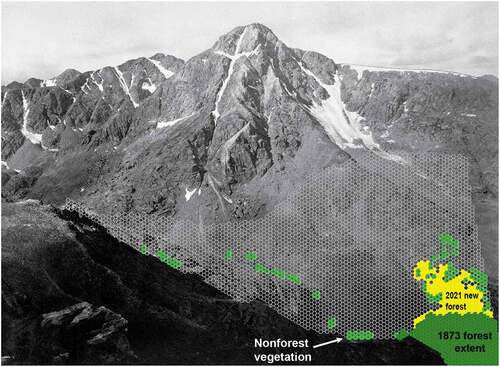
Figure 2. The 1873 William Henry Jackson photo of the east face of Mount of the Holy Cross (lightly cropped), with the hexagonal fishnet superimposed on the lower slopes. The 1873 extent of erect forest is shown in dark green, nonforest vegetation is shown in light green, and areas not covered by erect forest in 1873 but covered in erect forest by 2021 are illuminated in yellow.
The Landsat imagery showed an increasing mass of vegetation in the valley through time, particularly during the time interval between the 2000 and 2009 images (, top). Indeed, viewing the NDVI increase in the context of the topography of the valley, forest basically filled the valley basin over the course of the first decade of the twenty-first century (, bottom). Interestingly, slopes of the NDVI–elevation relationship differed among years (analysis of covariance, p < .0002); in Tukey’s post hoc tests, slopes of the NDVI–elevation relationships were significantly different (p < .05) among all pairwise comparisons of years, except for between the 2009 and 2020 regressions (p > .05). As such, the slope of the NDVI–elevation relationship was significantly elevated in the more recent time periods ().
Figure 3. Summary of vegetation mass change, as reflected in NDVI images calculated from Landsat images for 1986, 2000, 2009, and 2020. The top four panels show NDVI values in the valley separating the vantage point (top right of each panel) from the peak of the Mount of the Holy Cross (bottom left of each panel). The bottom panel shows the difference between the 2020 and 1986 images, with higher values shown as darker shades of purple; the latter is overlaid with partial transparency on the digital elevation model, which is shown as a gradient from gray to red.
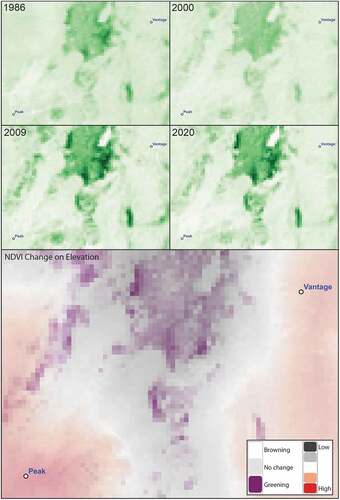
Figure 4. Summary of relationships between NDVI values and elevation (3,475–3,800 m) in the region shown in the panels of for four Landsat images. The 1986 relationship is shown as a green line and diamonds, 2000 is black dots and a line, 2009 is blue triangles and a broken line, and 2020 is red circles and a line.
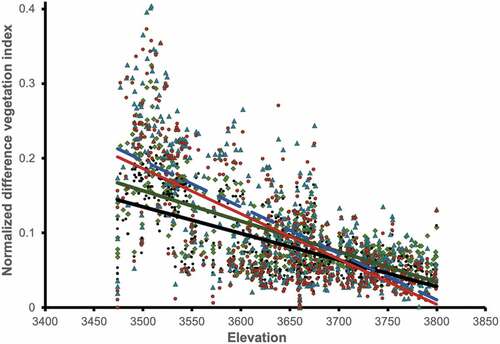
The linear regressions for the four time periods had slopes of −0.0004 for 1986 and 2000 and −0.0006 for 2009 and 2020 (). Taking 3,550 m as an approximate modern treeline for the study area and using the 1986 equation as a baseline yielded an overall rough estimate of treeline NDVI value of 0.1657. Solving for x when y = 0.1657 for the other three images yielded elevations of 3,040 m for 2000, 3,673 m for 2009, and 3,565 m for 2020 (); the 2000 elevation calculation is likely to be anomalous.
Table 2. Summary of relationships between NDVI values in four different images over the period 1986–2020.
Discussion
This analysis leverages two distinct data sources to provide perspectives on treeline dynamics on a scale of decades to centuries for one mountain face in the Rocky Mountains. These analyses are presented in detail to illustrate and explore a methodology that we are implementing more broadly across many mountains in the Rocky Mountain region (Peterson et al., in prep.), and worldwide via remote sensing data streams (Jiménez-García et al. Citation2021). Given the relative rarity of studies that unite multiple approaches (Treml et al. Citation2016; Jiménez-García et al. Citation2021), we saw utility in linking the two approaches in a single, detailed inspection of one landscape, with the goal of comparing and contrasting them. We aim to calibrate them against one another (at least coarsely and qualitatively) and understand the relative utility of the two approaches for particular questions.
Previous work at broader timescales (i.e., decades to centuries) has been possible only via repeat photography, remote sensing, or forest demography work involving dendrochronology (Shi et al. Citation2015). Other approaches provide additional detail regarding the natural history of the tree populations that comprise the upper limits of forested ecosystems (Lloyd and Fastie Citation2003; Smith et al. Citation2009). However, we note the long-term nature of treeline dynamics, with changes manifesting on timescales of 101 to 104 years or longer (Kullman and Kjällgren Citation2006). Even within regions, the timing of treeline changes appears to show interesting contrasts (e.g., Lloyd and Fastie Citation2003). As such, and in agreement with several other voices in this area (e.g., Dullinger, Dirnböck, and Grabherr Citation2004), we underline the importance of multiple streams of evidence in studies of treeline phenomena.
Integrating repeat photography and remote sensing: Lessons learned
Certainly, a central concern with the analyses using repeat photography and remote sensing that we have presented is the level of precision that is possible in calculations. For instance, in a Landsat scene, the horizontal pixel resolution is 30 m. If, as is common in montane areas such as on the slopes of the Mount of the Holy Cross, the slope is 30 percent, then one can expect as much as 9 m of difference between one edge and the opposite edge of the pixel. As a consequence, our interpretation of elevations as a function of remote sensing data sets will necessarily be limited to relatively coarse resolutions. A further complication may be the presence of light cloud cover and other problems with the remote sensing imagery, which may have compromised the 2000 image, for example, causing an anomalously low calculation of treeline.
Similarly, with repeat photography, such limitations also apply. Reconstructing the exact site from which a photograph was taken more than a century before is not straightforward (Munroe Citation2003), and in fact is at times impossible, owing to landscape changes (natural or anthropogenic; see several examples illustrated in Klett Citation1984; Klett and Bajakian Citation2004). Indeed, we experimented with using the many community-taken photographs available for the Mount of the Holy Cross as viewed from the historical shelter on the top of Notch Mountain, only 760 m from Jackson’s 1873 vantage point. The slight differences in elevation and angle of the view between the two views, however, made georectification impossible, underlining the importance of exact replication of the original view for use in such analyses (Klett Citation1984).
As such, both data streams are constrained in terms of the precision and accuracy that will be possible in terms of characterizing treeline elevations and characteristics. Such complications represent limitations on the magnitudes of changes that can be detected via each method but also point to the value of multiple independent data streams in reducing the uncertainty that would be associated with analysis of a single data stream. A further complication is that the remote sensing data may reflect changes not just at but rather also near treeline, such as infilling of trees in what was previously a sparse or diffuse treeline. This quality may be seen as positive or negative but must be weighed in interpreting any analyses of remote sensing vegetation index data.
Drivers of treeline shift
Certainly, one pitfall of studies of treeline dynamics in the context of climate change is the confusion of correlation with actual causation, a paradigm followed (perhaps of necessity) in many previous studies (Fang et al. Citation2009). We note, however, that numerous drivers beyond climate should be considered. For instance, treeline position and malleability can be shaped by geological history and structure (Butler et al. Citation2007); factors such as wild animal grazing activity, livestock grazing, fire frequency, and others can also affect treelines and their relative positions (Gehrig‐Fasel, Guisan, and Zimmermann Citation2007; Tremblay and Boudreau Citation2011; Schickhoff et al. Citation2015; Treml et al. Citation2016; Cudlín et al. Citation2017).
Particularly relevant to the results presented herein is consideration of the form of the treeline under consideration—treelines may take at least four forms (diffuse, abrupt, island, and krummholz; Harsch and Bader Citation2011). Of these possibilities, diffuse treelines are considered those most responsive to climate warming, whereas the other forms are relatively less responsive (Harsch and Bader Citation2011). Interestingly, the area under analysis in this article appears to have had a krummholz form in 1873, when Jackson took his photograph; this form is not expected to advance with climate warming as readily as others (Harsch et al. Citation2009; Schickhoff et al. Citation2015), and yet it has advanced upward in elevation on Holy Cross Mountain. We are not sure whether treeline would have advanced still more rapidly if the specific treeline were to be diffuse, for example; simply put, that insight will require more examples to be developed. Perhaps as future studies provide an ever-broader view of alpine treeline dynamics in diverse landscapes, better understanding of the tendency for different types of treelines to change at different rates on different types of landforms will be possible.
Climate change as a driver and rates of shift
Certainly, climate change in the form of warming temperatures (and other changes in local conditions) ought to affect treelines and associated vegetation characteristics. Indeed, several studies have assumed that correlations of weather features with key population parameters can allow researchers to parameterize detailed models (e.g., Kullman Citation2007). Indeed, globally, after 1900, treeline advance has been dominant, occurring at a frequency perhaps fifty-fold more frequently than treeline recession, often associated with stronger winter warming (Harsch et al. Citation2009).
The rate at which treelines are advancing has been measured at a variety of sites but appears to range from 0 to 2 m/year (Davis et al. Citation2020); a very limited number of studies suggests that these rates may be increasing, ostensibly as a consequence of some dimension of accelerated climate change (Jiménez-García et al. Citation2021). On the other hand, some predictive studies have anticipated considerably faster rates of treeline advance (Moen et al. Citation2004). Furthermore, different tree species may advance upward in elevation at different rates; for instance, Gaire et al. (Citation2014) documented one tree species advancing at >2.6 m/year, in contrast with another species on the same landscapes that was not advancing at all. One important step in linking results between different lines of evidence will be to understand the relationships between the shifts in vegetation mass documented via vegetation indices and shifts documented in terms of actual tree positions; the latter has challenges with defining an actual edge (particularly in situations of diffuse treeline forms), whereas the other can conflate infilling in areas of sparse forest with actual elevational advance of treeline.
The usual supposition is that growing season temperatures are driving treeline advance (Harsch and Bader Citation2011), which is logical in view of the extreme conditions that are generally manifested at those elevations. However, other dimensions of climate, such as precipitation, wind, rime ice, or frequency of summer freezing temperatures, may also play roles (Kimball, Weihrauch, and Murray Citation2021), as well as grazing activities—this latter influence can be discarded because the mountain in question falls in a wilderness area. At present, we see no way to tease apart the different effects of these additional factors, particularly in view of the general absence of climate stations at treeline in key areas. We are in the process of expanding the analysis presented herein to include many treelines across the central Rocky Mountains region, which should reflect on the generality of the conclusions presented herein.
Implications for biodiversity conservation
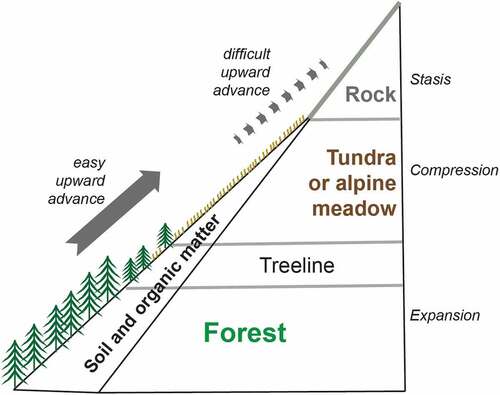
This study joins a number of others in detecting and highlighting a serious conservation concern as alpine meadows and grasslands are overtaken by elevational advance of forest ecosystems (Baker and Moseley Citation2007; Gatti et al. Citation2019). We have highlighted the upward mobility of forests in montane regions, with treelines advancing almost universally in recent decades (Harsch et al. Citation2009; Smith et al. Citation2009; Cudlín et al. Citation2017). Upward mobility of treelines is often much faster than that of grassy or herbaceous vegetation (“grassline”), because the latter limit is often set by bare rock, ice, or talus. As such, as illustrated in , vegetation types that exist above treeline (i.e., tundra, alpine meadow, paramo, etc.) may be compressed between forest advancing from below and bare rock above that resists or brakes upward advance of vegetated zones.
Figure 5. Diagram of treeline environments showing forest, tundra, or alpine meadows and bare rock at highest elevations. Note that soils become increasingly shallow and sterile at higher elevations, often ending in bare rock or talus slopes. For this reason, although forest is able to invade upward into tundra or meadows, the tundra/meadow habitat is unlikely to be able to invade upward, for lack of organic soils.
In the Rocky Mountains region, the focus of this study, this situation places a number of habitat-restricted species under threat. Birds of alpine meadows are particularly vulnerable, including rosy-finches (Leucosticte spp.) and ptarmigan (Lagopus spp.). Many species in other taxa (e.g., small mammals, butterflies, plants) would be in similar peril. Thus, perhaps more research attention should be paid to the causes and drivers of grassline changes as a complement to the intense research attention that is paid to treelines.
Acknowledgement
We thank Marlon Cobos for assistance with some of the statistical tests reported herein.
Disclosure statement
No potential conflict of interest was reported by the authors.
Additional information
Funding
References
- Baker, B. B., and R. K. Moseley. 2007. Advancing treeline and retreating glaciers: Implications for conservation in Yunnan, PR China. Arctic, Antarctic, and Alpine Research 39 (2):200–09. doi:10.1657/1523-0430(2007)39[200:ATARGI]2.0.CO;2.
- Butler, D. R., and L. M. DeChano. 2001. Environmental change in Glacier National Park, Montana: An assessment through repeat photography from fire lookouts. Physical Geography 22 (4):291–304. doi:10.1080/02723646.2001.10642744.
- Butler, D. R., G. P. Malanson, and D. M. Cairns. 1994. Stability of alpine treeline in Glacier National Park: Montana, USA. Phytocoenologia 22 (4):485–500. doi:10.1127/phyto/22/1994/485.
- Butler, D. R., G. P. Malanson, S. J. Walsh, and D. B. Fagre. 2007. Influences of geomorphology and geology on alpine treeline in the American West—More important than climatic influences? Physical Geography 28 (5):434–50. doi:10.2747/0272-3646.28.5.434.
- Chambers, F. 1988. Hayden and His. Men: Francis Paul Geoscience.
- Cudlín, P., M. Klopčič, R. Tognetti, F. Máli, C. L. Alados, P. Bebi, K. Grunewald, M. Zhiyanski, V. Andonowski, and N. La Porta. 2017. Drivers of treeline shift in different European mountains. Climate Research 73 (1–2):135–50. doi:10.3354/cr01465.
- Davis, E. L., R. Brown, L. Daniels, T. Kavanagh, and Z. E. Gedalof. 2020. Regional variability in the response of alpine treelines to climate change. Climatic Change 162 (3):1365–84. doi:10.1007/s10584-020-02743-0.
- Dullinger, S., T. Dirnböck, and G. Grabherr. 2004. Modelling climate change‐driven treeline shifts: Relative effects of temperature increase, dispersal and invasibility. Journal of Ecology 92 (2):241–52. doi:10.1111/j.0022-0477.2004.00872.x.
- Elliott, G. P. 2011. Influences of 20th-century warming at the upper tree line contingent on local-scale interactions: Evidence from a latitudinal gradient in the Rocky Mountains, USA. Global Ecology and Biogeography 20 (1):46–57. doi:10.1111/j.1466-8238.2010.00588.x.
- Elliott, G. P. 2012. Extrinsic regime shifts drive abrupt changes in regeneration dynamics at upper treeline in the Rocky Mountains, USA. Ecology 93 (7):1614–25. doi:10.1890/11-1220.1.
- Elliott, G. P., and C. M. Cowell. 2015. Slope aspect mediates fine-scale tree establishment patterns at upper treeline during wet and dry periods of the 20th century. Arctic, Antarctic, and Alpine Research 47 (4):681–92. doi:10.1657/AAAR0014-025.
- Elliott, G. P., and K. F. Kipfmueller. 2010. Multi-scale influences of slope aspect and spatial pattern on ecotonal dynamics at upper treeline in the southern Rocky Mountains, USA. Arctic, Antarctic, and Alpine Research 42 (1):45–56. doi:10.1657/1938-4246-42.1.45.
- Fang, K., X. Gou, F. Chen, J. Peng, R. D’Arrigo, W. Wright, and M.-H. Li. 2009. Response of regional tree-line forests to climate change: Evidence from the northeastern Tibetan Plateau. Trees 23 (6):1321–29. doi:10.1007/s00468-009-0373-5.
- Gaire, N. P., M. Koirala, D. R. Bhuju, and H. P. Borgaonkar. 2014. Treeline dynamics with climate change at the central Nepal Himalaya. Climate of the Past 10 (4):1277–90. doi:10.5194/cp-10-1277-2014.
- Gatti, R. C., T. Callaghan, A. Velichevskaya, A. Dudko, L. Fabbio, G. Battipaglia, and J. Liang. 2019. Accelerating upward treeline shift in the Altai Mountains under last-century climate change. Scientific Reports 9 (1):1–13. doi:10.1038/s41598-018-37186-2.
- Gehrig‐Fasel, J., A. Guisan, and N. E. Zimmermann. 2007. Tree line shifts in the Swiss Alps: Climate change or land abandonment? Journal of Vegetation Science 18 (4):571–82. doi:10.1111/j.1654-1103.2007.tb02571.x.
- Google Earth. 2022. Google Earth; http://www.google.com/earth/index.html.
- Harsch, M. A., and M. Y. Bader. 2011. Treeline form–A potential key to understanding treeline dynamics. Global Ecology and Biogeography 20 (4):582–96. doi:10.1111/j.1466-8238.2010.00622.x.
- Harsch, M. A., P. E. Hulme, M. S. McGlone, and R. P. Duncan. 2009. Are treelines advancing? A global meta‐analysis of treeline response to climate warming. Ecology Letters 12 (10):1040–49. doi:10.1111/j.1461-0248.2009.01355.x.
- Intergovernmental Panel on Climate Change. 1992. First assessment report overview and policymaker summaries. Intergovernmental Panel on Climate Change.
- Ives, J. D., and K. J. Hansen-Bristow. 1983. Stability and instability of natural and modified upper timberline landscapes in the Colorado Rocky Mountains, USA. Mountain Research and Development 3 (2):149–55. doi:10.2307/3672996.
- Jacob, M., A. Frankl, H. Beeckman, G. Mesfin, M. Hendrickx, E. Guyassa, and J. Nyssen. 2015. North Ethiopian Afro‐alpine tree line dynamics and forest‐cover change since the early 20th century. Land Degradation and Development 26 (7):654–64. doi:10.1002/ldr.2320.
- Janiskee, R. 2010. Pruning the parks: Holy Cross National Monument (1933-1950). https://www.nationalparkstraveler.org/2010/12/pruning-parks-holy-cross-national-monument-1933-19507354.
- Jiménez-García, D., X. Li, A. Lira-Noriega, and A. T. Peterson. 2021. Upward shifts in elevational limits of forest and grassland for Mexican volcanoes over three decades. Biotropica 53 (3):798–807. doi:10.1111/btp.12942.
- Kimball, K. D., D. M. Weihrauch, and G. L. D. Murray. 2021. Understanding northeastern US alpine mountains: Context, causal agents of treeline, and meteorology to approximate their response to climate change. Northeastern Naturalist 28 (sp11):83–107. doi:10.1656/045.028.s1106.
- Klasner, F. L., and D. B. Fagre. 2002. A half century of change in alpine treeline patterns at Glacier National Park, Montana, USA. Arctic, Antarctic, and Alpine Research 34 (1):49–56. https://doi.org/10.2307/1552508
- Klett, M. 1984. Second view: The rephotographic survey project. Albuquerque: University of New Mexico Press.
- Klett, M., and K. Bajakian. 2004. Third views, second sights: A rephotographic survey of the American West volume 1. Albuquerque: Museum of New Mexico Press.
- Kullman, L. 2007. Tree line population monitoring of Pinus sylvestris in the Swedish Scandes, 1973–2005: Implications for tree line theory and climate change ecology. Journal of Ecology 95 (1):41–52. doi:10.1111/j.1365-2745.2006.01190.x.
- Kullman, L., and L. Kjällgren. 2006. Holocene pine tree‐line evolution in the Swedish Scandes: Recent tree‐line rise and climate change in a long‐term perspective. Boreas 35 (1):159–68. doi:10.1080/03009480500359137.
- Lindenmayer, D. B., G. E. Likens, A. Andersen, D. Bowman, C. M. Bull, E. Burns, C. R. Dickman, A. A. Hoffmann, D. A. Keith, and M. J. Liddell. 2012. Value of long‐term ecological studies. Austral Ecology 37 (7):745–57. doi:10.1111/j.1442-9993.2011.02351.x.
- Lloyd, A. H., and C. L. Fastie. 2003. Recent changes in treeline forest distribution and structure in interior Alaska. Ecoscience 10 (2):176–85. doi:10.1080/11956860.2003.11682765.
- Malanson, G. P., D. R. Butler, D. B. Fagre, S. J. Walsh, D. F. Tomback, L. D. Daniels, L. M. Resler, W. K. Smith, D. J. Weiss, D. L. Peterson, et al. 2007. Alpine treeline of western North America: Linking organism-to-landscape dynamics. Physical Geography 28 (5):378–96. doi:10.2747/0272-3646.28.5.378.
- Moen, J., K. Aune, L. Edenius, and A. Angerbjörn. 2004. Potential effects of climate change on treeline position in the Swedish mountains. Ecology and Society 9:16.
- Munroe, J. S. 2003. Estimates of Little Ice Age climate inferred through historical rephotography, northern Uinta Mountains, USA. Arctic, Antarctic, and Alpine Research 35 (4):489–98. doi:10.1657/1523-0430(2003)035[0489:EOLIAC]2.0.CO;2.
- Nicolussi, K., M. Kaufmann, G. Patzelt, and A. Thurner. 2005. Holocene tree-line variability in the Kauner Valley, Central Eastern Alps, indicated by dendrochronological analysis of living trees and subfossil logs. Vegetation History and Archaeobotany 14 (3):221–34. doi:10.1007/s00334-005-0013-y.
- QGIS.org. 2022. QGIS Geographic Information System. QGIS Association. http://www.qgis.org.
- Rouse, J. W., R. H. Haas, J. A. Scheel, and D. W. Deering. 1974. Monitoring vegetation systems in the Great Plains with ERTS. Proceedings, 3rd Earth Resource Technology Satellite (ERTS) Symposium, Washington, DC. 48–62. https://ntrs.nasa.gov/citations/19740022614.
- Roush, W., J. S. Munroe, and D. B. Fagre. 2007. Development of a spatial analysis method using ground-based repeat photography to detect changes in the alpine treeline ecotone, Glacier National Park, Montana, USA. Arctic, Antarctic, and Alpine Research 39 (2):297–308. doi:10.1657/1523-0430(2007)39[297:DOASAM]2.0.CO;2.
- Schickhoff, U., M. Bobrowski, J. Böhner, B. Bürzle, R. P. Chaudhary, L. Gerlitz, H. Heyken, J. Lange, M. Müller, and T. Scholten. 2015. Do Himalayan treelines respond to recent climate change? An evaluation of sensitivity indicators. Earth System Dynamics 6 (1):245–65. doi:10.5194/esd-6-245-2015.
- Shi, C., V. Masson-Delmotte, V. Daux, Z. Li, M. Carré, and J. C. Moore. 2015. Unprecedented recent warming rate and temperature variability over the east Tibetan Plateau inferred from Alpine treeline dendrochronology. Climate Dynamics 45 (5–6):1367–80. doi:10.1007/s00382-014-2386-z.
- Smith, W. K., M. J. Germino, D. M. Johnson, and K. Reinhardt. 2009. The altitude of alpine treeline: A bellwether of climate change effects. Botanical Review 75 (2):163–90. doi:10.1007/s12229-009-9030-3.
- Stevens, G. C., and J. F. Fox. 1991. The causes of treeline. Annual Review of Ecology and Systematics 22 (1):177–91. doi:10.1146/annurev.es.22.110191.001141.
- Tremblay, G. D., and S. Boudreau. 2011. Black spruce regeneration at the treeline ecotone: Synergistic impacts of climate change and caribou activity. Canadian Journal of Forest Research 41 (3):460–68. doi:10.1139/X10-183.
- Treml, V., M. Šenfeldr, T. Chuman, T. Ponocná, and K. Demková. 2016. Twentieth century treeline ecotone advance in the Sudetes Mountains (Central Europe) was induced by agricultural land abandonment rather than climate change. Journal of Vegetation Science 27 (6):1209–21. doi:10.1111/jvs.12448.
- U.S. Geological Survey. 2017. 1/3rd arc-second Digital Elevation Models (DEMs), USGS National Map 3DEP downloadable data collection. Washington, DC: U.S. Geological Survey. https://www.sciencebase.gov/catalog/item/4f70aa9fe4b058caae3f8de5.
- U.S. Geological Survey Earth Explorer. 2022. Earth Explorer; https://earthexplorer.usgs.gov/.
- Zhang, Y., M. Xu, J. Adams, and X. Wang. 2009. Can Landsat imagery detect tree line dynamics? International Journal of Remote Sensing 30 (5):1327–40. doi:10.1080/01431160802509009.