
ABSTRACT
The Arctic is experiencing the greatest increase in average surface temperature globally, which is projected to amplify wildfire frequency and severity. Wildfire alters the biogeochemical characteristics of arctic ecosystems. However, the extent of these changes over time—particularly with regard to plant stoichiometries relative to community structure—is not well documented. Four years after the Yukon-Kuskokwim Delta, Alaska, experienced its largest fire season, aboveground plant and lichen biomass was harvested across a gradient of burn history: unburned (“reference”), 2015 burn (“recent burn”), and 1972 burn (“historic burn”) to assess the resilience of tundra plant communities to fire disturbance. Fire reduced aboveground biomass in the recent burn; early recovery was characterized by evergreen shrub and graminoid dominance. In the historic burn, aboveground biomass approached reference conditions despite a sustained reduction of lichen biomass. Although total plant and lichen carbon (C) and nitrogen (N) were reduced immediately following fire, N stocks recovered to a greater degree—reducing community-level C:N. Notably, at the species level, N enrichment was observed only in the recent burn. Yet, community restructuring persisted for decades following fire, reflecting a sustained reduction in N-poor lichens relative to more N-rich vascular plant species.
KEYWORDS:
Introduction
The Arctic is experiencing the most dynamic increase of average surface temperature, warming at least twice as fast as the rest of the Earth’s mass (Taylor et al. Citation2017). The resultant increasingly warm and dry conditions, greater lightning frequency, decrease in terrestrial snow cover, and expansion of woody biomass (Higuera et al. Citation2008; Farukh and Hayasaka Citation2012; French et al. Citation2015; Hu et al. Citation2015; Salmon et al. Citation2016; Taylor et al. Citation2017) are now making the tundra more susceptible to fire (Higuera et al. Citation2008; Hu et al. Citation2015; Young et al. Citation2017). The longer-term effects of these fires on plant and lichen community structure and stoichiometry—and thus their resistance and resilience to fire—remain relatively underexplored (Frost et al. Citation2020; Talucci, Loranty, and Alexander Citation2022).
Fire can affect the plant community through its effects on plant-available soil nutrient pools. By removing the insulating soil organic matter (SOM) and thus increasing transfer of energy, fire exposes the active layer to ambient air temperature and reduces surface albedo (Hu et al. Citation2015; Taylor et al. Citation2017). As a result, burned soils can develop warmer and deeper active layer decades following fire (Bret-Harte et al. Citation2013; Hu et al. Citation2015; Taylor et al. Citation2017). This may increase plant-available nutrient pools as more nutrients are mineralized and roots extend into newly thawed, warmer soils (Hewitt et al. Citation2019; Abbott et al. Citation2021). The combustion of tundra litter and SOM combined with warming can also release plant-available nutrients (Mack et al. Citation2011; Bret-Harte et al. Citation2013; Jiang et al. Citation2015). Because tundra’s primary productivity is typically strongly nitrogen (N)-limited (Mark et al. Citation2004), increased nutrient availability can enhance net primary productivity by those species able to take advantage of these pools (Dijkstra and Adams Citation2015; Jiang et al. Citation2015). This fire-driven increase in nutrient availability can enhance primary productivity for decades; for example, graminoids often dominate in the short term during tundra recovery from fire, whereas shrub expansion has been observed to occur years to multiple decades after fire (Racine et al. Citation2004; Bret-Harte et al. Citation2013; Jones et al. Citation2013; Tsuyuzaki, Iwahana, and Saito Citation2018; Gaglioti et al. Citation2021; Heim, Yurtaev et al. Citation2021).
Fire and ecosystem recovery following this disturbance can alter ecosystem stoichiometry, or the balance of carbon (C), nitrogen (N), phosphorus (P), and trace elements in biomass and soils. Stoichiometric flexibility can impact ecological stoichiometry and ecosystem function, such as the potential of photosynthetic rates and growth rates (Sistla et al. Citation2015). Shifting fire regimes can significantly alter ecosystem C-N-P stoichiometries, with recent and repeated fire events reducing N content and increasing P richness in both soil and plant mass (Toberman et al. Citation2014; Butler et al. Citation2018), and increasing fire frequency can alter these patterns over time (Pellegrini et al. Citation2018; Butler et al. Citation2019). Although N and P may co-limit plant growth at the community level following fire (Klupar, Rocha, and Rastetter Citation2021), documentation of postfire succession plant stoichiometries across scales from plant organ to species to community level remains sparse, particularly in arctic tundra (Sistla and Schimel Citation2012; Jiang et al. Citation2017; Butler et al. Citation2019).
The Yukon-Kuskokwim Delta (YKD), Alaska, is of particular interest because it is among the most biologically productive regions of the arctic tundra, and the effects of increased fire frequency and severity are already visible (; Sae-Lim et al. [Citation2019], Frost et al. [Citation2020], and references therein). Despite being dominated by wetland tundra, upland areas of the YKD have experienced multiple wildfires since 1953 (Frost et al. Citation2020). During the historically unprecedented fire season of 2015, 726 km2 tundra burned in the YKD, doubling the total area that had burned over the past seventy-four years (Partain et al. Citation2016). Notably, YKD’s vegetation is dominated by lichens underlain by moss rather than litter-rich tussocks and woody shrubs, as is common in other Alaskan tundra that have been impacted by fires (Higuera et al. Citation2008; Jones et al. Citation2013; Jiang et al. Citation2017). Plant functional diversity largely recovered within several decades following fire in lowland tundra, and bryophytes were largely resistant to burning (Frost et al. Citation2020). However, lichen biomass recovered little for at least four decades following fires (with near complete loss immediately following fire; Frost et al. Citation2020). By contrast, shrub and graminoid abundance increased within two to ten years following fire (Frost et al. Citation2020; Heim, Bucharova et al. Citation2021).
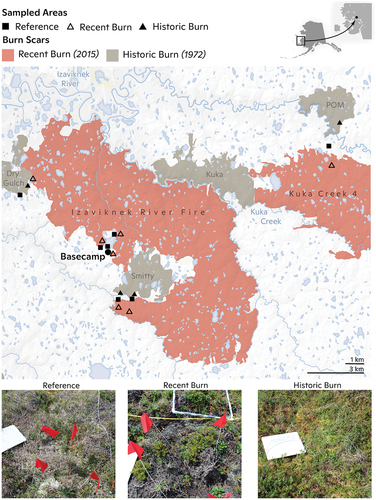
Figure 1. Map of burn history and sampled areas in the Yukon-Kuskokwim Delta (YKD) of Alaska. The bottom panel includes photos of plots sampled in reference, recent burn, and historic burn areas. Map created by Carl Churchill.
Our goal was to assess the resilience, following immediate and multidecadal fire, on plant and lichen community– and species-level stoichiometries and nutrient pools in the YKD relative to changes in the distribution of aboveground biomass. We defined resilience as the ability for the ecosystem to absorb disturbance while maintaining ecological function (Holling Citation1973). We established sites that included nonburned tundra (“reference”), 2015 burn scar, and 1972 burn scar areas to examine the potential short- and longer-term impacts of fire on C:N and C:P of the tundra plant and lichen community at the levels of aboveground biomass, plant functional type (PFT), species, and organ. We hypothesized that total aboveground plant and lichen biomass would be reduced four years following fire but deciduous and evergreen shrubs, whose stems and rhizomes can store excess nutrients, would become more nutrient-enriched because of the residual available nutrients postburning, as seen by Bret-Harte et al. (Citation2013) and Narita et al. (Citation2015) in northern Alaskan tussock tundra. We further hypothesized that the plant community would recover to baseline biomass levels and stoichiometries within four decades following the burn and those species that show N and P enrichment immediately following fire would have the greatest increase in biomass relative to species that were not able to take advantage of postfire nutrient release.
Methods
Site description
In July 2018 and July 2019, we sampled a series of sampling locations near a field camp site established at 61.2628°, −163.2459° in the Yukon Delta National Wildlife Refuge () within two separate burn scars (2015 and 1972). The site is defined by peat tundra with vegetation characterized by mosses (primarily Sphagnum spp. and Dicranum spp.), lichen, graminoids (primarily Carex spp. and Eriophorum angustifolium), forbs (mainly Rubus chamaemorus), deciduous shrubs (dominated by Vaccinium uliginosum and Betula nana), and evergreen shrubs (primarily Rhododendron subarcticum and Vaccinium vitis-idaea). The thaw depth was generally <50 cm on peat plateaus during the sampling period, which is underlain by discontinuous permafrost. The mean annual temperature is −1.25°C ± 1.42°C (mean ± standard deviation), and the mean annual precipitation is 450 ± 123 mm, based on historical weather data (1929–2018) from the Bethel Airport Station (60.785°, −161.8293°), located approximately 94 km southwest of the field site.
Experimental design
Sampling occurred at seven peat plateau sampling locations within a 15-km radius (; ). To assess the short- and long-term impacts of fire, we used burn scars from 2015 (“recent burn”) and burn scars from 1972 (“historic burn”), respectively, with nonburned areas (i.e., areas with no known burns during the historical record) as our reference. All reference areas were on peat plateaus where fire often stopped at riparian boundaries. Burn age was determined using Alaska Fire Service databases (Alaska Interagency Coordination Center Citationn.d.). The sampling locations were selected based on their accessibility from base camp and the presence of reference unburned areas of peat plateau in the vicinity of burned areas in the two age classes. Sampling was completed from 1 to 10 July in 2018 and from 30 June to 10 July in 2019.
Table 1. Location and treatments for plots sampled for this study.
In 2018, three of the four sampling locations had a paired design of reference and recent burn areas, and one sampling location included a reference, recent burn, and historic burn area. In 2019, three additional sampling locations were established with reference, recent burn, and historic burn areas. At each of the eighteen sites (seven reference, seven recent burn, four historic burn), we established a 30 × 30 cm sample plot by locating a representative area in the sampling location and spaced each additional sample area 10 m apart from each other (N = 3 sample plots/site; ). From each plot, a 30-m transect was run, where thaw depth was measured at 1-m intervals in 2018 and 2-m intervals in 2019. We could not accurately measure the thaw depth that exceeded 1 m, so for 40 (of 1,688) measurements where thaw exceeded 1 m, a conservative estimate of 101 cm depth was used for estimating thaw depth during the sampling period.
Aboveground biomass harvest
All aboveground live vascular plant and lichen material within the 900 cm2 plot was collected at ground level and separated into species (forbs, deciduous, and evergreen shrubs) or genera when possible (moss). Each vascular plant was further separated into leaves, stems, flowers, and berries. All biomass was dried to constant mass at 60°C for at least 48 hours before being weighed. A scalar of 0.703 was applied to the 2018 Sphagnum biomass to correct for dead biomass that was included in the harvest. This scalar was created in 2019 by collecting Sphagnum from one plot (selected as a representative plot) in the same manner as 2018. Then the biomass was split into dead and live biomass and used to calculate the live:total Sphagnum scalar. We defined dead Sphagnum as brown or discolored and changed in texture.
Nutrient analyses
Species (separated by organ when appropriate) from each plot were ground and homogenized in coffee grinders for elemental analysis. Percentage C and N were measured on all samples using a LECO elemental analyzer (Woodwell Climate Research Center Environmental Chemistry Laboratory, Falmouth, MA) or with an Elementar vario MACRO cube (California Polytechnic State University, San Luis Obispo, CA). Carbon and N biomass pools were calculated by multiplying mass of each species part by the measured %C or %N of that species part. Total community %C and %N were calculated by dividing the sum of all C or N biomass pools for all species parts by the total community biomass. %P was measured through an acid wet digestion in a block digester at University of Massachusetts Plant Diagnostic Laboratory (Amherst, MA); only a small proportion of vascular plant species could be analyzed for P because of insufficient biomass remaining after completing C:N analysis. Therefore, P pool sizes could not be determined for most vascular species. %P was quantified in samples representing the majority of lichen (median = 100 percent, range = 50–100 percent) and moss (median = 98 percent, range = 56–100 percent) biomass at the plot level. As such, we corrected P stock directly measured for a functional type in a given plot by the fraction of functional type biomass represented in %P measurements for these two groups to give total plot level P stock.
Data analysis
All statistical modeling was completed in R Studio v1.4.1717 using R v3.5.1 (R Core Team Citation2018). A factorial mixed-model analysis of variance was used to identify the effect of burn recovery period on thaw depth, plant community biomass (including lichen), PFT biomass, and organ %C, %N, and C/N. Sample years (2018 and 2019) were pooled; thus, year was not included as an independent factor. Burn status was treated as a fixed effect, and plot nested within sampling location was treated as a random effect using nlme v3.1–153 (Pinheiro et al. Citation2021). To test the effect of time since fire on thaw depth, transect ID was also included as a random effect. Due to the limited sample size of the P data, sampling location was not included as a random effect. Instead, burn status was treated as a fixed effect. The effects of burn were assessed with estimated marginal means (emmeans v1.6.1; Lenth Citation2021) and a Tukey correction to control for multiple comparisons across burn status.
Biomass was transformed using y = log(x + 1) transformation prior to analysis (Bret-Harte et al. Citation2013) and reported as arithmetic means. Stoichiometric ratios were transformed using y = log(x) and reported as geometric means (Isles Citation2020). If the species was absent from a particular plot, its biomass and nutrient stock value was zero. All of the data are publicly available via the Arctic Data Center (2018 data and 2019 data; Hung et al. Citation2022).
To evaluate whether changes in community N stocks were driven primarily by plant and lichen community turnover or stoichiometric flexibility, we summed the product of relative biomass of each species and its %N under reference and burned conditions. Relative biomasses observed under reference conditions multiplied by %N under burned conditions simulates a scenario of stoichiometric change in the absence of community turnover, and relative biomass observed under burned conditions multiplied by %N under reference conditions simulates a scenario of community change in the absence of species-level stoichiometric flexibility. These values were calculated on a per species level using the mean biomass and mean %N per species; they are reported as relative changes compared to the same calculation completed for unburned reference plots within the same sampling location. By using relative biomass of community members rather than absolute biomass, this approach allows us to consider how changes in community composition and stoichiometry act on N stocks independent of changes in aboveground biomass following burning.
Results
Thaw depth
The July thaw depth for reference was 40.16 ± 0.56 cm (mean ± SE), for recent burn it was 47.91 ± 0.71 cm, and for historic burn it was 41.53 ± 0.94 cm. Burn increased July thaw depth (F (2, 8) = 20.70, p < .0001), which was driven by an increase in average July thaw depth of 19.75 percent (p = .002) in the recent burn compared to the reference. However, July thaw depth had recovered to reference depth in the historic burn areas.
Aboveground biomass
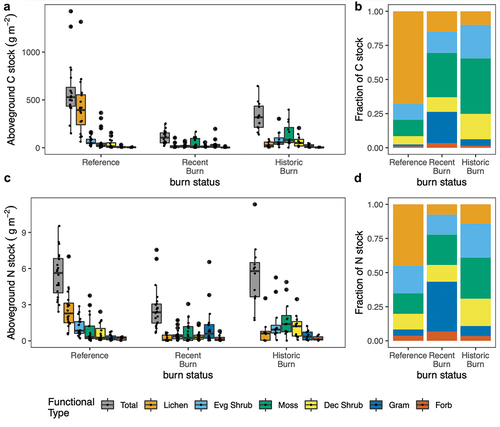
Both total biomass and species composition were highly heterogeneous across the studied landscape (; Supplementary Figure S1). Burning reduced total biomass (F (2, 9) = 24.71, p < .0001), with the greatest effect in the recent burn (77 percent reduction from reference, p = .0002), whereas in the historic burn, biomass was statistically indistinguishable from the reference level (% reduction from reference; driven by nonstatistically significant increases in deciduous shrub, evergreen shrub, graminoid, and moss PFT biomass compared to recent burn). The effects on biomass within different plant functional types varied (), with no significant effect of fire observed for deciduous shrubs, forbs, moss, or graminoids. Lichen, in contrast, showed no recovery of biomass in either the recent burn (96 percent reduction relative to reference, p < .0001) or historic burn (94 percent reduction relative to reference, p = .0007). Reflecting this biomass shift, lichen is 67 percent (range = 21–97 percent) of total community biomass and C pool in the reference areas but only 9 to 10 percent (range = 0–70 percent) in the recent and historic burns (). Furthermore, lichen was not found in four of twelve historic burn plots and ten of twenty-two recent burn plots, but it was recorded in all nonburned reference plots. Evergreen shrub biomass was significantly reduced (65 percent reduction relative to reference, p = .003) in the recent burn, but the biomass recovered to reference conditions in the historic burn. This reduction in biomass was reflected in both evergreen shrub leaves (59 percent reduction relative to reference, p = .004) and evergreen shrub stems (71 percent reduction relative to reference, p = .001; ).
Table 2. Community level, functional type level, and key shrub species mean ± SE for biomass and C and N.
Figure 2. (a) Absolute and (b) mean relative within-treatment C stocks (or biomass) for each functional type and (c) absolute and (d) mean relative within-treatment N stocks. Points overlaid on box plots in (a) and (c) indicate the total C or N stock for a functional type in a single replicate plot. Box plot boundaries denote quartiles and medians, and whiskers denote 1.5 * interquartile range. The corresponding significance of differences between burn treatments can be found in .
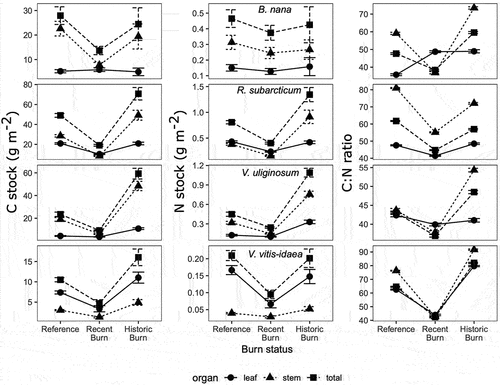
At the organ level, leaf:stem biomass increased in R. subarcticum (99 percent increase, p = .04) and V. uliginosum (128 percent increase, p = .04) in the recent burn compared to the reference. For R. subarcticum, this effect was driven by a greater reduction in leaf biomass (50 percent reduction, p = .01) and stem biomass (70 percent reduction, p = .003). No other significant shifts in leaf:stem biomass were observed for any species or functional type.
Total, functional type, and key species %C, %N, %P
Fire did not significantly affect %C at the whole community or PFT level. However, fire increased %N of the whole community (F (2, 9) = 29.72, p < .0001), with the effect greatest in the recent burn (178 percent increase, p = .0001) and lesser magnitude in the historic burn (97 percent increase, p = .05). The increase in %N can be attributed to both a decrease in the relative abundance of N-poor lichens and an increase in the %N of evergreen shrubs. Mosses and evergreen shrubs were the only functional types with a detectable %N response to fire driven by an increase of %N in the recent burn. %N of mosses increased by 59 percent in the recent burn compared to the reference (p = .03), and evergreen shrub %N increased 37 percent in the recent burn compared to the reference (p = .01). This effect was driven by higher %N in R. subarcticum (and a nonsignificant increase in V. vitis-idaea %N) in the recent burn areas. The increase in R. subarcticum N concentration is associated with an approximately equivalent relative decrease in C:N ratio of leaves and stems (~25 percent) and a preferential loss of more N-poor stem (70 percent reduction, p = .02) compared to N-rich leaves (). Deciduous shrub %C and %N had no detectable responsible to burn status.
Figure 3. Carbon and N stocks and C:N of leaves (circle), stems (triangle), and whole plants (square) for four shrubs. Each row corresponds to the species denoted in the N stock column. Arithmetic mean and standard error are reported for C and N stocks, and geometric mean and standard deviation are reported for C:N.
We estimate that if changes in postfire stoichiometry had occurred in the absence of community turnover, mean community %N would have been 56 percent lower in recent burn plots and 38 percent lower in historic burn plots compared to if only changes in stoichiometry had occurred. This greater effect of community turnover compared to species-level stoichiometry is expected because the most and least N-rich species have an absolute difference in %N of 0.85 percent, whereas the %N of the most stoichiometrically flexible responsive species increased by just 0.52 percent (). Our %P analysis was limited by biomass to a few groups due to sampling limitation. Burn status did not significantly affect the %P of evergreen shrub leaves or stems (in contrast to increased %N), deciduous shrub or graminoid leaves, or lichen or moss biomass (Supplementary Table S1).
C, N, and P pool responses to burn history
Paralleling aboveground biomass loss patterns, at the community level, fire reduced plant and lichen C stock (F (2, 9) = 13.51, p = .002), with the effect greatest in the recent burn (77 percent reduction, p = .002) and a marginally significant effect in the historic burn compared to the reference (p = .08; ). Fire also impacted plant and lichen N stock (F (2, 9) = 12.11, p = .003); total N was 48 percent lower in the recent burn (p = .004) but had recovered to reference levels in the historic burn sites ().
These community-level responses to fire were driven by changes in lichen, evergreen shrub, graminoids, and lichen C and N pools (). Lichen C stocks (which represent 66 percent of the total community C pool in the reference areas) were significantly reduced relative to the reference following burn but did not recover even decades following fire (92 percent reduction in the recent burn, p = .04 and 92 percent reduction in the historic burn, p = .05). This effect was paralleled in the lichen N stocks (88 percent reduction in the recent burn, p = .004 and 70 percent reduction in the historic burn, p = .01); lichen represents 37 percent of the total N pool in the reference areas. Evergreen shrub C pool was reduced in the recent burn by 65 percent (p = .04) compared to the reference. This pattern was driven by the two dominant evergreen shrubs: R. subarcticum and V. vitis-idaea. Burn status did not affect evergreen shrub N stock. Though burn status did not affect graminoid C stock, graminoid N stock had a marginally significant increase of 421 percent (p = .09) in the recent burn compared to the reference.
R. subarcticum leaf and stem P and moss P stocks were not significantly different between burn treatments. In contrast, lichen P stock was reduced by 83 percent in recent burn (p = .005) and by 72 percent (p = .014) in the historic burn compared to the reference, consistent with the marked and sustained reduction in lichen biomass postfire.
Discussion
Despite the tundra being considered a resilient ecosystem following fire disturbance (Holling Citation1973), nearly five decades after fire the YKD plant and lichen community did not fully recover to its baseline condition. Fire severely reduced lichen and evergreen shrub biomass four years after fire, and lichen biomass continued to be reduced four decades following fire. Further, we found that fire reduced aboveground C and N pools immediately following fire; these pool sizes were not significantly different from nonburned areas within four decades following fire, despite the sustained loss of lichen. However, fire substantially decreased community-level C:N in the recent burn areas, and this effect continued in the historic burn, demonstrating a persistent shift in community-level C:N driven by increased community-level %N.
Altered plant community composition likely reflects both an increase in nutrient availability following fire and ecological differences among functional groups (Gaglioti et al. Citation2021). Although we did not directly measure soil nutrient pools, our results indicate that plant-available soil N was also not dramatically reduced by fire. This is likely due to increased access to deeper and more abundant pools of inorganic nutrients as the active layer thawed more deeply during the growing season following fire (Abbott et al. Citation2021). Accessing these deeper nutrient pools is likely to be linked with increased belowground biomass, something that would be expected given the transition toward a vascular-dominated plant community. Thus, the postfire redistribution of nutrients among PFTs appears to support resilience of plant community C and N pools by favoring the establishment of PFTs with relatively N-rich aboveground biomass (Racine et al. Citation2004).
Given the strong correlation between leaf N content and maximum photosynthetic rate, it is unsurprising that slow-growing, relatively N-poor lichens show little resilience to fire (Flexas and Carriquí [Citation2020] and references therein). Evergreen shrub was the only PFT whose biomass was significantly reduced in the recent burn but rebounded to baseline conditions in the historic burn and where %N increased within several years following burn (although this response did not persist over time). This pattern may reflect increased competition for N in the ecosystem, especially among vascular plants (Heim, Yurtaev et al. Citation2021) or the stoichiometric resilience of evergreen shrub PFTs as they grow over decades following burn (i.e., an initial increase in N uptake followed by reallocation increased nutrient availability toward growth of more C-rich biomass). Reduced evergreen shrub C:N in the recent burn was detectable at the whole plant, leaf, and stem levels. Notably, the most overt changes in evergreen shrub PFT nutrient content were found in increased stem %N, suggesting that lignified tissues were more stoichiometrically flexible than is frequently depicted in models (e.g., Jiang et al. Citation2015). Thus, the reduction in C:N in evergreen shrubs reflects both new stem growth as well as increased plant-available N following fire.
Intriguingly, the moss PFT—whose biomass was not significantly reduced by fire—had reduced biomass C:N (but not C:P) in the recent burn area relative to the reference and historic burn areas (driven by a significant increase in moss %N in recent burn). Within five years after fire, reduced bryophyte C:N suggests that mosses associated with N-fixing diazotrophs (unable to directly access newly plant-available soil N) may be able to co-opt on fire-driven abiotic changes that favor N fixation (i.e., warmer moss surfaces following lichen loss; Elzen et al. Citation2020). This ultimately yielded a nonsignificant increase in moss biomass in the historic burn areas, paralleling observations of increased bryophyte percentage cover multiple decades following burn in the YKD (Frost et al. Citation2020). Nonetheless, a high degree of interplot heterogeneity in aboveground biomass and species composition limited our ability to detect more subtle shifts in moss communities.
Studies of tundra aboveground community and nutrient stocks’ response to fire often focus on the shorter-term responses to fire as well as C:N shifts. However, as demonstrated here and elsewhere (e.g., Frost et al. Citation2020), there can be decadal impacts of tundra fires on aboveground community composition and element balance. This is particularly true for lichen; many studies conducted postfire have found that even 80 to 100 years after fire, lichen does not recover (Barrett et al. Citation2012; Hu et al. Citation2015; De Baets et al. Citation2016). Lichen is a key winter food source for caribou, Rangifer tarandus (Joly, Duffy, and Rupp Citation2012; Hu et al. Citation2015). Increased fire extent and frequency in arctic systems is expected to alter caribou mitigation patterns, with cascading socioeconomic and cultural implications (Chapin et al. Citation2008; Hu et al. Citation2015).
As Arctic warming accelerates, tundra ecosystems will likely become more susceptible to disturbances, raising the importance of longer-term studies. Our study highlights that tundra plant and lichen community response to fire—as estimated by changes in aboveground biomass—is consistent with what has been observed in other studies of lichen-dominated tundra (Frost et al. Citation2020; Heim, Bucharova et al. Citation2021). However, we observed that fire-driven shifts in the aboveground element balance can persist for decades despite the resilience of species-level C:N stoichiometry, suggesting that these biogeochemical changes may become more prevalent as fire frequency increases across the Arctic. Additional focus should also be paid to understanding how P stocks and belowground biomass response to tundra fires. There remains little data on P stocks and cycling dynamics in tundra ecosystems, especially postfire (Pold et al. Citation2022).
We observed that, over time, fire drives a redistribution of C and nutrients between functional types and shifts the tundra aboveground community toward mosses and evergreen shrubs that favor greater nutrients at the expense of slower-growing lichens, an effect that may be exacerbated by ongoing climate warming (Zamin, Bret-Harte, and Grogan Citation2014). This effect may alter the flammability of the Arctic. Though increased fire risk will further reduce lichen, a highly flammability species, that reduction in flammability will likely be outpaced by the increase in woody biomass driven by redistribution of nutrients and warming conditions (Gaglioti et al. Citation2021). Once established, these fire-responsive nutrient-rich PFTs may generate more rapidly cycling nutrient-rich litter, generating conditions less suitable for nutrient-poor, slow-growing lichens. Thus, fire may instigate a tipping point in vegetation structure and a novel biogeochemical regime in this lichen-rich area of the Arctic.
Author contributions
SAS, SMN, and NB acquired funding for this project. SMN, NB, and SAS conceived this project. NB and SAS completed the fieldwork. NB, GP, and SAS processed and analyzed the data and drafted the article. All authors contributed to editing and revising the article.
Supplemental Material
Download Zip (132.6 KB)Acknowledgments
We thank Rhys MacArthur, John Schade, Sarah Ludwig, Robert Newton, Paul Mann, and Bianca Rodriguez-Cardona for their assistance and support. We also thank the Polar Field Services for their logistical support, especially from Kevin Pettway and Robin Carroccia. We thank Alexander Barron for providing lab space. Finally, we thank Greg Fiske and Carl Churchill for providing mapping support.
Disclosure statement
No potential conflict of interest was reported by the authors.
Supplementary material
Supplemental data for this article can be accessed online at https://doi.org/10.1080/15230430.2022.2121246.
Additional information
Funding
Related Research Data
References
- Abbott, B. W., A. V. Rocha, A. Shogren, J. P. Zarnetske, F. Iannucci, W. B. Bowden, S. P. Bratsman, L. Patch, R. Watts, R. Fulweber, et al. 2021. Tundra wildfire triggers sustained lateral nutrient loss in Alaskan Arctic. Global Change Biology 27 (7):1408–30. doi:10.1111/gcb.15507.
- Alaska Interagency Coordination Center. n.d. Predictive services – maps/imagery/geospatial. https://fire.ak.blm.gov/predsvcs/maps.php
- Barrett, K., A. V. Rocha, M. J. van de Weg, and G. Shaver. 2012. Vegetation shifts observed in Arctic tundra 17 years after fire. Remote Sensing Letters 3 (8):729–36. doi:10.1080/2150704X.2012.676741.
- Bret-Harte, M. S., M. C. Mack, G. R. Shaver, D. C. Huebner, M. Johnston, C. A. Mojica, C. Pizano, and J. A. Reiskind. 2013. The response of Arctic vegetation and soils following an unusually severe tundra fire. Philosophical Transactions of the Royal Society B: Biological Sciences 368 (1624):20120490–20120490. doi:10.1098/rstb.2012.0490.
- Butler, O. M., J. Elser, T. Lewis, B. Mackey, and C. Chen. 2018. The phosphorus-rich signature of fire in the soil-plant system: A global meta-analysis. Ecology Letters 21 (3):335–44. doi:10.1111/ele.12896.
- Butler, O. M., T. Lewis, M. Rezaei Rashti, S. C. Maunsell, J. J. Elser, and C. Chen. 2019. The stoichiometric legacy of fire regime regulates the roles of micro-organisms and invertebrates in decomposition. Ecology 100 (7):e02732. doi:10.1002/ecy.2732.
- Chapin, F. S., S. F. Trainor, O. Huntington, A. L. Lovecraft, E. Zavaleta, D. C. Natcher, A. D. McGuire, J. L. Nelson, L. Ray, M. Calef, et al. 2008. Increasing wildfire in Alaska’s boreal forest: Pathways to potential solutions of a wicked problem. BioScience 58 (6):531–40. doi:10.1641/B580609.
- De Baets, S., M. J. van de Weg, R. Lewis, N. Steinberg, J. Meersmans, T. A. Quine, G. R. Shaver, and I. P. Hartley. 2016. Investigating the controls on soil organic matter decomposition in tussock tundra soil and permafrost after fire. Soil Biology and Biochemistry 99:108–16. doi:10.1016/j.soilbio.2016.04.020.
- Dijkstra, F. A., and M. A. Adams. 2015. Fire eases imbalances of nitrogen and phosphorus in woody plants. Ecosystems 18 (5):769–79. doi:10.1007/s10021-015-9861-1.
- Farukh, M. A., and H. Hayasaka. 2012. Active forest fire occurrences in severe lightning years in Alaska. Journal of Natural Disaster Science 33 (2):71–84. doi:10.2328/jnds.33.71.
- Flexas, J., and M. Carriquí. 2020. Photosynthesis and photosynthetic efficiencies along the terrestrial plant’s phylogeny: Lessons for improving crop photosynthesis. The Plant Journal 101 (4):964–78. doi:10.1111/tpj.14651.
- French, N. H. F., L. K. Jenkins, T. V. Loboda, M. Flannigan, R. Jandt, L. L. Bourgeau-Chavez, and M. Whitley. 2015. Fire in Arctic tundra of Alaska: Past fire activity, future fire potential, and significance for land management and ecology. International Journal of Wildland Fire 24 (8):1045. doi:10.1071/WF14167.
- Frost, G. V., R. A. Loehman, L. B. Saperstein, M. J. Macander, P. R. Nelson, D. P. Paradis, and S. M. Natali. 2020. Multi-decadal patterns of vegetation succession after tundra fire on the Yukon-Kuskokwim Delta, Alaska. Environmental Research Letters 15 (2):025003. doi:10.1088/1748-9326/ab5f49.
- Gaglioti, B. V., L. T. Berner, B. M. Jones, K. M. Orndahl, A. P. Williams, L. Andreu‐Hayles, R. D. D’Arrigo, S. J. Goetz, and D. H. Mann. 2021. Tussocks enduring or shrubs greening: alternate responses to changing fire regimes in the Noatak River Valley, Alaska. Journal of Geophysical Research: Biogeosciences 126 (4):e2020JG006009. doi:10.1029/2020JG006009.
- Heim, R. J., A. Bucharova, L. Brodt, J. Kamp, D. Rieker, A. V. Soromotin, A. Yurtaev, and N. Hölzel. 2021. Post-fire vegetation succession in the Siberian subarctic tundra over 45 years. The Science of the Total Environment 760:143425. doi:10.1016/j.scitotenv.2020.143425.
- Heim, R. J., A. Yurtaev, A. Bucharova, W. Heim, V. Kutskir, K.-H. Knorr, C. Lampei, A. Pechkin, D. Schilling, F. Sulkarnaev, et al. 2021. Fire in lichen-rich subarctic tundra changes carbon and nitrogen cycling between ecosystem compartments but has minor effects on stocks. Biogeosciences Discussions 1–18. doi:10.5194/bg-2021-277.
- Hewitt, R. E., D. L. Taylor, H. Genet, A. D. McGuire, and M. C. Mack. 2019. Below-ground plant traits influence tundra plant acquisition of newly thawed permafrost nitrogen. Journal of Ecology 107 (2):950–62. doi:10.1111/1365-2745.13062.
- Higuera, P. E., L. B. Brubaker, P. M. Anderson, T. A. Brown, A. T. Kennedy, and F. S. Hu. 2008. Frequent fires in ancient shrub tundra: Implications of paleorecords for arctic environmental change. Plos One 3 (3):e0001744. doi:10.1371/journal.pone.0001744.
- Holling, C. S. 1973. Resilience and stability of ecological systems. Annual Review of Ecology and Systematics 4 (1):1–23. doi:10.1146/annurev.es.04.110173.000245.
- Hu, F. S., P. E. Higuera, P. Duffy, M. L. Chipman, A. V. Rocha, A. M. Young, R. Kelly, and M. C. Dietze. 2015. Arctic tundra fires: Natural variability and responses to climate change. Frontiers in Ecology and the Environment 13 (7):369–77. doi:10.1890/150063.
- Hung, J., S. Natali, N. Baillargeon, S. Sistla, G. Pold et al, 2022. Polaris Project 2018: Vegetation biomass, plot characterization, point intercept, and thaw depth, Yukon-Kuskokwim Delta, Alaska. Arctic Data Center. doi:10.18739/A2D795C0Q.
- Isles, P. D. F. 2020. The misuse of ratios in ecological stoichiometry. Ecology 101 (11):e03153. doi:10.1002/ecy.3153.
- Jiang, Y., E. B. Rastetter, A. V. Rocha, A. R. Pearce, B. L. Kwiatkowski, and G. R. Shaver. 2015. Modeling carbon–nutrient interactions during the early recovery of tundra after fire. Ecological Applications 25 (6):1640–52. doi:10.1890/14-1921.1.
- Jiang, Y., E. B. Rastetter, G. R. Shaver, A. V. Rocha, Q. Zhuang, and B. L. Kwiatkowski. 2017. Modeling long-term changes in tundra carbon balance following wildfire, climate change, and potential nutrient addition. Ecological Applications 27 (1):105–17. doi:10.1002/eap.1413.
- Joly, K., P. A. Duffy, and T. S. Rupp. 2012. Simulating the effects of climate change on fire regimes in Arctic biomes: Implications for caribou and moose habitat. Ecosphere 3 (5):art36. doi:10.1890/ES12-00012.1.
- Jones, B. M., A. L. Breen, B. V. Gaglioti, D. H. Mann, A. V. Rocha, G. Grosse, C. D. Arp, M. L. Kunz, and D. A. Walker. 2013. Identification of unrecognized tundra fire events on the north slope of Alaska. Journal of Geophysical Research: Biogeosciences 118 (3):1334–44. doi:10.1002/jgrg.20113.
- Klupar, I., A. V. Rocha, and E. B. Rastetter. 2021. Alleviation of nutrient co-limitation induces regime shifts in post-fire community composition and productivity in Arctic tundra. Global Change Biology 27 (14):3324–35. doi:10.1111/gcb.15646.
- Lenth, R. V. 2021. emmeans: Estimated marginal means, aka least-squares means. R package version 1.6.1. https://CRAN.R-project.org/package=emmeans
- Mack, M. C., M. S. Bret-Harte, T. N. Hollingsworth, R. R. Jandt, E. A. G. Schuur, G. R. Shaver, and D. L. Verbyla. 2011. Carbon loss from an unprecedented Arctic tundra wildfire. Nature 475 (7357):489–92. doi:10.1038/nature10283.
- Mack, M. C., E. A. G. Schuur, M. S. Bret-Harte, G. R. Shaver, and F. S. Chapin. 2004. Ecosystem carbon storage in Arctic tundra reduced by long-term nutrient fertilization. Nature 431 (7007):440–43. doi:10.1038/nature02887.
- Narita, K., K. Harada, K. Saito, Y. Sawada, M. Fukuda, and S. Tsuyuzaki. 2015. Vegetation and permafrost thaw depth 10 years after a tundra fire in 2002, Seward Peninsula, Alaska. Arctic, Antarctic, and Alpine Research 47 (3):547–59. doi:10.1657/AAAR0013-031.
- Partain, J. L., S. Alden, H. Strader, U. S. Bhatt, P. A. Bieniek, B. R. Brettschneider, J. E. Walsh, R. T. Lader, P. Q. Olsson, T. S. Rupp, et al. 2016. An assessment of the role of anthropogenic climate change in the Alaska fire season of 2015. Bulletin of the American Meteorological Society 97 (12):S14–S18. doi:10.1175/BAMS-D-16-0149.1.
- Pellegrini, A. F. A., A. Ahlström, S. E. Hobbie, P. B. Reich, L. P. Nieradzik, A. C. Staver, B. C. Scharenbroch, A. Jumpponen, W. R. L. Anderegg, J. T. Randerson, et al. 2018. Fire frequency drives decadal changes in soil carbon and nitrogen and ecosystem productivity. Nature 553 (7687):194–98. doi:10.1038/nature24668.
- Pinheiro, J., D. Bates, S. DebRoy, and D. Sarkar, R Core Team. 2021. nlme: Linear and nonlinear mixed effects models. R package version 3. 1–153. https://CRAN.R-project.org/package=nlme
- Pold, G., B. L. Kwiatkowski, E. B. Rastetter, and S. A. Sistla. 2022. Sporadic P limitation constrains microbial growth and facilitates SOM accumulation in the stoichiometrically coupled, acclimating microbe–plant–soil model. Soil Biology and Biochemistry 165:108489. doi:10.1016/j.soilbio.2021.108489.
- Racine, C., R. Jandt, C. Meyers, and J. Dennis. 2004. Tundra fire and vegetation change along a hillslope on the Seward Peninsula, Alaska, U.S.A. Arctic, Antarctic, and Alpine Research 36 (1):1–10. doi:10.1657/1523-0430(2004)036[0001:TFAVCA]2.0.CO;2.
- R Core Team. 2018. R: A language and environment for statistical computing. Vienna, Austria: R Foundation for Statistical Computing.
- Sae-Lim, J., J. M. Russell, R. S. Vachula, R. M. Holmes, P. J. Mann, J. D. Schade, and S. M. Natali. 2019. Temperature-controlled tundra fire severity and frequency during the last millennium in the Yukon-Kuskokwim Delta, Alaska. The Holocene 29 (7):1223–33. doi:10.1177/0959683619838036.
- Salmon, V. G., P. Soucy, M. Mauritz, G. Celis, S. M. Natali, M. C. Mack, and E. A. G. Schuur. 2016. Nitrogen availability increases in a tundra ecosystem during five years of experimental permafrost thaw. Global Change Biology 22 (5):1927–41. doi:10.1111/gcb.13204.
- Sistla, S. A., A. P. Appling, A. M. Lewandowska, B. N. Taylor, and A. A. Wolf. 2015. Stoichiometric flexibility in response to fertilization along gradients of environmental and organismal nutrient richness. Oikos 124 (7):949–59. doi:10.1111/oik.02385.
- Sistla, S. A., and J. P. Schimel. 2012. Stoichiometric flexibility as a regulator of carbon and nutrient cycling in terrestrial ecosystems under change. New Phytologist 196 (1):68–78. doi:10.1111/j.1469-8137.2012.04234.x.
- Talucci, A. C., M. M. Loranty, and H. D. Alexander. 2022. Siberian taiga and tundra fire regimes from 2001–2020. Environmental Research Letters 17 (2):025001. doi:10.1088/1748-9326/ac3f07.
- Taylor, P. C., W. Maslowski, J. Perlwitz, D. J. Wuebbles, D. J. Wuebbles, D. W. Fahey, K. A. Hibbard, D. J. Dokken, B. C. Stewart, and T. K. Maycock. 2017. Ch. 11: Arctic changes and their effects on Alaska and the rest of the United States. Climate Science Special Report: Fourth National Climate Assessment, Volume I. U.S. Global Change Research Program. doi:10.7930/J00863GK.
- Toberman, H., C. Chen, T. Lewis, and J. J. Elser. 2014. High-frequency fire alters C: N : P stoichiometry in forest litter. Global Change Biology 20 (7):2321–31. doi:10.1111/gcb.12432.
- Tsuyuzaki, S., G. Iwahana, and K. Saito. 2018. Tundra fire alters vegetation patterns more than the resultant thermokarst. Polar Biology 41 (4):753–61. doi:10.1007/s00300-017-2236-7.
- van den Elzen, E., F. Bengtsson, C. Fritz, H. Rydin, and L. P. M. Lamers. 2020. Variation in symbiotic N2 fixation rates among Sphagnum mosses. PLoS One 15 (2):e0228383. doi:10.1371/journal.pone.0228383.
- Young, A. M., P. E. Higuera, P. A. Duffy, and F. S. Hu. 2017. Climatic thresholds shape northern high-latitude fire regimes and imply vulnerability to future climate change. Ecography 40 (5):606–17. doi:10.1111/ecog.02205.
- Zamin, T. J., M. S. Bret-Harte, and P. Grogan. 2014. Evergreen shrubs dominate responses to experimental summer warming and fertilization in Canadian mesic low Arctic tundra. Journal of Ecology 102 (3):749–66. doi:10.1111/1365-2745.12237.